Free Statistics

of Irreproducible Research!

Author's title

Author*The author of this computation has been verified*
R Software Modulerwasp_exponentialsmoothing.wasp
Title produced by softwareExponential Smoothing
Date of computationSun, 18 Dec 2016 14:40:35 +0100
Cite this page as followsStatistical Computations at FreeStatistics.org, Office for Research Development and Education, URL https://freestatistics.org/blog/index.php?v=date/2016/Dec/18/t1482068568chwmkbh4w7dn1tk.htm/, Retrieved Fri, 01 Nov 2024 03:47:07 +0000
Statistical Computations at FreeStatistics.org, Office for Research Development and Education, URL https://freestatistics.org/blog/index.php?pk=301088, Retrieved Fri, 01 Nov 2024 03:47:07 +0000
QR Codes:

Original text written by user:
IsPrivate?No (this computation is public)
User-defined keywords
Estimated Impact103
Family? (F = Feedback message, R = changed R code, M = changed R Module, P = changed Parameters, D = changed Data)
-       [Exponential Smoothing] [] [2016-12-18 13:40:35] [94ac3c9a028ddd47e8862e80eac9f626] [Current]
Feedback Forum

Post a new message
Dataseries X:
295
520
550
610
775
885
965
475
875
1330
1635
920
1700
1465
1190
1390
1580
1775
1975
2440
2160
2670
3340
3230
2175
2035
3520
3945
2920
2495
2630
3610
5020
5755
7040
5345
4260
4785
3735
2980
2910


Summary of computational transaction
Raw Input view raw input (R code)
Raw Outputview raw output of R engine
Computing time1 seconds
R ServerBig Analytics Cloud Computing Center

\begin{tabular}{lllllllll}
\hline
Summary of computational transaction \tabularnewline
Raw Input view raw input (R code)  \tabularnewline
Raw Outputview raw output of R engine  \tabularnewline
Computing time1 seconds \tabularnewline
R ServerBig Analytics Cloud Computing Center \tabularnewline
\hline
\end{tabular}
%Source: https://freestatistics.org/blog/index.php?pk=301088&T=0

[TABLE]
[ROW]
Summary of computational transaction[/C][/ROW] [ROW]Raw Input[/C] view raw input (R code) [/C][/ROW] [ROW]Raw Output[/C]view raw output of R engine [/C][/ROW] [ROW]Computing time[/C]1 seconds[/C][/ROW] [ROW]R Server[/C]Big Analytics Cloud Computing Center[/C][/ROW] [/TABLE] Source: https://freestatistics.org/blog/index.php?pk=301088&T=0

Globally Unique Identifier (entire table): ba.freestatistics.org/blog/index.php?pk=301088&T=0

As an alternative you can also use a QR Code:  

The GUIDs for individual cells are displayed in the table below:

Summary of computational transaction
Raw Input view raw input (R code)
Raw Outputview raw output of R engine
Computing time1 seconds
R ServerBig Analytics Cloud Computing Center


Estimated Parameters of Exponential Smoothing
ParameterValue
alpha1
beta0.0195819256993591
gammaFALSE

\begin{tabular}{lllllllll}
\hline
Estimated Parameters of Exponential Smoothing \tabularnewline
Parameter & Value \tabularnewline
alpha & 1 \tabularnewline
beta & 0.0195819256993591 \tabularnewline
gamma & FALSE \tabularnewline
\hline
\end{tabular}
%Source: https://freestatistics.org/blog/index.php?pk=301088&T=1

[TABLE]
[ROW][C]Estimated Parameters of Exponential Smoothing[/C][/ROW]
[ROW][C]Parameter[/C][C]Value[/C][/ROW]
[ROW][C]alpha[/C][C]1[/C][/ROW]
[ROW][C]beta[/C][C]0.0195819256993591[/C][/ROW]
[ROW][C]gamma[/C][C]FALSE[/C][/ROW]
[/TABLE]
Source: https://freestatistics.org/blog/index.php?pk=301088&T=1

Globally Unique Identifier (entire table): ba.freestatistics.org/blog/index.php?pk=301088&T=1

As an alternative you can also use a QR Code:  

The GUIDs for individual cells are displayed in the table below:

Estimated Parameters of Exponential Smoothing
ParameterValue
alpha1
beta0.0195819256993591
gammaFALSE


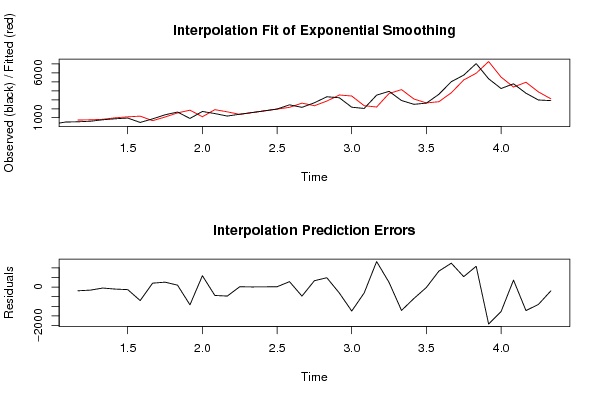
Interpolation Forecasts of Exponential Smoothing
tObservedFittedResiduals
3550745-195
4610771.181524488625-161.181524488625
5775828.025279851979-53.0252798519793
6885991.98694276173-106.98694276173
79651099.89193239777-134.891932397768
84751177.25048860011-702.250488600112
9875673.499071710006201.500928289994
1013301077.44484791613252.555152083867
1116351537.3903641392397.6096358607706
129201844.3017487762-924.301748776197
1317001111.20214060787588.797859392127
1414651902.73193654243-437.731936542432
1511901659.16030228482-469.160302284821
1613901374.9732401043915.0267598956091
1715801575.267493000174.73250699983123
1817751765.360164600619.63983539938886
1919751960.5489311411614.4510688588439
2024402160.83191089783279.168089102174
2121602631.29855967626-471.298559676257
2226702342.06962629846327.930373701538
2333402858.49113451085481.508865489152
2432303537.92000533844-307.920005338439
2521753421.89033867256-1246.89033867256
2620352342.47382470542-307.473824705421
2735202196.452895115541323.54710488446
2839453707.37049618299237.629503817009
2929204137.02373947071-1217.02373947071
3024953088.19207103004-593.19207103004
3126302651.57622796968-21.5762279696805
3236102786.15372387671823.846276123294
3350203782.286220443451237.71377955655
3457555216.5230397118538.476960288204
3570405962.067455538981077.93254446102
3653457268.17545053353-1923.17545053353
3742605535.51597175435-1275.51597175435
3847854425.53891276711359.461087232886
3937354957.57785306912-1222.57785306912
4029803883.63742438864-903.637424388638
4129103110.9424634851-200.942463485099

\begin{tabular}{lllllllll}
\hline
Interpolation Forecasts of Exponential Smoothing \tabularnewline
t & Observed & Fitted & Residuals \tabularnewline
3 & 550 & 745 & -195 \tabularnewline
4 & 610 & 771.181524488625 & -161.181524488625 \tabularnewline
5 & 775 & 828.025279851979 & -53.0252798519793 \tabularnewline
6 & 885 & 991.98694276173 & -106.98694276173 \tabularnewline
7 & 965 & 1099.89193239777 & -134.891932397768 \tabularnewline
8 & 475 & 1177.25048860011 & -702.250488600112 \tabularnewline
9 & 875 & 673.499071710006 & 201.500928289994 \tabularnewline
10 & 1330 & 1077.44484791613 & 252.555152083867 \tabularnewline
11 & 1635 & 1537.39036413923 & 97.6096358607706 \tabularnewline
12 & 920 & 1844.3017487762 & -924.301748776197 \tabularnewline
13 & 1700 & 1111.20214060787 & 588.797859392127 \tabularnewline
14 & 1465 & 1902.73193654243 & -437.731936542432 \tabularnewline
15 & 1190 & 1659.16030228482 & -469.160302284821 \tabularnewline
16 & 1390 & 1374.97324010439 & 15.0267598956091 \tabularnewline
17 & 1580 & 1575.26749300017 & 4.73250699983123 \tabularnewline
18 & 1775 & 1765.36016460061 & 9.63983539938886 \tabularnewline
19 & 1975 & 1960.54893114116 & 14.4510688588439 \tabularnewline
20 & 2440 & 2160.83191089783 & 279.168089102174 \tabularnewline
21 & 2160 & 2631.29855967626 & -471.298559676257 \tabularnewline
22 & 2670 & 2342.06962629846 & 327.930373701538 \tabularnewline
23 & 3340 & 2858.49113451085 & 481.508865489152 \tabularnewline
24 & 3230 & 3537.92000533844 & -307.920005338439 \tabularnewline
25 & 2175 & 3421.89033867256 & -1246.89033867256 \tabularnewline
26 & 2035 & 2342.47382470542 & -307.473824705421 \tabularnewline
27 & 3520 & 2196.45289511554 & 1323.54710488446 \tabularnewline
28 & 3945 & 3707.37049618299 & 237.629503817009 \tabularnewline
29 & 2920 & 4137.02373947071 & -1217.02373947071 \tabularnewline
30 & 2495 & 3088.19207103004 & -593.19207103004 \tabularnewline
31 & 2630 & 2651.57622796968 & -21.5762279696805 \tabularnewline
32 & 3610 & 2786.15372387671 & 823.846276123294 \tabularnewline
33 & 5020 & 3782.28622044345 & 1237.71377955655 \tabularnewline
34 & 5755 & 5216.5230397118 & 538.476960288204 \tabularnewline
35 & 7040 & 5962.06745553898 & 1077.93254446102 \tabularnewline
36 & 5345 & 7268.17545053353 & -1923.17545053353 \tabularnewline
37 & 4260 & 5535.51597175435 & -1275.51597175435 \tabularnewline
38 & 4785 & 4425.53891276711 & 359.461087232886 \tabularnewline
39 & 3735 & 4957.57785306912 & -1222.57785306912 \tabularnewline
40 & 2980 & 3883.63742438864 & -903.637424388638 \tabularnewline
41 & 2910 & 3110.9424634851 & -200.942463485099 \tabularnewline
\hline
\end{tabular}
%Source: https://freestatistics.org/blog/index.php?pk=301088&T=2

[TABLE]
[ROW][C]Interpolation Forecasts of Exponential Smoothing[/C][/ROW]
[ROW][C]t[/C][C]Observed[/C][C]Fitted[/C][C]Residuals[/C][/ROW]
[ROW][C]3[/C][C]550[/C][C]745[/C][C]-195[/C][/ROW]
[ROW][C]4[/C][C]610[/C][C]771.181524488625[/C][C]-161.181524488625[/C][/ROW]
[ROW][C]5[/C][C]775[/C][C]828.025279851979[/C][C]-53.0252798519793[/C][/ROW]
[ROW][C]6[/C][C]885[/C][C]991.98694276173[/C][C]-106.98694276173[/C][/ROW]
[ROW][C]7[/C][C]965[/C][C]1099.89193239777[/C][C]-134.891932397768[/C][/ROW]
[ROW][C]8[/C][C]475[/C][C]1177.25048860011[/C][C]-702.250488600112[/C][/ROW]
[ROW][C]9[/C][C]875[/C][C]673.499071710006[/C][C]201.500928289994[/C][/ROW]
[ROW][C]10[/C][C]1330[/C][C]1077.44484791613[/C][C]252.555152083867[/C][/ROW]
[ROW][C]11[/C][C]1635[/C][C]1537.39036413923[/C][C]97.6096358607706[/C][/ROW]
[ROW][C]12[/C][C]920[/C][C]1844.3017487762[/C][C]-924.301748776197[/C][/ROW]
[ROW][C]13[/C][C]1700[/C][C]1111.20214060787[/C][C]588.797859392127[/C][/ROW]
[ROW][C]14[/C][C]1465[/C][C]1902.73193654243[/C][C]-437.731936542432[/C][/ROW]
[ROW][C]15[/C][C]1190[/C][C]1659.16030228482[/C][C]-469.160302284821[/C][/ROW]
[ROW][C]16[/C][C]1390[/C][C]1374.97324010439[/C][C]15.0267598956091[/C][/ROW]
[ROW][C]17[/C][C]1580[/C][C]1575.26749300017[/C][C]4.73250699983123[/C][/ROW]
[ROW][C]18[/C][C]1775[/C][C]1765.36016460061[/C][C]9.63983539938886[/C][/ROW]
[ROW][C]19[/C][C]1975[/C][C]1960.54893114116[/C][C]14.4510688588439[/C][/ROW]
[ROW][C]20[/C][C]2440[/C][C]2160.83191089783[/C][C]279.168089102174[/C][/ROW]
[ROW][C]21[/C][C]2160[/C][C]2631.29855967626[/C][C]-471.298559676257[/C][/ROW]
[ROW][C]22[/C][C]2670[/C][C]2342.06962629846[/C][C]327.930373701538[/C][/ROW]
[ROW][C]23[/C][C]3340[/C][C]2858.49113451085[/C][C]481.508865489152[/C][/ROW]
[ROW][C]24[/C][C]3230[/C][C]3537.92000533844[/C][C]-307.920005338439[/C][/ROW]
[ROW][C]25[/C][C]2175[/C][C]3421.89033867256[/C][C]-1246.89033867256[/C][/ROW]
[ROW][C]26[/C][C]2035[/C][C]2342.47382470542[/C][C]-307.473824705421[/C][/ROW]
[ROW][C]27[/C][C]3520[/C][C]2196.45289511554[/C][C]1323.54710488446[/C][/ROW]
[ROW][C]28[/C][C]3945[/C][C]3707.37049618299[/C][C]237.629503817009[/C][/ROW]
[ROW][C]29[/C][C]2920[/C][C]4137.02373947071[/C][C]-1217.02373947071[/C][/ROW]
[ROW][C]30[/C][C]2495[/C][C]3088.19207103004[/C][C]-593.19207103004[/C][/ROW]
[ROW][C]31[/C][C]2630[/C][C]2651.57622796968[/C][C]-21.5762279696805[/C][/ROW]
[ROW][C]32[/C][C]3610[/C][C]2786.15372387671[/C][C]823.846276123294[/C][/ROW]
[ROW][C]33[/C][C]5020[/C][C]3782.28622044345[/C][C]1237.71377955655[/C][/ROW]
[ROW][C]34[/C][C]5755[/C][C]5216.5230397118[/C][C]538.476960288204[/C][/ROW]
[ROW][C]35[/C][C]7040[/C][C]5962.06745553898[/C][C]1077.93254446102[/C][/ROW]
[ROW][C]36[/C][C]5345[/C][C]7268.17545053353[/C][C]-1923.17545053353[/C][/ROW]
[ROW][C]37[/C][C]4260[/C][C]5535.51597175435[/C][C]-1275.51597175435[/C][/ROW]
[ROW][C]38[/C][C]4785[/C][C]4425.53891276711[/C][C]359.461087232886[/C][/ROW]
[ROW][C]39[/C][C]3735[/C][C]4957.57785306912[/C][C]-1222.57785306912[/C][/ROW]
[ROW][C]40[/C][C]2980[/C][C]3883.63742438864[/C][C]-903.637424388638[/C][/ROW]
[ROW][C]41[/C][C]2910[/C][C]3110.9424634851[/C][C]-200.942463485099[/C][/ROW]
[/TABLE]
Source: https://freestatistics.org/blog/index.php?pk=301088&T=2

Globally Unique Identifier (entire table): ba.freestatistics.org/blog/index.php?pk=301088&T=2

As an alternative you can also use a QR Code:  

The GUIDs for individual cells are displayed in the table below:

Interpolation Forecasts of Exponential Smoothing
tObservedFittedResiduals
3550745-195
4610771.181524488625-161.181524488625
5775828.025279851979-53.0252798519793
6885991.98694276173-106.98694276173
79651099.89193239777-134.891932397768
84751177.25048860011-702.250488600112
9875673.499071710006201.500928289994
1013301077.44484791613252.555152083867
1116351537.3903641392397.6096358607706
129201844.3017487762-924.301748776197
1317001111.20214060787588.797859392127
1414651902.73193654243-437.731936542432
1511901659.16030228482-469.160302284821
1613901374.9732401043915.0267598956091
1715801575.267493000174.73250699983123
1817751765.360164600619.63983539938886
1919751960.5489311411614.4510688588439
2024402160.83191089783279.168089102174
2121602631.29855967626-471.298559676257
2226702342.06962629846327.930373701538
2333402858.49113451085481.508865489152
2432303537.92000533844-307.920005338439
2521753421.89033867256-1246.89033867256
2620352342.47382470542-307.473824705421
2735202196.452895115541323.54710488446
2839453707.37049618299237.629503817009
2929204137.02373947071-1217.02373947071
3024953088.19207103004-593.19207103004
3126302651.57622796968-21.5762279696805
3236102786.15372387671823.846276123294
3350203782.286220443451237.71377955655
3457555216.5230397118538.476960288204
3570405962.067455538981077.93254446102
3653457268.17545053353-1923.17545053353
3742605535.51597175435-1275.51597175435
3847854425.53891276711359.461087232886
3937354957.57785306912-1222.57785306912
4029803883.63742438864-903.637424388638
4129103110.9424634851-200.942463485099


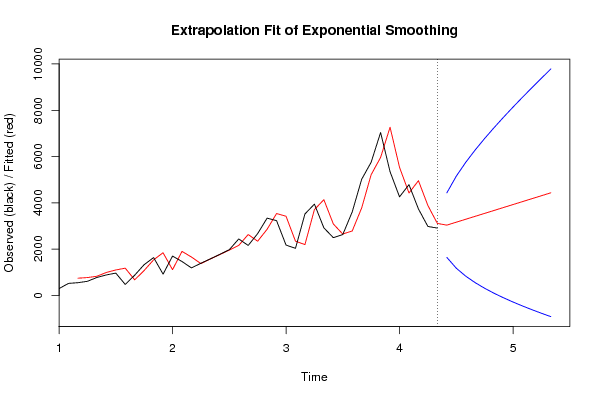
Extrapolation Forecasts of Exponential Smoothing
tForecast95% Lower Bound95% Upper Bound
423037.007623095291644.956624990184429.0586212004
433164.015246190581175.989350141455152.0411422397
443291.02286928586832.4035297891355749.64220878259
453418.03049238115551.5032604645566284.55772429775
463545.03811547644309.262935072836780.81329588005
473672.0457385717393.48693545350497250.60454168995
483799.05336166701-102.9961958775777701.1029192116
493926.0609847623-284.8118529081598136.93382243276
504053.06860785759-455.1402531318358561.27746884701
514180.07623095288-616.273224392288976.42568629803
524307.08385404816-769.9230452900039384.09075338633
534434.09147714345-917.4060814053779785.58903569228

\begin{tabular}{lllllllll}
\hline
Extrapolation Forecasts of Exponential Smoothing \tabularnewline
t & Forecast & 95% Lower Bound & 95% Upper Bound \tabularnewline
42 & 3037.00762309529 & 1644.95662499018 & 4429.0586212004 \tabularnewline
43 & 3164.01524619058 & 1175.98935014145 & 5152.0411422397 \tabularnewline
44 & 3291.02286928586 & 832.403529789135 & 5749.64220878259 \tabularnewline
45 & 3418.03049238115 & 551.503260464556 & 6284.55772429775 \tabularnewline
46 & 3545.03811547644 & 309.26293507283 & 6780.81329588005 \tabularnewline
47 & 3672.04573857173 & 93.4869354535049 & 7250.60454168995 \tabularnewline
48 & 3799.05336166701 & -102.996195877577 & 7701.1029192116 \tabularnewline
49 & 3926.0609847623 & -284.811852908159 & 8136.93382243276 \tabularnewline
50 & 4053.06860785759 & -455.140253131835 & 8561.27746884701 \tabularnewline
51 & 4180.07623095288 & -616.27322439228 & 8976.42568629803 \tabularnewline
52 & 4307.08385404816 & -769.923045290003 & 9384.09075338633 \tabularnewline
53 & 4434.09147714345 & -917.406081405377 & 9785.58903569228 \tabularnewline
\hline
\end{tabular}
%Source: https://freestatistics.org/blog/index.php?pk=301088&T=3

[TABLE]
[ROW][C]Extrapolation Forecasts of Exponential Smoothing[/C][/ROW]
[ROW][C]t[/C][C]Forecast[/C][C]95% Lower Bound[/C][C]95% Upper Bound[/C][/ROW]
[ROW][C]42[/C][C]3037.00762309529[/C][C]1644.95662499018[/C][C]4429.0586212004[/C][/ROW]
[ROW][C]43[/C][C]3164.01524619058[/C][C]1175.98935014145[/C][C]5152.0411422397[/C][/ROW]
[ROW][C]44[/C][C]3291.02286928586[/C][C]832.403529789135[/C][C]5749.64220878259[/C][/ROW]
[ROW][C]45[/C][C]3418.03049238115[/C][C]551.503260464556[/C][C]6284.55772429775[/C][/ROW]
[ROW][C]46[/C][C]3545.03811547644[/C][C]309.26293507283[/C][C]6780.81329588005[/C][/ROW]
[ROW][C]47[/C][C]3672.04573857173[/C][C]93.4869354535049[/C][C]7250.60454168995[/C][/ROW]
[ROW][C]48[/C][C]3799.05336166701[/C][C]-102.996195877577[/C][C]7701.1029192116[/C][/ROW]
[ROW][C]49[/C][C]3926.0609847623[/C][C]-284.811852908159[/C][C]8136.93382243276[/C][/ROW]
[ROW][C]50[/C][C]4053.06860785759[/C][C]-455.140253131835[/C][C]8561.27746884701[/C][/ROW]
[ROW][C]51[/C][C]4180.07623095288[/C][C]-616.27322439228[/C][C]8976.42568629803[/C][/ROW]
[ROW][C]52[/C][C]4307.08385404816[/C][C]-769.923045290003[/C][C]9384.09075338633[/C][/ROW]
[ROW][C]53[/C][C]4434.09147714345[/C][C]-917.406081405377[/C][C]9785.58903569228[/C][/ROW]
[/TABLE]
Source: https://freestatistics.org/blog/index.php?pk=301088&T=3

Globally Unique Identifier (entire table): ba.freestatistics.org/blog/index.php?pk=301088&T=3

As an alternative you can also use a QR Code:  

The GUIDs for individual cells are displayed in the table below:

Extrapolation Forecasts of Exponential Smoothing
tForecast95% Lower Bound95% Upper Bound
423037.007623095291644.956624990184429.0586212004
433164.015246190581175.989350141455152.0411422397
443291.02286928586832.4035297891355749.64220878259
453418.03049238115551.5032604645566284.55772429775
463545.03811547644309.262935072836780.81329588005
473672.0457385717393.48693545350497250.60454168995
483799.05336166701-102.9961958775777701.1029192116
493926.0609847623-284.8118529081598136.93382243276
504053.06860785759-455.1402531318358561.27746884701
514180.07623095288-616.273224392288976.42568629803
524307.08385404816-769.9230452900039384.09075338633
534434.09147714345-917.4060814053779785.58903569228


Parameters (Session):
par1 = 1 ; par2 = 1 ; par3 = 0 ; par4 = 12 ;
Parameters (R input):
par1 = 12 ; par2 = Double ; par3 = additive ; par4 = 12 ;
R code (references can be found in the software module):
par1 <- as.numeric(par1)
par4 <- as.numeric(par4)
if (par2 == 'Single') K <- 1
if (par2 == 'Double') K <- 2
if (par2 == 'Triple') K <- par1
nx <- length(x)
nxmK <- nx - K
x <- ts(x, frequency = par1)
if (par2 == 'Single') fit <- HoltWinters(x, gamma=F, beta=F)
if (par2 == 'Double') fit <- HoltWinters(x, gamma=F)
if (par2 == 'Triple') fit <- HoltWinters(x, seasonal=par3)
fit
myresid <- x - fit$fitted[,'xhat']
bitmap(file='test1.png')
op <- par(mfrow=c(2,1))
plot(fit,ylab='Observed (black) / Fitted (red)',main='Interpolation Fit of Exponential Smoothing')
plot(myresid,ylab='Residuals',main='Interpolation Prediction Errors')
par(op)
dev.off()
bitmap(file='test2.png')
p <- predict(fit, par4, prediction.interval=TRUE)
np <- length(p[,1])
plot(fit,p,ylab='Observed (black) / Fitted (red)',main='Extrapolation Fit of Exponential Smoothing')
dev.off()
bitmap(file='test3.png')
op <- par(mfrow = c(2,2))
acf(as.numeric(myresid),lag.max = nx/2,main='Residual ACF')
spectrum(myresid,main='Residals Periodogram')
cpgram(myresid,main='Residal Cumulative Periodogram')
qqnorm(myresid,main='Residual Normal QQ Plot')
qqline(myresid)
par(op)
dev.off()
load(file='createtable')
a<-table.start()
a<-table.row.start(a)
a<-table.element(a,'Estimated Parameters of Exponential Smoothing',2,TRUE)
a<-table.row.end(a)
a<-table.row.start(a)
a<-table.element(a,'Parameter',header=TRUE)
a<-table.element(a,'Value',header=TRUE)
a<-table.row.end(a)
a<-table.row.start(a)
a<-table.element(a,'alpha',header=TRUE)
a<-table.element(a,fit$alpha)
a<-table.row.end(a)
a<-table.row.start(a)
a<-table.element(a,'beta',header=TRUE)
a<-table.element(a,fit$beta)
a<-table.row.end(a)
a<-table.row.start(a)
a<-table.element(a,'gamma',header=TRUE)
a<-table.element(a,fit$gamma)
a<-table.row.end(a)
a<-table.end(a)
table.save(a,file='mytable.tab')
a<-table.start()
a<-table.row.start(a)
a<-table.element(a,'Interpolation Forecasts of Exponential Smoothing',4,TRUE)
a<-table.row.end(a)
a<-table.row.start(a)
a<-table.element(a,'t',header=TRUE)
a<-table.element(a,'Observed',header=TRUE)
a<-table.element(a,'Fitted',header=TRUE)
a<-table.element(a,'Residuals',header=TRUE)
a<-table.row.end(a)
for (i in 1:nxmK) {
a<-table.row.start(a)
a<-table.element(a,i+K,header=TRUE)
a<-table.element(a,x[i+K])
a<-table.element(a,fit$fitted[i,'xhat'])
a<-table.element(a,myresid[i])
a<-table.row.end(a)
}
a<-table.end(a)
table.save(a,file='mytable1.tab')
a<-table.start()
a<-table.row.start(a)
a<-table.element(a,'Extrapolation Forecasts of Exponential Smoothing',4,TRUE)
a<-table.row.end(a)
a<-table.row.start(a)
a<-table.element(a,'t',header=TRUE)
a<-table.element(a,'Forecast',header=TRUE)
a<-table.element(a,'95% Lower Bound',header=TRUE)
a<-table.element(a,'95% Upper Bound',header=TRUE)
a<-table.row.end(a)
for (i in 1:np) {
a<-table.row.start(a)
a<-table.element(a,nx+i,header=TRUE)
a<-table.element(a,p[i,'fit'])
a<-table.element(a,p[i,'lwr'])
a<-table.element(a,p[i,'upr'])
a<-table.row.end(a)
}
a<-table.end(a)
table.save(a,file='mytable2.tab')