Free Statistics

of Irreproducible Research!

Author's title

Author*The author of this computation has been verified*
R Software Modulerwasp_autocorrelation.wasp
Title produced by software(Partial) Autocorrelation Function
Date of computationSun, 18 Dec 2016 12:55:35 +0100
Cite this page as followsStatistical Computations at FreeStatistics.org, Office for Research Development and Education, URL https://freestatistics.org/blog/index.php?v=date/2016/Dec/18/t148206216008kaxy1y4xd93tr.htm/, Retrieved Fri, 01 Nov 2024 03:45:00 +0000
Statistical Computations at FreeStatistics.org, Office for Research Development and Education, URL https://freestatistics.org/blog/index.php?pk=301020, Retrieved Fri, 01 Nov 2024 03:45:00 +0000
QR Codes:

Original text written by user:
IsPrivate?No (this computation is public)
User-defined keywords
Estimated Impact120
Family? (F = Feedback message, R = changed R code, M = changed R Module, P = changed Parameters, D = changed Data)
-     [Chi-Squared Test, McNemar Test, and Fisher Exact Test] [] [2015-11-15 16:35:00] [32b17a345b130fdf5cc88718ed94a974]
- RMPD    [(Partial) Autocorrelation Function] [(Partial) Autocor...] [2016-12-18 11:55:35] [2ea868439aa9f960cb5a0f1a9b97f873] [Current]
Feedback Forum

Post a new message
Dataseries X:
7085
7390
6920
6955
6965
6990
7080
7030
7090
7035
6960
7035
6845
6970
6885
6935
6480
6340
6200
5990
5920
5750
5675
5890
5655
5515
5585
5630
5720
5650
5645
5735
5680
5620
5525
5500
5545
5430
5290
5235
5085
4885
5120
5030
4860
4915
5030
5115
4880
4780
4765
4815
4980
5050
5280
5040
4980
5025
5175
5205
5155
4995
5035
5005
4975
4940
5015
4920
4950
4930
4905
5015
5010
5045
5000
5060
4950
4995
4975
4930
5000
4955
4900
4910
4940
4945
4975
4900
4950
4865
4870
4785
4715
4630
4515
4510
4485
4470
4385
4310
4370
4425
4460
4430
4360
4320
4370
4370
4305
4255
4310
4375
4365
4400
4385
4305


Summary of computational transaction
Raw Input view raw input (R code)
Raw Outputview raw output of R engine
Computing time1 seconds
R ServerBig Analytics Cloud Computing Center

\begin{tabular}{lllllllll}
\hline
Summary of computational transaction \tabularnewline
Raw Input view raw input (R code)  \tabularnewline
Raw Outputview raw output of R engine  \tabularnewline
Computing time1 seconds \tabularnewline
R ServerBig Analytics Cloud Computing Center \tabularnewline
\hline
\end{tabular}
%Source: https://freestatistics.org/blog/index.php?pk=301020&T=0

[TABLE]
[ROW]
Summary of computational transaction[/C][/ROW] [ROW]Raw Input[/C] view raw input (R code) [/C][/ROW] [ROW]Raw Output[/C]view raw output of R engine [/C][/ROW] [ROW]Computing time[/C]1 seconds[/C][/ROW] [ROW]R Server[/C]Big Analytics Cloud Computing Center[/C][/ROW] [/TABLE] Source: https://freestatistics.org/blog/index.php?pk=301020&T=0

Globally Unique Identifier (entire table): ba.freestatistics.org/blog/index.php?pk=301020&T=0

As an alternative you can also use a QR Code:  

The GUIDs for individual cells are displayed in the table below:

Summary of computational transaction
Raw Input view raw input (R code)
Raw Outputview raw output of R engine
Computing time1 seconds
R ServerBig Analytics Cloud Computing Center


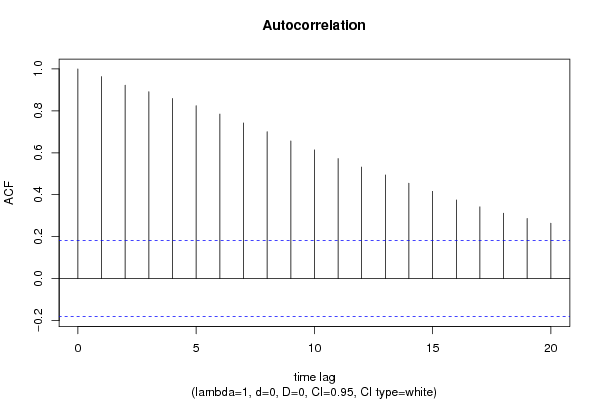
Autocorrelation Function
Time lag kACF(k)T-STATP-value
10.96344310.37660
20.9224729.93530
30.8914639.60140
40.8586829.24830
50.8242028.87690
60.7845648.450
70.7420857.99250
80.7000677.540
90.6559377.06470
100.6137126.60990
110.5722756.16360
120.531515.72450
130.4935995.31620
140.4550394.90092e-06
150.4158754.47919e-06
160.3747384.03614.9e-05
170.341933.68270.000176
180.3114063.35390.000538
190.2861173.08160.001286
200.2635162.83820.002679

\begin{tabular}{lllllllll}
\hline
Autocorrelation Function \tabularnewline
Time lag k & ACF(k) & T-STAT & P-value \tabularnewline
1 & 0.963443 & 10.3766 & 0 \tabularnewline
2 & 0.922472 & 9.9353 & 0 \tabularnewline
3 & 0.891463 & 9.6014 & 0 \tabularnewline
4 & 0.858682 & 9.2483 & 0 \tabularnewline
5 & 0.824202 & 8.8769 & 0 \tabularnewline
6 & 0.784564 & 8.45 & 0 \tabularnewline
7 & 0.742085 & 7.9925 & 0 \tabularnewline
8 & 0.700067 & 7.54 & 0 \tabularnewline
9 & 0.655937 & 7.0647 & 0 \tabularnewline
10 & 0.613712 & 6.6099 & 0 \tabularnewline
11 & 0.572275 & 6.1636 & 0 \tabularnewline
12 & 0.53151 & 5.7245 & 0 \tabularnewline
13 & 0.493599 & 5.3162 & 0 \tabularnewline
14 & 0.455039 & 4.9009 & 2e-06 \tabularnewline
15 & 0.415875 & 4.4791 & 9e-06 \tabularnewline
16 & 0.374738 & 4.0361 & 4.9e-05 \tabularnewline
17 & 0.34193 & 3.6827 & 0.000176 \tabularnewline
18 & 0.311406 & 3.3539 & 0.000538 \tabularnewline
19 & 0.286117 & 3.0816 & 0.001286 \tabularnewline
20 & 0.263516 & 2.8382 & 0.002679 \tabularnewline
\hline
\end{tabular}
%Source: https://freestatistics.org/blog/index.php?pk=301020&T=1

[TABLE]
[ROW][C]Autocorrelation Function[/C][/ROW]
[ROW][C]Time lag k[/C][C]ACF(k)[/C][C]T-STAT[/C][C]P-value[/C][/ROW]
[ROW][C]1[/C][C]0.963443[/C][C]10.3766[/C][C]0[/C][/ROW]
[ROW][C]2[/C][C]0.922472[/C][C]9.9353[/C][C]0[/C][/ROW]
[ROW][C]3[/C][C]0.891463[/C][C]9.6014[/C][C]0[/C][/ROW]
[ROW][C]4[/C][C]0.858682[/C][C]9.2483[/C][C]0[/C][/ROW]
[ROW][C]5[/C][C]0.824202[/C][C]8.8769[/C][C]0[/C][/ROW]
[ROW][C]6[/C][C]0.784564[/C][C]8.45[/C][C]0[/C][/ROW]
[ROW][C]7[/C][C]0.742085[/C][C]7.9925[/C][C]0[/C][/ROW]
[ROW][C]8[/C][C]0.700067[/C][C]7.54[/C][C]0[/C][/ROW]
[ROW][C]9[/C][C]0.655937[/C][C]7.0647[/C][C]0[/C][/ROW]
[ROW][C]10[/C][C]0.613712[/C][C]6.6099[/C][C]0[/C][/ROW]
[ROW][C]11[/C][C]0.572275[/C][C]6.1636[/C][C]0[/C][/ROW]
[ROW][C]12[/C][C]0.53151[/C][C]5.7245[/C][C]0[/C][/ROW]
[ROW][C]13[/C][C]0.493599[/C][C]5.3162[/C][C]0[/C][/ROW]
[ROW][C]14[/C][C]0.455039[/C][C]4.9009[/C][C]2e-06[/C][/ROW]
[ROW][C]15[/C][C]0.415875[/C][C]4.4791[/C][C]9e-06[/C][/ROW]
[ROW][C]16[/C][C]0.374738[/C][C]4.0361[/C][C]4.9e-05[/C][/ROW]
[ROW][C]17[/C][C]0.34193[/C][C]3.6827[/C][C]0.000176[/C][/ROW]
[ROW][C]18[/C][C]0.311406[/C][C]3.3539[/C][C]0.000538[/C][/ROW]
[ROW][C]19[/C][C]0.286117[/C][C]3.0816[/C][C]0.001286[/C][/ROW]
[ROW][C]20[/C][C]0.263516[/C][C]2.8382[/C][C]0.002679[/C][/ROW]
[/TABLE]
Source: https://freestatistics.org/blog/index.php?pk=301020&T=1

Globally Unique Identifier (entire table): ba.freestatistics.org/blog/index.php?pk=301020&T=1

As an alternative you can also use a QR Code:  

The GUIDs for individual cells are displayed in the table below:

Autocorrelation Function
Time lag kACF(k)T-STATP-value
10.96344310.37660
20.9224729.93530
30.8914639.60140
40.8586829.24830
50.8242028.87690
60.7845648.450
70.7420857.99250
80.7000677.540
90.6559377.06470
100.6137126.60990
110.5722756.16360
120.531515.72450
130.4935995.31620
140.4550394.90092e-06
150.4158754.47919e-06
160.3747384.03614.9e-05
170.341933.68270.000176
180.3114063.35390.000538
190.2861173.08160.001286
200.2635162.83820.002679


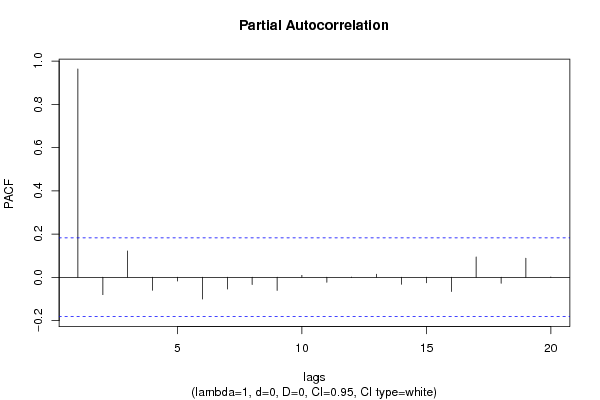
Partial Autocorrelation Function
Time lag kPACF(k)T-STATP-value
10.96344310.37660
2-0.080101-0.86270.195039
30.1219471.31340.095818
4-0.060247-0.64890.258851
5-0.017498-0.18850.425421
6-0.100286-1.08010.141165
7-0.053823-0.57970.281622
8-0.033602-0.36190.359043
9-0.060377-0.65030.258397
100.0089640.09650.461628
11-0.023014-0.24790.402336
12-0.000665-0.00720.497149
130.014280.15380.439019
14-0.031911-0.34370.36585
15-0.025265-0.27210.393009
16-0.065343-0.70380.241495
170.0935761.00780.157813
18-0.027841-0.29990.382413
190.0879240.9470.172811
200.0011630.01250.495014

\begin{tabular}{lllllllll}
\hline
Partial Autocorrelation Function \tabularnewline
Time lag k & PACF(k) & T-STAT & P-value \tabularnewline
1 & 0.963443 & 10.3766 & 0 \tabularnewline
2 & -0.080101 & -0.8627 & 0.195039 \tabularnewline
3 & 0.121947 & 1.3134 & 0.095818 \tabularnewline
4 & -0.060247 & -0.6489 & 0.258851 \tabularnewline
5 & -0.017498 & -0.1885 & 0.425421 \tabularnewline
6 & -0.100286 & -1.0801 & 0.141165 \tabularnewline
7 & -0.053823 & -0.5797 & 0.281622 \tabularnewline
8 & -0.033602 & -0.3619 & 0.359043 \tabularnewline
9 & -0.060377 & -0.6503 & 0.258397 \tabularnewline
10 & 0.008964 & 0.0965 & 0.461628 \tabularnewline
11 & -0.023014 & -0.2479 & 0.402336 \tabularnewline
12 & -0.000665 & -0.0072 & 0.497149 \tabularnewline
13 & 0.01428 & 0.1538 & 0.439019 \tabularnewline
14 & -0.031911 & -0.3437 & 0.36585 \tabularnewline
15 & -0.025265 & -0.2721 & 0.393009 \tabularnewline
16 & -0.065343 & -0.7038 & 0.241495 \tabularnewline
17 & 0.093576 & 1.0078 & 0.157813 \tabularnewline
18 & -0.027841 & -0.2999 & 0.382413 \tabularnewline
19 & 0.087924 & 0.947 & 0.172811 \tabularnewline
20 & 0.001163 & 0.0125 & 0.495014 \tabularnewline
\hline
\end{tabular}
%Source: https://freestatistics.org/blog/index.php?pk=301020&T=2

[TABLE]
[ROW][C]Partial Autocorrelation Function[/C][/ROW]
[ROW][C]Time lag k[/C][C]PACF(k)[/C][C]T-STAT[/C][C]P-value[/C][/ROW]
[ROW][C]1[/C][C]0.963443[/C][C]10.3766[/C][C]0[/C][/ROW]
[ROW][C]2[/C][C]-0.080101[/C][C]-0.8627[/C][C]0.195039[/C][/ROW]
[ROW][C]3[/C][C]0.121947[/C][C]1.3134[/C][C]0.095818[/C][/ROW]
[ROW][C]4[/C][C]-0.060247[/C][C]-0.6489[/C][C]0.258851[/C][/ROW]
[ROW][C]5[/C][C]-0.017498[/C][C]-0.1885[/C][C]0.425421[/C][/ROW]
[ROW][C]6[/C][C]-0.100286[/C][C]-1.0801[/C][C]0.141165[/C][/ROW]
[ROW][C]7[/C][C]-0.053823[/C][C]-0.5797[/C][C]0.281622[/C][/ROW]
[ROW][C]8[/C][C]-0.033602[/C][C]-0.3619[/C][C]0.359043[/C][/ROW]
[ROW][C]9[/C][C]-0.060377[/C][C]-0.6503[/C][C]0.258397[/C][/ROW]
[ROW][C]10[/C][C]0.008964[/C][C]0.0965[/C][C]0.461628[/C][/ROW]
[ROW][C]11[/C][C]-0.023014[/C][C]-0.2479[/C][C]0.402336[/C][/ROW]
[ROW][C]12[/C][C]-0.000665[/C][C]-0.0072[/C][C]0.497149[/C][/ROW]
[ROW][C]13[/C][C]0.01428[/C][C]0.1538[/C][C]0.439019[/C][/ROW]
[ROW][C]14[/C][C]-0.031911[/C][C]-0.3437[/C][C]0.36585[/C][/ROW]
[ROW][C]15[/C][C]-0.025265[/C][C]-0.2721[/C][C]0.393009[/C][/ROW]
[ROW][C]16[/C][C]-0.065343[/C][C]-0.7038[/C][C]0.241495[/C][/ROW]
[ROW][C]17[/C][C]0.093576[/C][C]1.0078[/C][C]0.157813[/C][/ROW]
[ROW][C]18[/C][C]-0.027841[/C][C]-0.2999[/C][C]0.382413[/C][/ROW]
[ROW][C]19[/C][C]0.087924[/C][C]0.947[/C][C]0.172811[/C][/ROW]
[ROW][C]20[/C][C]0.001163[/C][C]0.0125[/C][C]0.495014[/C][/ROW]
[/TABLE]
Source: https://freestatistics.org/blog/index.php?pk=301020&T=2

Globally Unique Identifier (entire table): ba.freestatistics.org/blog/index.php?pk=301020&T=2

As an alternative you can also use a QR Code:  

The GUIDs for individual cells are displayed in the table below:

Partial Autocorrelation Function
Time lag kPACF(k)T-STATP-value
10.96344310.37660
2-0.080101-0.86270.195039
30.1219471.31340.095818
4-0.060247-0.64890.258851
5-0.017498-0.18850.425421
6-0.100286-1.08010.141165
7-0.053823-0.57970.281622
8-0.033602-0.36190.359043
9-0.060377-0.65030.258397
100.0089640.09650.461628
11-0.023014-0.24790.402336
12-0.000665-0.00720.497149
130.014280.15380.439019
14-0.031911-0.34370.36585
15-0.025265-0.27210.393009
16-0.065343-0.70380.241495
170.0935761.00780.157813
18-0.027841-0.29990.382413
190.0879240.9470.172811
200.0011630.01250.495014


Parameters (Session):
Parameters (R input):
par1 = Default ; par2 = 1 ; par3 = 0 ; par4 = 0 ; par5 = 12 ; par6 = White Noise ; par7 = 0.95 ; par8 = ;
R code (references can be found in the software module):
par8 <- ''
par7 <- '0.95'
par6 <- 'White Noise'
par5 <- '12'
par4 <- '0'
par3 <- '1'
par2 <- '1'
par1 <- 'Default'
if (par1 == 'Default') {
par1 = 10*log10(length(x))
} else {
par1 <- as.numeric(par1)
}
par2 <- as.numeric(par2)
par3 <- as.numeric(par3)
par4 <- as.numeric(par4)
par5 <- as.numeric(par5)
if (par6 == 'White Noise') par6 <- 'white' else par6 <- 'ma'
par7 <- as.numeric(par7)
if (par8 != '') par8 <- as.numeric(par8)
x <- na.omit(x)
ox <- x
if (par8 == '') {
if (par2 == 0) {
x <- log(x)
} else {
x <- (x ^ par2 - 1) / par2
}
} else {
x <- log(x,base=par8)
}
if (par3 > 0) x <- diff(x,lag=1,difference=par3)
if (par4 > 0) x <- diff(x,lag=par5,difference=par4)
bitmap(file='picts.png')
op <- par(mfrow=c(2,1))
plot(ox,type='l',main='Original Time Series',xlab='time',ylab='value')
if (par8=='') {
mytitle <- paste('Working Time Series (lambda=',par2,', d=',par3,', D=',par4,')',sep='')
mysub <- paste('(lambda=',par2,', d=',par3,', D=',par4,', CI=', par7, ', CI type=',par6,')',sep='')
} else {
mytitle <- paste('Working Time Series (base=',par8,', d=',par3,', D=',par4,')',sep='')
mysub <- paste('(base=',par8,', d=',par3,', D=',par4,', CI=', par7, ', CI type=',par6,')',sep='')
}
plot(x,type='l', main=mytitle,xlab='time',ylab='value')
par(op)
dev.off()
bitmap(file='pic1.png')
racf <- acf(x, par1, main='Autocorrelation', xlab='time lag', ylab='ACF', ci.type=par6, ci=par7, sub=mysub)
dev.off()
bitmap(file='pic2.png')
rpacf <- pacf(x,par1,main='Partial Autocorrelation',xlab='lags',ylab='PACF',sub=mysub)
dev.off()
(myacf <- c(racf$acf))
(mypacf <- c(rpacf$acf))
lengthx <- length(x)
sqrtn <- sqrt(lengthx)
load(file='createtable')
a<-table.start()
a<-table.row.start(a)
a<-table.element(a,'Autocorrelation Function',4,TRUE)
a<-table.row.end(a)
a<-table.row.start(a)
a<-table.element(a,'Time lag k',header=TRUE)
a<-table.element(a,'ACF(k)',header=TRUE)
a<-table.element(a,'T-STAT',header=TRUE)
a<-table.element(a,'P-value',header=TRUE)
a<-table.row.end(a)
for (i in 2:(par1+1)) {
a<-table.row.start(a)
a<-table.element(a,i-1,header=TRUE)
a<-table.element(a,round(myacf[i],6))
mytstat <- myacf[i]*sqrtn
a<-table.element(a,round(mytstat,4))
a<-table.element(a,round(1-pt(abs(mytstat),lengthx),6))
a<-table.row.end(a)
}
a<-table.end(a)
table.save(a,file='mytable.tab')
a<-table.start()
a<-table.row.start(a)
a<-table.element(a,'Partial Autocorrelation Function',4,TRUE)
a<-table.row.end(a)
a<-table.row.start(a)
a<-table.element(a,'Time lag k',header=TRUE)
a<-table.element(a,'PACF(k)',header=TRUE)
a<-table.element(a,'T-STAT',header=TRUE)
a<-table.element(a,'P-value',header=TRUE)
a<-table.row.end(a)
for (i in 1:par1) {
a<-table.row.start(a)
a<-table.element(a,i,header=TRUE)
a<-table.element(a,round(mypacf[i],6))
mytstat <- mypacf[i]*sqrtn
a<-table.element(a,round(mytstat,4))
a<-table.element(a,round(1-pt(abs(mytstat),lengthx),6))
a<-table.row.end(a)
}
a<-table.end(a)
table.save(a,file='mytable1.tab')