Free Statistics

of Irreproducible Research!

Author's title

Author*The author of this computation has been verified*
R Software Modulerwasp_autocorrelation.wasp
Title produced by software(Partial) Autocorrelation Function
Date of computationSun, 18 Dec 2016 11:23:22 +0100
Cite this page as followsStatistical Computations at FreeStatistics.org, Office for Research Development and Education, URL https://freestatistics.org/blog/index.php?v=date/2016/Dec/18/t1482057095omecq5lc7v01q87.htm/, Retrieved Fri, 01 Nov 2024 03:48:17 +0000
Statistical Computations at FreeStatistics.org, Office for Research Development and Education, URL https://freestatistics.org/blog/index.php?pk=300996, Retrieved Fri, 01 Nov 2024 03:48:17 +0000
QR Codes:

Original text written by user:
IsPrivate?No (this computation is public)
User-defined keywords
Estimated Impact142
Family? (F = Feedback message, R = changed R code, M = changed R Module, P = changed Parameters, D = changed Data)
-       [(Partial) Autocorrelation Function] [autocorr] [2016-12-18 10:23:22] [ada7696de20b35d9f514c719a1db97fd] [Current]
Feedback Forum

Post a new message
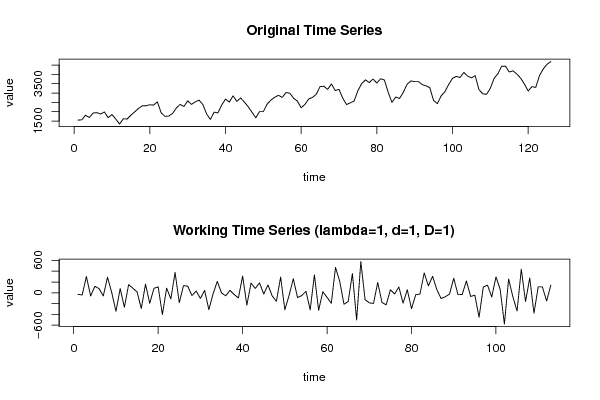
Dataseries X:
1550
1564
1812
1686
1928
1950
1876
1986
1680
1852
1604
1338
1622
1608
1816
1992
2174
2316
2320
2372
2354
2530
1938
1750
1766
1904
2198
2390
2280
2582
2392
2528
2620
2392
1886
1586
1980
1934
2362
2676
2514
2850
2556
2736
2516
2268
1974
1672
2010
2010
2406
2624
2772
2880
2766
3026
2990
2720
2572
2212
2392
2684
2766
2934
3344
3364
3198
3486
3134
3196
2722
2382
2476
2574
3126
3506
3704
3562
3752
3536
3764
3700
3040
2502
2788
2708
3036
3472
3648
3614
3612
3452
3386
3286
2602
2432
2848
3074
3460
3790
3892
3834
4102
3908
3810
3930
3178
2964
2926
3258
3786
4038
4436
4440
4128
4190
4020
3802
3488
3110
3346
3300
3936
4296
4542
4688


Summary of computational transaction
Raw Input view raw input (R code)
Raw Outputview raw output of R engine
Computing time1 seconds
R ServerBig Analytics Cloud Computing Center

\begin{tabular}{lllllllll}
\hline
Summary of computational transaction \tabularnewline
Raw Input view raw input (R code)  \tabularnewline
Raw Outputview raw output of R engine  \tabularnewline
Computing time1 seconds \tabularnewline
R ServerBig Analytics Cloud Computing Center \tabularnewline
\hline
\end{tabular}
%Source: https://freestatistics.org/blog/index.php?pk=300996&T=0

[TABLE]
[ROW]
Summary of computational transaction[/C][/ROW] [ROW]Raw Input[/C] view raw input (R code) [/C][/ROW] [ROW]Raw Output[/C]view raw output of R engine [/C][/ROW] [ROW]Computing time[/C]1 seconds[/C][/ROW] [ROW]R Server[/C]Big Analytics Cloud Computing Center[/C][/ROW] [/TABLE] Source: https://freestatistics.org/blog/index.php?pk=300996&T=0

Globally Unique Identifier (entire table): ba.freestatistics.org/blog/index.php?pk=300996&T=0

As an alternative you can also use a QR Code:  

The GUIDs for individual cells are displayed in the table below:

Summary of computational transaction
Raw Input view raw input (R code)
Raw Outputview raw output of R engine
Computing time1 seconds
R ServerBig Analytics Cloud Computing Center


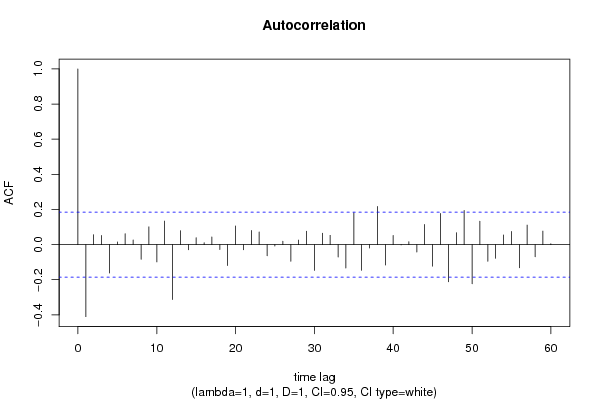
Autocorrelation Function
Time lag kACF(k)T-STATP-value
1-0.410107-4.35951.4e-05
20.0565090.60070.274622
30.0522920.55590.289699
4-0.161499-1.71680.044382
50.0144520.15360.439091
60.0618370.65730.256152
70.026470.28140.389466
8-0.083157-0.8840.189295
90.1009191.07280.142827
10-0.098499-1.04710.148652
110.1338661.4230.078743
12-0.312563-3.32260.000601
130.0793460.84350.200376
14-0.028929-0.30750.379508
150.0389050.41360.33999
160.0103910.11050.456122
170.0438620.46630.320963
18-0.028272-0.30050.38216
19-0.118906-1.2640.104417
200.1060621.12750.13097
21-0.029315-0.31160.377949
220.0808660.85960.19591
230.0714780.75980.224471
24-0.063165-0.67140.251652
25-0.008279-0.0880.465013
260.0195980.20830.417674
27-0.095225-1.01230.156788
280.0256770.27290.392695
290.0758050.80580.211019
30-0.146503-1.55730.061093
310.0645790.68650.246906
320.0528540.56180.287668
33-0.070286-0.74710.228263
34-0.133205-1.4160.079765
350.1812631.92690.028254
36-0.145608-1.54780.062229
37-0.019041-0.20240.419982
380.2173632.31060.011335
39-0.11572-1.23010.110602
400.0520440.55320.290598
41-0.001464-0.01560.493807
420.0164530.17490.430736
43-0.04239-0.45060.326566
440.1149261.22170.112186
45-0.12259-1.30310.097587
460.1769591.88110.031266
47-0.211905-2.25260.013108
480.0677840.72060.236336
490.1946332.0690.020415
50-0.222459-2.36480.009873
510.1327071.41070.080541
52-0.094713-1.00680.158089
53-0.077815-0.82720.204938
540.0548310.58290.280574
550.0743690.79060.21543
56-0.131769-1.40070.082018
570.1111651.18170.119903
58-0.069322-0.73690.231354
590.0766720.8150.208383
600.0047110.05010.480073

\begin{tabular}{lllllllll}
\hline
Autocorrelation Function \tabularnewline
Time lag k & ACF(k) & T-STAT & P-value \tabularnewline
1 & -0.410107 & -4.3595 & 1.4e-05 \tabularnewline
2 & 0.056509 & 0.6007 & 0.274622 \tabularnewline
3 & 0.052292 & 0.5559 & 0.289699 \tabularnewline
4 & -0.161499 & -1.7168 & 0.044382 \tabularnewline
5 & 0.014452 & 0.1536 & 0.439091 \tabularnewline
6 & 0.061837 & 0.6573 & 0.256152 \tabularnewline
7 & 0.02647 & 0.2814 & 0.389466 \tabularnewline
8 & -0.083157 & -0.884 & 0.189295 \tabularnewline
9 & 0.100919 & 1.0728 & 0.142827 \tabularnewline
10 & -0.098499 & -1.0471 & 0.148652 \tabularnewline
11 & 0.133866 & 1.423 & 0.078743 \tabularnewline
12 & -0.312563 & -3.3226 & 0.000601 \tabularnewline
13 & 0.079346 & 0.8435 & 0.200376 \tabularnewline
14 & -0.028929 & -0.3075 & 0.379508 \tabularnewline
15 & 0.038905 & 0.4136 & 0.33999 \tabularnewline
16 & 0.010391 & 0.1105 & 0.456122 \tabularnewline
17 & 0.043862 & 0.4663 & 0.320963 \tabularnewline
18 & -0.028272 & -0.3005 & 0.38216 \tabularnewline
19 & -0.118906 & -1.264 & 0.104417 \tabularnewline
20 & 0.106062 & 1.1275 & 0.13097 \tabularnewline
21 & -0.029315 & -0.3116 & 0.377949 \tabularnewline
22 & 0.080866 & 0.8596 & 0.19591 \tabularnewline
23 & 0.071478 & 0.7598 & 0.224471 \tabularnewline
24 & -0.063165 & -0.6714 & 0.251652 \tabularnewline
25 & -0.008279 & -0.088 & 0.465013 \tabularnewline
26 & 0.019598 & 0.2083 & 0.417674 \tabularnewline
27 & -0.095225 & -1.0123 & 0.156788 \tabularnewline
28 & 0.025677 & 0.2729 & 0.392695 \tabularnewline
29 & 0.075805 & 0.8058 & 0.211019 \tabularnewline
30 & -0.146503 & -1.5573 & 0.061093 \tabularnewline
31 & 0.064579 & 0.6865 & 0.246906 \tabularnewline
32 & 0.052854 & 0.5618 & 0.287668 \tabularnewline
33 & -0.070286 & -0.7471 & 0.228263 \tabularnewline
34 & -0.133205 & -1.416 & 0.079765 \tabularnewline
35 & 0.181263 & 1.9269 & 0.028254 \tabularnewline
36 & -0.145608 & -1.5478 & 0.062229 \tabularnewline
37 & -0.019041 & -0.2024 & 0.419982 \tabularnewline
38 & 0.217363 & 2.3106 & 0.011335 \tabularnewline
39 & -0.11572 & -1.2301 & 0.110602 \tabularnewline
40 & 0.052044 & 0.5532 & 0.290598 \tabularnewline
41 & -0.001464 & -0.0156 & 0.493807 \tabularnewline
42 & 0.016453 & 0.1749 & 0.430736 \tabularnewline
43 & -0.04239 & -0.4506 & 0.326566 \tabularnewline
44 & 0.114926 & 1.2217 & 0.112186 \tabularnewline
45 & -0.12259 & -1.3031 & 0.097587 \tabularnewline
46 & 0.176959 & 1.8811 & 0.031266 \tabularnewline
47 & -0.211905 & -2.2526 & 0.013108 \tabularnewline
48 & 0.067784 & 0.7206 & 0.236336 \tabularnewline
49 & 0.194633 & 2.069 & 0.020415 \tabularnewline
50 & -0.222459 & -2.3648 & 0.009873 \tabularnewline
51 & 0.132707 & 1.4107 & 0.080541 \tabularnewline
52 & -0.094713 & -1.0068 & 0.158089 \tabularnewline
53 & -0.077815 & -0.8272 & 0.204938 \tabularnewline
54 & 0.054831 & 0.5829 & 0.280574 \tabularnewline
55 & 0.074369 & 0.7906 & 0.21543 \tabularnewline
56 & -0.131769 & -1.4007 & 0.082018 \tabularnewline
57 & 0.111165 & 1.1817 & 0.119903 \tabularnewline
58 & -0.069322 & -0.7369 & 0.231354 \tabularnewline
59 & 0.076672 & 0.815 & 0.208383 \tabularnewline
60 & 0.004711 & 0.0501 & 0.480073 \tabularnewline
\hline
\end{tabular}
%Source: https://freestatistics.org/blog/index.php?pk=300996&T=1

[TABLE]
[ROW][C]Autocorrelation Function[/C][/ROW]
[ROW][C]Time lag k[/C][C]ACF(k)[/C][C]T-STAT[/C][C]P-value[/C][/ROW]
[ROW][C]1[/C][C]-0.410107[/C][C]-4.3595[/C][C]1.4e-05[/C][/ROW]
[ROW][C]2[/C][C]0.056509[/C][C]0.6007[/C][C]0.274622[/C][/ROW]
[ROW][C]3[/C][C]0.052292[/C][C]0.5559[/C][C]0.289699[/C][/ROW]
[ROW][C]4[/C][C]-0.161499[/C][C]-1.7168[/C][C]0.044382[/C][/ROW]
[ROW][C]5[/C][C]0.014452[/C][C]0.1536[/C][C]0.439091[/C][/ROW]
[ROW][C]6[/C][C]0.061837[/C][C]0.6573[/C][C]0.256152[/C][/ROW]
[ROW][C]7[/C][C]0.02647[/C][C]0.2814[/C][C]0.389466[/C][/ROW]
[ROW][C]8[/C][C]-0.083157[/C][C]-0.884[/C][C]0.189295[/C][/ROW]
[ROW][C]9[/C][C]0.100919[/C][C]1.0728[/C][C]0.142827[/C][/ROW]
[ROW][C]10[/C][C]-0.098499[/C][C]-1.0471[/C][C]0.148652[/C][/ROW]
[ROW][C]11[/C][C]0.133866[/C][C]1.423[/C][C]0.078743[/C][/ROW]
[ROW][C]12[/C][C]-0.312563[/C][C]-3.3226[/C][C]0.000601[/C][/ROW]
[ROW][C]13[/C][C]0.079346[/C][C]0.8435[/C][C]0.200376[/C][/ROW]
[ROW][C]14[/C][C]-0.028929[/C][C]-0.3075[/C][C]0.379508[/C][/ROW]
[ROW][C]15[/C][C]0.038905[/C][C]0.4136[/C][C]0.33999[/C][/ROW]
[ROW][C]16[/C][C]0.010391[/C][C]0.1105[/C][C]0.456122[/C][/ROW]
[ROW][C]17[/C][C]0.043862[/C][C]0.4663[/C][C]0.320963[/C][/ROW]
[ROW][C]18[/C][C]-0.028272[/C][C]-0.3005[/C][C]0.38216[/C][/ROW]
[ROW][C]19[/C][C]-0.118906[/C][C]-1.264[/C][C]0.104417[/C][/ROW]
[ROW][C]20[/C][C]0.106062[/C][C]1.1275[/C][C]0.13097[/C][/ROW]
[ROW][C]21[/C][C]-0.029315[/C][C]-0.3116[/C][C]0.377949[/C][/ROW]
[ROW][C]22[/C][C]0.080866[/C][C]0.8596[/C][C]0.19591[/C][/ROW]
[ROW][C]23[/C][C]0.071478[/C][C]0.7598[/C][C]0.224471[/C][/ROW]
[ROW][C]24[/C][C]-0.063165[/C][C]-0.6714[/C][C]0.251652[/C][/ROW]
[ROW][C]25[/C][C]-0.008279[/C][C]-0.088[/C][C]0.465013[/C][/ROW]
[ROW][C]26[/C][C]0.019598[/C][C]0.2083[/C][C]0.417674[/C][/ROW]
[ROW][C]27[/C][C]-0.095225[/C][C]-1.0123[/C][C]0.156788[/C][/ROW]
[ROW][C]28[/C][C]0.025677[/C][C]0.2729[/C][C]0.392695[/C][/ROW]
[ROW][C]29[/C][C]0.075805[/C][C]0.8058[/C][C]0.211019[/C][/ROW]
[ROW][C]30[/C][C]-0.146503[/C][C]-1.5573[/C][C]0.061093[/C][/ROW]
[ROW][C]31[/C][C]0.064579[/C][C]0.6865[/C][C]0.246906[/C][/ROW]
[ROW][C]32[/C][C]0.052854[/C][C]0.5618[/C][C]0.287668[/C][/ROW]
[ROW][C]33[/C][C]-0.070286[/C][C]-0.7471[/C][C]0.228263[/C][/ROW]
[ROW][C]34[/C][C]-0.133205[/C][C]-1.416[/C][C]0.079765[/C][/ROW]
[ROW][C]35[/C][C]0.181263[/C][C]1.9269[/C][C]0.028254[/C][/ROW]
[ROW][C]36[/C][C]-0.145608[/C][C]-1.5478[/C][C]0.062229[/C][/ROW]
[ROW][C]37[/C][C]-0.019041[/C][C]-0.2024[/C][C]0.419982[/C][/ROW]
[ROW][C]38[/C][C]0.217363[/C][C]2.3106[/C][C]0.011335[/C][/ROW]
[ROW][C]39[/C][C]-0.11572[/C][C]-1.2301[/C][C]0.110602[/C][/ROW]
[ROW][C]40[/C][C]0.052044[/C][C]0.5532[/C][C]0.290598[/C][/ROW]
[ROW][C]41[/C][C]-0.001464[/C][C]-0.0156[/C][C]0.493807[/C][/ROW]
[ROW][C]42[/C][C]0.016453[/C][C]0.1749[/C][C]0.430736[/C][/ROW]
[ROW][C]43[/C][C]-0.04239[/C][C]-0.4506[/C][C]0.326566[/C][/ROW]
[ROW][C]44[/C][C]0.114926[/C][C]1.2217[/C][C]0.112186[/C][/ROW]
[ROW][C]45[/C][C]-0.12259[/C][C]-1.3031[/C][C]0.097587[/C][/ROW]
[ROW][C]46[/C][C]0.176959[/C][C]1.8811[/C][C]0.031266[/C][/ROW]
[ROW][C]47[/C][C]-0.211905[/C][C]-2.2526[/C][C]0.013108[/C][/ROW]
[ROW][C]48[/C][C]0.067784[/C][C]0.7206[/C][C]0.236336[/C][/ROW]
[ROW][C]49[/C][C]0.194633[/C][C]2.069[/C][C]0.020415[/C][/ROW]
[ROW][C]50[/C][C]-0.222459[/C][C]-2.3648[/C][C]0.009873[/C][/ROW]
[ROW][C]51[/C][C]0.132707[/C][C]1.4107[/C][C]0.080541[/C][/ROW]
[ROW][C]52[/C][C]-0.094713[/C][C]-1.0068[/C][C]0.158089[/C][/ROW]
[ROW][C]53[/C][C]-0.077815[/C][C]-0.8272[/C][C]0.204938[/C][/ROW]
[ROW][C]54[/C][C]0.054831[/C][C]0.5829[/C][C]0.280574[/C][/ROW]
[ROW][C]55[/C][C]0.074369[/C][C]0.7906[/C][C]0.21543[/C][/ROW]
[ROW][C]56[/C][C]-0.131769[/C][C]-1.4007[/C][C]0.082018[/C][/ROW]
[ROW][C]57[/C][C]0.111165[/C][C]1.1817[/C][C]0.119903[/C][/ROW]
[ROW][C]58[/C][C]-0.069322[/C][C]-0.7369[/C][C]0.231354[/C][/ROW]
[ROW][C]59[/C][C]0.076672[/C][C]0.815[/C][C]0.208383[/C][/ROW]
[ROW][C]60[/C][C]0.004711[/C][C]0.0501[/C][C]0.480073[/C][/ROW]
[/TABLE]
Source: https://freestatistics.org/blog/index.php?pk=300996&T=1

Globally Unique Identifier (entire table): ba.freestatistics.org/blog/index.php?pk=300996&T=1

As an alternative you can also use a QR Code:  

The GUIDs for individual cells are displayed in the table below:

Autocorrelation Function
Time lag kACF(k)T-STATP-value
1-0.410107-4.35951.4e-05
20.0565090.60070.274622
30.0522920.55590.289699
4-0.161499-1.71680.044382
50.0144520.15360.439091
60.0618370.65730.256152
70.026470.28140.389466
8-0.083157-0.8840.189295
90.1009191.07280.142827
10-0.098499-1.04710.148652
110.1338661.4230.078743
12-0.312563-3.32260.000601
130.0793460.84350.200376
14-0.028929-0.30750.379508
150.0389050.41360.33999
160.0103910.11050.456122
170.0438620.46630.320963
18-0.028272-0.30050.38216
19-0.118906-1.2640.104417
200.1060621.12750.13097
21-0.029315-0.31160.377949
220.0808660.85960.19591
230.0714780.75980.224471
24-0.063165-0.67140.251652
25-0.008279-0.0880.465013
260.0195980.20830.417674
27-0.095225-1.01230.156788
280.0256770.27290.392695
290.0758050.80580.211019
30-0.146503-1.55730.061093
310.0645790.68650.246906
320.0528540.56180.287668
33-0.070286-0.74710.228263
34-0.133205-1.4160.079765
350.1812631.92690.028254
36-0.145608-1.54780.062229
37-0.019041-0.20240.419982
380.2173632.31060.011335
39-0.11572-1.23010.110602
400.0520440.55320.290598
41-0.001464-0.01560.493807
420.0164530.17490.430736
43-0.04239-0.45060.326566
440.1149261.22170.112186
45-0.12259-1.30310.097587
460.1769591.88110.031266
47-0.211905-2.25260.013108
480.0677840.72060.236336
490.1946332.0690.020415
50-0.222459-2.36480.009873
510.1327071.41070.080541
52-0.094713-1.00680.158089
53-0.077815-0.82720.204938
540.0548310.58290.280574
550.0743690.79060.21543
56-0.131769-1.40070.082018
570.1111651.18170.119903
58-0.069322-0.73690.231354
590.0766720.8150.208383
600.0047110.05010.480073


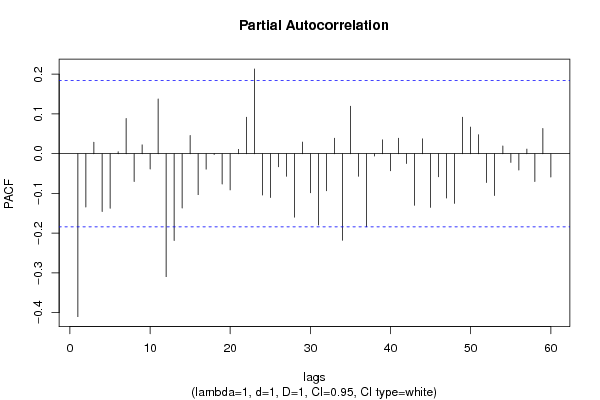
Partial Autocorrelation Function
Time lag kPACF(k)T-STATP-value
1-0.410107-4.35951.4e-05
2-0.13426-1.42720.078139
30.0287910.30610.380065
4-0.145489-1.54660.062382
5-0.137235-1.45880.073693
60.0051090.05430.478391
70.0884680.94040.174501
8-0.070193-0.74620.22856
90.0221670.23560.407072
10-0.038607-0.41040.341145
110.1377661.46450.072921
12-0.309465-3.28970.000669
13-0.218502-2.32270.010993
14-0.136723-1.45340.074444
150.045740.48620.313874
16-0.102976-1.09460.138
17-0.038884-0.41330.340071
18-0.002245-0.02390.490501
19-0.076157-0.80960.209948
20-0.091084-0.96820.167498
210.0109390.11630.453819
220.0919190.97710.165301
230.213262.2670.012647
24-0.104132-1.10690.135335
25-0.110223-1.17170.121894
26-0.032701-0.34760.364389
27-0.056671-0.60240.27405
28-0.159638-1.6970.046227
290.0291940.31030.378436
30-0.098463-1.04670.148741
31-0.179288-1.90590.029604
32-0.093373-0.99260.161521
330.0389270.41380.339901
34-0.217979-2.31710.011149
350.1195671.2710.103167
36-0.05703-0.60620.272787
37-0.184082-1.95680.026418
38-0.005653-0.06010.476092
390.0347770.36970.356153
40-0.042784-0.45480.325064
410.0388390.41290.340243
42-0.024718-0.26280.396608
43-0.129844-1.38030.085115
440.0373540.39710.346028
45-0.135201-1.43720.076711
46-0.057874-0.61520.269825
47-0.111678-1.18710.118829
48-0.125141-1.33030.093054
490.0916490.97420.166009
500.0669720.71190.238989
510.0476240.50620.306835
52-0.072689-0.77270.220658
53-0.105087-1.11710.133163
540.0193180.20540.418831
55-0.02186-0.23240.408332
56-0.041148-0.43740.331324
570.0115840.12310.451108
58-0.069802-0.7420.229813
590.063490.67490.250555
60-0.058862-0.62570.266384

\begin{tabular}{lllllllll}
\hline
Partial Autocorrelation Function \tabularnewline
Time lag k & PACF(k) & T-STAT & P-value \tabularnewline
1 & -0.410107 & -4.3595 & 1.4e-05 \tabularnewline
2 & -0.13426 & -1.4272 & 0.078139 \tabularnewline
3 & 0.028791 & 0.3061 & 0.380065 \tabularnewline
4 & -0.145489 & -1.5466 & 0.062382 \tabularnewline
5 & -0.137235 & -1.4588 & 0.073693 \tabularnewline
6 & 0.005109 & 0.0543 & 0.478391 \tabularnewline
7 & 0.088468 & 0.9404 & 0.174501 \tabularnewline
8 & -0.070193 & -0.7462 & 0.22856 \tabularnewline
9 & 0.022167 & 0.2356 & 0.407072 \tabularnewline
10 & -0.038607 & -0.4104 & 0.341145 \tabularnewline
11 & 0.137766 & 1.4645 & 0.072921 \tabularnewline
12 & -0.309465 & -3.2897 & 0.000669 \tabularnewline
13 & -0.218502 & -2.3227 & 0.010993 \tabularnewline
14 & -0.136723 & -1.4534 & 0.074444 \tabularnewline
15 & 0.04574 & 0.4862 & 0.313874 \tabularnewline
16 & -0.102976 & -1.0946 & 0.138 \tabularnewline
17 & -0.038884 & -0.4133 & 0.340071 \tabularnewline
18 & -0.002245 & -0.0239 & 0.490501 \tabularnewline
19 & -0.076157 & -0.8096 & 0.209948 \tabularnewline
20 & -0.091084 & -0.9682 & 0.167498 \tabularnewline
21 & 0.010939 & 0.1163 & 0.453819 \tabularnewline
22 & 0.091919 & 0.9771 & 0.165301 \tabularnewline
23 & 0.21326 & 2.267 & 0.012647 \tabularnewline
24 & -0.104132 & -1.1069 & 0.135335 \tabularnewline
25 & -0.110223 & -1.1717 & 0.121894 \tabularnewline
26 & -0.032701 & -0.3476 & 0.364389 \tabularnewline
27 & -0.056671 & -0.6024 & 0.27405 \tabularnewline
28 & -0.159638 & -1.697 & 0.046227 \tabularnewline
29 & 0.029194 & 0.3103 & 0.378436 \tabularnewline
30 & -0.098463 & -1.0467 & 0.148741 \tabularnewline
31 & -0.179288 & -1.9059 & 0.029604 \tabularnewline
32 & -0.093373 & -0.9926 & 0.161521 \tabularnewline
33 & 0.038927 & 0.4138 & 0.339901 \tabularnewline
34 & -0.217979 & -2.3171 & 0.011149 \tabularnewline
35 & 0.119567 & 1.271 & 0.103167 \tabularnewline
36 & -0.05703 & -0.6062 & 0.272787 \tabularnewline
37 & -0.184082 & -1.9568 & 0.026418 \tabularnewline
38 & -0.005653 & -0.0601 & 0.476092 \tabularnewline
39 & 0.034777 & 0.3697 & 0.356153 \tabularnewline
40 & -0.042784 & -0.4548 & 0.325064 \tabularnewline
41 & 0.038839 & 0.4129 & 0.340243 \tabularnewline
42 & -0.024718 & -0.2628 & 0.396608 \tabularnewline
43 & -0.129844 & -1.3803 & 0.085115 \tabularnewline
44 & 0.037354 & 0.3971 & 0.346028 \tabularnewline
45 & -0.135201 & -1.4372 & 0.076711 \tabularnewline
46 & -0.057874 & -0.6152 & 0.269825 \tabularnewline
47 & -0.111678 & -1.1871 & 0.118829 \tabularnewline
48 & -0.125141 & -1.3303 & 0.093054 \tabularnewline
49 & 0.091649 & 0.9742 & 0.166009 \tabularnewline
50 & 0.066972 & 0.7119 & 0.238989 \tabularnewline
51 & 0.047624 & 0.5062 & 0.306835 \tabularnewline
52 & -0.072689 & -0.7727 & 0.220658 \tabularnewline
53 & -0.105087 & -1.1171 & 0.133163 \tabularnewline
54 & 0.019318 & 0.2054 & 0.418831 \tabularnewline
55 & -0.02186 & -0.2324 & 0.408332 \tabularnewline
56 & -0.041148 & -0.4374 & 0.331324 \tabularnewline
57 & 0.011584 & 0.1231 & 0.451108 \tabularnewline
58 & -0.069802 & -0.742 & 0.229813 \tabularnewline
59 & 0.06349 & 0.6749 & 0.250555 \tabularnewline
60 & -0.058862 & -0.6257 & 0.266384 \tabularnewline
\hline
\end{tabular}
%Source: https://freestatistics.org/blog/index.php?pk=300996&T=2

[TABLE]
[ROW][C]Partial Autocorrelation Function[/C][/ROW]
[ROW][C]Time lag k[/C][C]PACF(k)[/C][C]T-STAT[/C][C]P-value[/C][/ROW]
[ROW][C]1[/C][C]-0.410107[/C][C]-4.3595[/C][C]1.4e-05[/C][/ROW]
[ROW][C]2[/C][C]-0.13426[/C][C]-1.4272[/C][C]0.078139[/C][/ROW]
[ROW][C]3[/C][C]0.028791[/C][C]0.3061[/C][C]0.380065[/C][/ROW]
[ROW][C]4[/C][C]-0.145489[/C][C]-1.5466[/C][C]0.062382[/C][/ROW]
[ROW][C]5[/C][C]-0.137235[/C][C]-1.4588[/C][C]0.073693[/C][/ROW]
[ROW][C]6[/C][C]0.005109[/C][C]0.0543[/C][C]0.478391[/C][/ROW]
[ROW][C]7[/C][C]0.088468[/C][C]0.9404[/C][C]0.174501[/C][/ROW]
[ROW][C]8[/C][C]-0.070193[/C][C]-0.7462[/C][C]0.22856[/C][/ROW]
[ROW][C]9[/C][C]0.022167[/C][C]0.2356[/C][C]0.407072[/C][/ROW]
[ROW][C]10[/C][C]-0.038607[/C][C]-0.4104[/C][C]0.341145[/C][/ROW]
[ROW][C]11[/C][C]0.137766[/C][C]1.4645[/C][C]0.072921[/C][/ROW]
[ROW][C]12[/C][C]-0.309465[/C][C]-3.2897[/C][C]0.000669[/C][/ROW]
[ROW][C]13[/C][C]-0.218502[/C][C]-2.3227[/C][C]0.010993[/C][/ROW]
[ROW][C]14[/C][C]-0.136723[/C][C]-1.4534[/C][C]0.074444[/C][/ROW]
[ROW][C]15[/C][C]0.04574[/C][C]0.4862[/C][C]0.313874[/C][/ROW]
[ROW][C]16[/C][C]-0.102976[/C][C]-1.0946[/C][C]0.138[/C][/ROW]
[ROW][C]17[/C][C]-0.038884[/C][C]-0.4133[/C][C]0.340071[/C][/ROW]
[ROW][C]18[/C][C]-0.002245[/C][C]-0.0239[/C][C]0.490501[/C][/ROW]
[ROW][C]19[/C][C]-0.076157[/C][C]-0.8096[/C][C]0.209948[/C][/ROW]
[ROW][C]20[/C][C]-0.091084[/C][C]-0.9682[/C][C]0.167498[/C][/ROW]
[ROW][C]21[/C][C]0.010939[/C][C]0.1163[/C][C]0.453819[/C][/ROW]
[ROW][C]22[/C][C]0.091919[/C][C]0.9771[/C][C]0.165301[/C][/ROW]
[ROW][C]23[/C][C]0.21326[/C][C]2.267[/C][C]0.012647[/C][/ROW]
[ROW][C]24[/C][C]-0.104132[/C][C]-1.1069[/C][C]0.135335[/C][/ROW]
[ROW][C]25[/C][C]-0.110223[/C][C]-1.1717[/C][C]0.121894[/C][/ROW]
[ROW][C]26[/C][C]-0.032701[/C][C]-0.3476[/C][C]0.364389[/C][/ROW]
[ROW][C]27[/C][C]-0.056671[/C][C]-0.6024[/C][C]0.27405[/C][/ROW]
[ROW][C]28[/C][C]-0.159638[/C][C]-1.697[/C][C]0.046227[/C][/ROW]
[ROW][C]29[/C][C]0.029194[/C][C]0.3103[/C][C]0.378436[/C][/ROW]
[ROW][C]30[/C][C]-0.098463[/C][C]-1.0467[/C][C]0.148741[/C][/ROW]
[ROW][C]31[/C][C]-0.179288[/C][C]-1.9059[/C][C]0.029604[/C][/ROW]
[ROW][C]32[/C][C]-0.093373[/C][C]-0.9926[/C][C]0.161521[/C][/ROW]
[ROW][C]33[/C][C]0.038927[/C][C]0.4138[/C][C]0.339901[/C][/ROW]
[ROW][C]34[/C][C]-0.217979[/C][C]-2.3171[/C][C]0.011149[/C][/ROW]
[ROW][C]35[/C][C]0.119567[/C][C]1.271[/C][C]0.103167[/C][/ROW]
[ROW][C]36[/C][C]-0.05703[/C][C]-0.6062[/C][C]0.272787[/C][/ROW]
[ROW][C]37[/C][C]-0.184082[/C][C]-1.9568[/C][C]0.026418[/C][/ROW]
[ROW][C]38[/C][C]-0.005653[/C][C]-0.0601[/C][C]0.476092[/C][/ROW]
[ROW][C]39[/C][C]0.034777[/C][C]0.3697[/C][C]0.356153[/C][/ROW]
[ROW][C]40[/C][C]-0.042784[/C][C]-0.4548[/C][C]0.325064[/C][/ROW]
[ROW][C]41[/C][C]0.038839[/C][C]0.4129[/C][C]0.340243[/C][/ROW]
[ROW][C]42[/C][C]-0.024718[/C][C]-0.2628[/C][C]0.396608[/C][/ROW]
[ROW][C]43[/C][C]-0.129844[/C][C]-1.3803[/C][C]0.085115[/C][/ROW]
[ROW][C]44[/C][C]0.037354[/C][C]0.3971[/C][C]0.346028[/C][/ROW]
[ROW][C]45[/C][C]-0.135201[/C][C]-1.4372[/C][C]0.076711[/C][/ROW]
[ROW][C]46[/C][C]-0.057874[/C][C]-0.6152[/C][C]0.269825[/C][/ROW]
[ROW][C]47[/C][C]-0.111678[/C][C]-1.1871[/C][C]0.118829[/C][/ROW]
[ROW][C]48[/C][C]-0.125141[/C][C]-1.3303[/C][C]0.093054[/C][/ROW]
[ROW][C]49[/C][C]0.091649[/C][C]0.9742[/C][C]0.166009[/C][/ROW]
[ROW][C]50[/C][C]0.066972[/C][C]0.7119[/C][C]0.238989[/C][/ROW]
[ROW][C]51[/C][C]0.047624[/C][C]0.5062[/C][C]0.306835[/C][/ROW]
[ROW][C]52[/C][C]-0.072689[/C][C]-0.7727[/C][C]0.220658[/C][/ROW]
[ROW][C]53[/C][C]-0.105087[/C][C]-1.1171[/C][C]0.133163[/C][/ROW]
[ROW][C]54[/C][C]0.019318[/C][C]0.2054[/C][C]0.418831[/C][/ROW]
[ROW][C]55[/C][C]-0.02186[/C][C]-0.2324[/C][C]0.408332[/C][/ROW]
[ROW][C]56[/C][C]-0.041148[/C][C]-0.4374[/C][C]0.331324[/C][/ROW]
[ROW][C]57[/C][C]0.011584[/C][C]0.1231[/C][C]0.451108[/C][/ROW]
[ROW][C]58[/C][C]-0.069802[/C][C]-0.742[/C][C]0.229813[/C][/ROW]
[ROW][C]59[/C][C]0.06349[/C][C]0.6749[/C][C]0.250555[/C][/ROW]
[ROW][C]60[/C][C]-0.058862[/C][C]-0.6257[/C][C]0.266384[/C][/ROW]
[/TABLE]
Source: https://freestatistics.org/blog/index.php?pk=300996&T=2

Globally Unique Identifier (entire table): ba.freestatistics.org/blog/index.php?pk=300996&T=2

As an alternative you can also use a QR Code:  

The GUIDs for individual cells are displayed in the table below:

Partial Autocorrelation Function
Time lag kPACF(k)T-STATP-value
1-0.410107-4.35951.4e-05
2-0.13426-1.42720.078139
30.0287910.30610.380065
4-0.145489-1.54660.062382
5-0.137235-1.45880.073693
60.0051090.05430.478391
70.0884680.94040.174501
8-0.070193-0.74620.22856
90.0221670.23560.407072
10-0.038607-0.41040.341145
110.1377661.46450.072921
12-0.309465-3.28970.000669
13-0.218502-2.32270.010993
14-0.136723-1.45340.074444
150.045740.48620.313874
16-0.102976-1.09460.138
17-0.038884-0.41330.340071
18-0.002245-0.02390.490501
19-0.076157-0.80960.209948
20-0.091084-0.96820.167498
210.0109390.11630.453819
220.0919190.97710.165301
230.213262.2670.012647
24-0.104132-1.10690.135335
25-0.110223-1.17170.121894
26-0.032701-0.34760.364389
27-0.056671-0.60240.27405
28-0.159638-1.6970.046227
290.0291940.31030.378436
30-0.098463-1.04670.148741
31-0.179288-1.90590.029604
32-0.093373-0.99260.161521
330.0389270.41380.339901
34-0.217979-2.31710.011149
350.1195671.2710.103167
36-0.05703-0.60620.272787
37-0.184082-1.95680.026418
38-0.005653-0.06010.476092
390.0347770.36970.356153
40-0.042784-0.45480.325064
410.0388390.41290.340243
42-0.024718-0.26280.396608
43-0.129844-1.38030.085115
440.0373540.39710.346028
45-0.135201-1.43720.076711
46-0.057874-0.61520.269825
47-0.111678-1.18710.118829
48-0.125141-1.33030.093054
490.0916490.97420.166009
500.0669720.71190.238989
510.0476240.50620.306835
52-0.072689-0.77270.220658
53-0.105087-1.11710.133163
540.0193180.20540.418831
55-0.02186-0.23240.408332
56-0.041148-0.43740.331324
570.0115840.12310.451108
58-0.069802-0.7420.229813
590.063490.67490.250555
60-0.058862-0.62570.266384


Parameters (Session):
par1 = 1 ; par2 = 0 ; par3 = 1 ; par4 = 2 ;
Parameters (R input):
par1 = 60 ; par2 = 1 ; par3 = 1 ; par4 = 1 ; par5 = 12 ; par6 = White Noise ; par7 = 0.95 ; par8 = ;
R code (references can be found in the software module):
par8 <- ''
par7 <- '0.95'
par6 <- 'White Noise'
par5 <- '12'
par4 <- '0'
par3 <- '1'
par2 <- '1'
par1 <- '60'
if (par1 == 'Default') {
par1 = 10*log10(length(x))
} else {
par1 <- as.numeric(par1)
}
par2 <- as.numeric(par2)
par3 <- as.numeric(par3)
par4 <- as.numeric(par4)
par5 <- as.numeric(par5)
if (par6 == 'White Noise') par6 <- 'white' else par6 <- 'ma'
par7 <- as.numeric(par7)
if (par8 != '') par8 <- as.numeric(par8)
x <- na.omit(x)
ox <- x
if (par8 == '') {
if (par2 == 0) {
x <- log(x)
} else {
x <- (x ^ par2 - 1) / par2
}
} else {
x <- log(x,base=par8)
}
if (par3 > 0) x <- diff(x,lag=1,difference=par3)
if (par4 > 0) x <- diff(x,lag=par5,difference=par4)
bitmap(file='picts.png')
op <- par(mfrow=c(2,1))
plot(ox,type='l',main='Original Time Series',xlab='time',ylab='value')
if (par8=='') {
mytitle <- paste('Working Time Series (lambda=',par2,', d=',par3,', D=',par4,')',sep='')
mysub <- paste('(lambda=',par2,', d=',par3,', D=',par4,', CI=', par7, ', CI type=',par6,')',sep='')
} else {
mytitle <- paste('Working Time Series (base=',par8,', d=',par3,', D=',par4,')',sep='')
mysub <- paste('(base=',par8,', d=',par3,', D=',par4,', CI=', par7, ', CI type=',par6,')',sep='')
}
plot(x,type='l', main=mytitle,xlab='time',ylab='value')
par(op)
dev.off()
bitmap(file='pic1.png')
racf <- acf(x, par1, main='Autocorrelation', xlab='time lag', ylab='ACF', ci.type=par6, ci=par7, sub=mysub)
dev.off()
bitmap(file='pic2.png')
rpacf <- pacf(x,par1,main='Partial Autocorrelation',xlab='lags',ylab='PACF',sub=mysub)
dev.off()
(myacf <- c(racf$acf))
(mypacf <- c(rpacf$acf))
lengthx <- length(x)
sqrtn <- sqrt(lengthx)
load(file='createtable')
a<-table.start()
a<-table.row.start(a)
a<-table.element(a,'Autocorrelation Function',4,TRUE)
a<-table.row.end(a)
a<-table.row.start(a)
a<-table.element(a,'Time lag k',header=TRUE)
a<-table.element(a,'ACF(k)',header=TRUE)
a<-table.element(a,'T-STAT',header=TRUE)
a<-table.element(a,'P-value',header=TRUE)
a<-table.row.end(a)
for (i in 2:(par1+1)) {
a<-table.row.start(a)
a<-table.element(a,i-1,header=TRUE)
a<-table.element(a,round(myacf[i],6))
mytstat <- myacf[i]*sqrtn
a<-table.element(a,round(mytstat,4))
a<-table.element(a,round(1-pt(abs(mytstat),lengthx),6))
a<-table.row.end(a)
}
a<-table.end(a)
table.save(a,file='mytable.tab')
a<-table.start()
a<-table.row.start(a)
a<-table.element(a,'Partial Autocorrelation Function',4,TRUE)
a<-table.row.end(a)
a<-table.row.start(a)
a<-table.element(a,'Time lag k',header=TRUE)
a<-table.element(a,'PACF(k)',header=TRUE)
a<-table.element(a,'T-STAT',header=TRUE)
a<-table.element(a,'P-value',header=TRUE)
a<-table.row.end(a)
for (i in 1:par1) {
a<-table.row.start(a)
a<-table.element(a,i,header=TRUE)
a<-table.element(a,round(mypacf[i],6))
mytstat <- mypacf[i]*sqrtn
a<-table.element(a,round(mytstat,4))
a<-table.element(a,round(1-pt(abs(mytstat),lengthx),6))
a<-table.row.end(a)
}
a<-table.end(a)
table.save(a,file='mytable1.tab')