Free Statistics

of Irreproducible Research!

Author's title

Author*The author of this computation has been verified*
R Software Modulerwasp_arimaforecasting.wasp
Title produced by softwareARIMA Forecasting
Date of computationSat, 17 Dec 2016 20:28:55 +0100
Cite this page as followsStatistical Computations at FreeStatistics.org, Office for Research Development and Education, URL https://freestatistics.org/blog/index.php?v=date/2016/Dec/17/t1482002959h72m58w9te4h41j.htm/, Retrieved Fri, 01 Nov 2024 03:34:32 +0000
Statistical Computations at FreeStatistics.org, Office for Research Development and Education, URL https://freestatistics.org/blog/index.php?pk=300918, Retrieved Fri, 01 Nov 2024 03:34:32 +0000
QR Codes:

Original text written by user:
IsPrivate?No (this computation is public)
User-defined keywords
Estimated Impact90
Family? (F = Feedback message, R = changed R code, M = changed R Module, P = changed Parameters, D = changed Data)
-       [ARIMA Forecasting] [AMIRA] [2016-12-17 19:28:55] [e6dc02234f5305f92311fb16bc25f73e] [Current]
Feedback Forum

Post a new message
Dataseries X:
13663
11635
9606
8784.5
9415.5
10418
11344.5
11271
11895
12152.5
12731
12951
10692
8563.5
6217
5562
6294.5
7422
9254.5
10607
11268
12041
12962.5
12200.5
10400.5
8765
7000
6677
7318
7999
8762
9696
10373
10682.5
10935.5
10815.5
8669
7079.5
5640
5238.5
5777.5
6479
7290
7343
7810.5
8171.5
8532
8719
7281.5
5923.5
4837
4675.5
4585.5
5083
5766
6201
6778
7393.5
7849.5
8282.5
7610
6192.5
4693.5
4869
5149
5648.5
6230.5
7032
7727
8087.5
8443
9002
7717.5
6374.5
4995.5
4655
5198
5501
6119.5
6922
7390
7466.5
7773
7865
6567
5132.5
3656.5
3623
4045.5
4617
5374
6022.5
6464.5
7058
7484.5
7955
6801
5499
4179.5
4305.5
3304
5773.5
6419.5
6938
7760
8224
8381
8667
7304.5
5565.5
4023
3932.5
4508.5
5491
6284


Summary of computational transaction
Raw Input view raw input (R code)
Raw Outputview raw output of R engine
Computing time2 seconds
R ServerBig Analytics Cloud Computing Center

\begin{tabular}{lllllllll}
\hline
Summary of computational transaction \tabularnewline
Raw Input view raw input (R code)  \tabularnewline
Raw Outputview raw output of R engine  \tabularnewline
Computing time2 seconds \tabularnewline
R ServerBig Analytics Cloud Computing Center \tabularnewline
\hline
\end{tabular}
%Source: https://freestatistics.org/blog/index.php?pk=300918&T=0

[TABLE]
[ROW]
Summary of computational transaction[/C][/ROW] [ROW]Raw Input[/C] view raw input (R code) [/C][/ROW] [ROW]Raw Output[/C]view raw output of R engine [/C][/ROW] [ROW]Computing time[/C]2 seconds[/C][/ROW] [ROW]R Server[/C]Big Analytics Cloud Computing Center[/C][/ROW] [/TABLE] Source: https://freestatistics.org/blog/index.php?pk=300918&T=0

Globally Unique Identifier (entire table): ba.freestatistics.org/blog/index.php?pk=300918&T=0

As an alternative you can also use a QR Code:  

The GUIDs for individual cells are displayed in the table below:

Summary of computational transaction
Raw Input view raw input (R code)
Raw Outputview raw output of R engine
Computing time2 seconds
R ServerBig Analytics Cloud Computing Center


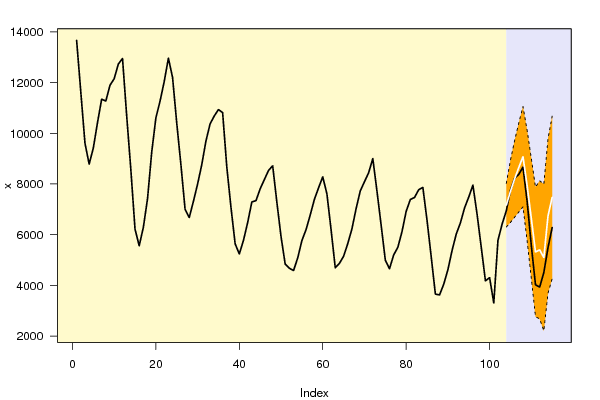
Univariate ARIMA Extrapolation Forecast
timeY[t]F[t]95% LB95% UBp-value(H0: Y[t] = F[t])P(F[t]>Y[t-1])P(F[t]>Y[t-s])P(F[t]>Y[103])
915374-------
926022.5-------
936464.5-------
947058-------
957484.5-------
967955-------
976801-------
985499-------
994179.5-------
1004305.5-------
1013304-------
1025773.5-------
1036419.5-------
10469387162.67866300.97578024.38160.30470.95450.99520.9545
10577607710.4866483.36788937.60410.46850.89140.97670.9804
10682248202.02456688.79539715.25360.48860.71650.93080.9895
10783818651.48696892.321310410.65250.38160.68310.90320.9936
10886679075.97967096.024211055.9350.34280.75430.86640.9957
1097304.57931.95185748.710310115.19330.28660.25470.8450.9127
1105565.56637.52794263.96029011.09560.1880.29090.82640.5714
11140235321.7252767.91937875.53070.15940.42580.80970.1997
1123932.55400.80992674.85248126.76750.14550.83910.78450.2319
1134508.55100.08562208.61767991.55370.34420.78570.88830.1856
11454916739.96213688.54389791.38050.21120.92410.73260.5815
11562847472.94344266.302610679.58420.23370.88710.74020.7402

\begin{tabular}{lllllllll}
\hline
Univariate ARIMA Extrapolation Forecast \tabularnewline
time & Y[t] & F[t] & 95% LB & 95% UB & p-value(H0: Y[t] = F[t]) & P(F[t]>Y[t-1]) & P(F[t]>Y[t-s]) & P(F[t]>Y[103]) \tabularnewline
91 & 5374 & - & - & - & - & - & - & - \tabularnewline
92 & 6022.5 & - & - & - & - & - & - & - \tabularnewline
93 & 6464.5 & - & - & - & - & - & - & - \tabularnewline
94 & 7058 & - & - & - & - & - & - & - \tabularnewline
95 & 7484.5 & - & - & - & - & - & - & - \tabularnewline
96 & 7955 & - & - & - & - & - & - & - \tabularnewline
97 & 6801 & - & - & - & - & - & - & - \tabularnewline
98 & 5499 & - & - & - & - & - & - & - \tabularnewline
99 & 4179.5 & - & - & - & - & - & - & - \tabularnewline
100 & 4305.5 & - & - & - & - & - & - & - \tabularnewline
101 & 3304 & - & - & - & - & - & - & - \tabularnewline
102 & 5773.5 & - & - & - & - & - & - & - \tabularnewline
103 & 6419.5 & - & - & - & - & - & - & - \tabularnewline
104 & 6938 & 7162.6786 & 6300.9757 & 8024.3816 & 0.3047 & 0.9545 & 0.9952 & 0.9545 \tabularnewline
105 & 7760 & 7710.486 & 6483.3678 & 8937.6041 & 0.4685 & 0.8914 & 0.9767 & 0.9804 \tabularnewline
106 & 8224 & 8202.0245 & 6688.7953 & 9715.2536 & 0.4886 & 0.7165 & 0.9308 & 0.9895 \tabularnewline
107 & 8381 & 8651.4869 & 6892.3213 & 10410.6525 & 0.3816 & 0.6831 & 0.9032 & 0.9936 \tabularnewline
108 & 8667 & 9075.9796 & 7096.0242 & 11055.935 & 0.3428 & 0.7543 & 0.8664 & 0.9957 \tabularnewline
109 & 7304.5 & 7931.9518 & 5748.7103 & 10115.1933 & 0.2866 & 0.2547 & 0.845 & 0.9127 \tabularnewline
110 & 5565.5 & 6637.5279 & 4263.9602 & 9011.0956 & 0.188 & 0.2909 & 0.8264 & 0.5714 \tabularnewline
111 & 4023 & 5321.725 & 2767.9193 & 7875.5307 & 0.1594 & 0.4258 & 0.8097 & 0.1997 \tabularnewline
112 & 3932.5 & 5400.8099 & 2674.8524 & 8126.7675 & 0.1455 & 0.8391 & 0.7845 & 0.2319 \tabularnewline
113 & 4508.5 & 5100.0856 & 2208.6176 & 7991.5537 & 0.3442 & 0.7857 & 0.8883 & 0.1856 \tabularnewline
114 & 5491 & 6739.9621 & 3688.5438 & 9791.3805 & 0.2112 & 0.9241 & 0.7326 & 0.5815 \tabularnewline
115 & 6284 & 7472.9434 & 4266.3026 & 10679.5842 & 0.2337 & 0.8871 & 0.7402 & 0.7402 \tabularnewline
\hline
\end{tabular}
%Source: https://freestatistics.org/blog/index.php?pk=300918&T=1

[TABLE]
[ROW][C]Univariate ARIMA Extrapolation Forecast[/C][/ROW]
[ROW][C]time[/C][C]Y[t][/C][C]F[t][/C][C]95% LB[/C][C]95% UB[/C][C]p-value(H0: Y[t] = F[t])[/C][C]P(F[t]>Y[t-1])[/C][C]P(F[t]>Y[t-s])[/C][C]P(F[t]>Y[103])[/C][/ROW]
[ROW][C]91[/C][C]5374[/C][C]-[/C][C]-[/C][C]-[/C][C]-[/C][C]-[/C][C]-[/C][C]-[/C][/ROW]
[ROW][C]92[/C][C]6022.5[/C][C]-[/C][C]-[/C][C]-[/C][C]-[/C][C]-[/C][C]-[/C][C]-[/C][/ROW]
[ROW][C]93[/C][C]6464.5[/C][C]-[/C][C]-[/C][C]-[/C][C]-[/C][C]-[/C][C]-[/C][C]-[/C][/ROW]
[ROW][C]94[/C][C]7058[/C][C]-[/C][C]-[/C][C]-[/C][C]-[/C][C]-[/C][C]-[/C][C]-[/C][/ROW]
[ROW][C]95[/C][C]7484.5[/C][C]-[/C][C]-[/C][C]-[/C][C]-[/C][C]-[/C][C]-[/C][C]-[/C][/ROW]
[ROW][C]96[/C][C]7955[/C][C]-[/C][C]-[/C][C]-[/C][C]-[/C][C]-[/C][C]-[/C][C]-[/C][/ROW]
[ROW][C]97[/C][C]6801[/C][C]-[/C][C]-[/C][C]-[/C][C]-[/C][C]-[/C][C]-[/C][C]-[/C][/ROW]
[ROW][C]98[/C][C]5499[/C][C]-[/C][C]-[/C][C]-[/C][C]-[/C][C]-[/C][C]-[/C][C]-[/C][/ROW]
[ROW][C]99[/C][C]4179.5[/C][C]-[/C][C]-[/C][C]-[/C][C]-[/C][C]-[/C][C]-[/C][C]-[/C][/ROW]
[ROW][C]100[/C][C]4305.5[/C][C]-[/C][C]-[/C][C]-[/C][C]-[/C][C]-[/C][C]-[/C][C]-[/C][/ROW]
[ROW][C]101[/C][C]3304[/C][C]-[/C][C]-[/C][C]-[/C][C]-[/C][C]-[/C][C]-[/C][C]-[/C][/ROW]
[ROW][C]102[/C][C]5773.5[/C][C]-[/C][C]-[/C][C]-[/C][C]-[/C][C]-[/C][C]-[/C][C]-[/C][/ROW]
[ROW][C]103[/C][C]6419.5[/C][C]-[/C][C]-[/C][C]-[/C][C]-[/C][C]-[/C][C]-[/C][C]-[/C][/ROW]
[ROW][C]104[/C][C]6938[/C][C]7162.6786[/C][C]6300.9757[/C][C]8024.3816[/C][C]0.3047[/C][C]0.9545[/C][C]0.9952[/C][C]0.9545[/C][/ROW]
[ROW][C]105[/C][C]7760[/C][C]7710.486[/C][C]6483.3678[/C][C]8937.6041[/C][C]0.4685[/C][C]0.8914[/C][C]0.9767[/C][C]0.9804[/C][/ROW]
[ROW][C]106[/C][C]8224[/C][C]8202.0245[/C][C]6688.7953[/C][C]9715.2536[/C][C]0.4886[/C][C]0.7165[/C][C]0.9308[/C][C]0.9895[/C][/ROW]
[ROW][C]107[/C][C]8381[/C][C]8651.4869[/C][C]6892.3213[/C][C]10410.6525[/C][C]0.3816[/C][C]0.6831[/C][C]0.9032[/C][C]0.9936[/C][/ROW]
[ROW][C]108[/C][C]8667[/C][C]9075.9796[/C][C]7096.0242[/C][C]11055.935[/C][C]0.3428[/C][C]0.7543[/C][C]0.8664[/C][C]0.9957[/C][/ROW]
[ROW][C]109[/C][C]7304.5[/C][C]7931.9518[/C][C]5748.7103[/C][C]10115.1933[/C][C]0.2866[/C][C]0.2547[/C][C]0.845[/C][C]0.9127[/C][/ROW]
[ROW][C]110[/C][C]5565.5[/C][C]6637.5279[/C][C]4263.9602[/C][C]9011.0956[/C][C]0.188[/C][C]0.2909[/C][C]0.8264[/C][C]0.5714[/C][/ROW]
[ROW][C]111[/C][C]4023[/C][C]5321.725[/C][C]2767.9193[/C][C]7875.5307[/C][C]0.1594[/C][C]0.4258[/C][C]0.8097[/C][C]0.1997[/C][/ROW]
[ROW][C]112[/C][C]3932.5[/C][C]5400.8099[/C][C]2674.8524[/C][C]8126.7675[/C][C]0.1455[/C][C]0.8391[/C][C]0.7845[/C][C]0.2319[/C][/ROW]
[ROW][C]113[/C][C]4508.5[/C][C]5100.0856[/C][C]2208.6176[/C][C]7991.5537[/C][C]0.3442[/C][C]0.7857[/C][C]0.8883[/C][C]0.1856[/C][/ROW]
[ROW][C]114[/C][C]5491[/C][C]6739.9621[/C][C]3688.5438[/C][C]9791.3805[/C][C]0.2112[/C][C]0.9241[/C][C]0.7326[/C][C]0.5815[/C][/ROW]
[ROW][C]115[/C][C]6284[/C][C]7472.9434[/C][C]4266.3026[/C][C]10679.5842[/C][C]0.2337[/C][C]0.8871[/C][C]0.7402[/C][C]0.7402[/C][/ROW]
[/TABLE]
Source: https://freestatistics.org/blog/index.php?pk=300918&T=1

Globally Unique Identifier (entire table): ba.freestatistics.org/blog/index.php?pk=300918&T=1

As an alternative you can also use a QR Code:  

The GUIDs for individual cells are displayed in the table below:

Univariate ARIMA Extrapolation Forecast
timeY[t]F[t]95% LB95% UBp-value(H0: Y[t] = F[t])P(F[t]>Y[t-1])P(F[t]>Y[t-s])P(F[t]>Y[103])
915374-------
926022.5-------
936464.5-------
947058-------
957484.5-------
967955-------
976801-------
985499-------
994179.5-------
1004305.5-------
1013304-------
1025773.5-------
1036419.5-------
10469387162.67866300.97578024.38160.30470.95450.99520.9545
10577607710.4866483.36788937.60410.46850.89140.97670.9804
10682248202.02456688.79539715.25360.48860.71650.93080.9895
10783818651.48696892.321310410.65250.38160.68310.90320.9936
10886679075.97967096.024211055.9350.34280.75430.86640.9957
1097304.57931.95185748.710310115.19330.28660.25470.8450.9127
1105565.56637.52794263.96029011.09560.1880.29090.82640.5714
11140235321.7252767.91937875.53070.15940.42580.80970.1997
1123932.55400.80992674.85248126.76750.14550.83910.78450.2319
1134508.55100.08562208.61767991.55370.34420.78570.88830.1856
11454916739.96213688.54389791.38050.21120.92410.73260.5815
11562847472.94344266.302610679.58420.23370.88710.74020.7402


Univariate ARIMA Extrapolation Forecast Performance
time% S.E.PEMAPEsMAPESq.EMSERMSEScaledEMASE
1040.0614-0.03240.03240.031950480.494100-0.28040.2804
1050.08120.00640.01940.01912451.639926466.067162.68390.06180.1711
1060.09410.00270.01380.0136482.923517805.0192133.43540.02740.1232
1070.1037-0.03230.01840.018273163.181731644.5598177.8892-0.33750.1768
1080.1113-0.04720.02420.0238167264.320758768.512242.4222-0.51040.2435
1090.1404-0.08590.03450.0335393695.7432114589.7172338.511-0.7830.3334
1100.1824-0.19260.05710.05381149243.7793262397.4403512.2474-1.33780.4769
1110.2448-0.32280.09030.08191686686.5982440433.5851663.6517-1.62060.6199
1120.2575-0.37340.12170.10772155934.0795631044.7511794.3833-1.83230.7546
1130.2893-0.13120.12270.1093349973.558602937.6318776.4906-0.73820.7529
1140.231-0.22750.13220.11791559906.3932689934.7919830.6231-1.55850.8262
1150.2189-0.18920.1370.12251413586.3147750239.0855866.1634-1.48370.881

\begin{tabular}{lllllllll}
\hline
Univariate ARIMA Extrapolation Forecast Performance \tabularnewline
time & % S.E. & PE & MAPE & sMAPE & Sq.E & MSE & RMSE & ScaledE & MASE \tabularnewline
104 & 0.0614 & -0.0324 & 0.0324 & 0.0319 & 50480.4941 & 0 & 0 & -0.2804 & 0.2804 \tabularnewline
105 & 0.0812 & 0.0064 & 0.0194 & 0.0191 & 2451.6399 & 26466.067 & 162.6839 & 0.0618 & 0.1711 \tabularnewline
106 & 0.0941 & 0.0027 & 0.0138 & 0.0136 & 482.9235 & 17805.0192 & 133.4354 & 0.0274 & 0.1232 \tabularnewline
107 & 0.1037 & -0.0323 & 0.0184 & 0.0182 & 73163.1817 & 31644.5598 & 177.8892 & -0.3375 & 0.1768 \tabularnewline
108 & 0.1113 & -0.0472 & 0.0242 & 0.0238 & 167264.3207 & 58768.512 & 242.4222 & -0.5104 & 0.2435 \tabularnewline
109 & 0.1404 & -0.0859 & 0.0345 & 0.0335 & 393695.7432 & 114589.7172 & 338.511 & -0.783 & 0.3334 \tabularnewline
110 & 0.1824 & -0.1926 & 0.0571 & 0.0538 & 1149243.7793 & 262397.4403 & 512.2474 & -1.3378 & 0.4769 \tabularnewline
111 & 0.2448 & -0.3228 & 0.0903 & 0.0819 & 1686686.5982 & 440433.5851 & 663.6517 & -1.6206 & 0.6199 \tabularnewline
112 & 0.2575 & -0.3734 & 0.1217 & 0.1077 & 2155934.0795 & 631044.7511 & 794.3833 & -1.8323 & 0.7546 \tabularnewline
113 & 0.2893 & -0.1312 & 0.1227 & 0.1093 & 349973.558 & 602937.6318 & 776.4906 & -0.7382 & 0.7529 \tabularnewline
114 & 0.231 & -0.2275 & 0.1322 & 0.1179 & 1559906.3932 & 689934.7919 & 830.6231 & -1.5585 & 0.8262 \tabularnewline
115 & 0.2189 & -0.1892 & 0.137 & 0.1225 & 1413586.3147 & 750239.0855 & 866.1634 & -1.4837 & 0.881 \tabularnewline
\hline
\end{tabular}
%Source: https://freestatistics.org/blog/index.php?pk=300918&T=2

[TABLE]
[ROW][C]Univariate ARIMA Extrapolation Forecast Performance[/C][/ROW]
[ROW][C]time[/C][C]% S.E.[/C][C]PE[/C][C]MAPE[/C][C]sMAPE[/C][C]Sq.E[/C][C]MSE[/C][C]RMSE[/C][C]ScaledE[/C][C]MASE[/C][/ROW]
[ROW][C]104[/C][C]0.0614[/C][C]-0.0324[/C][C]0.0324[/C][C]0.0319[/C][C]50480.4941[/C][C]0[/C][C]0[/C][C]-0.2804[/C][C]0.2804[/C][/ROW]
[ROW][C]105[/C][C]0.0812[/C][C]0.0064[/C][C]0.0194[/C][C]0.0191[/C][C]2451.6399[/C][C]26466.067[/C][C]162.6839[/C][C]0.0618[/C][C]0.1711[/C][/ROW]
[ROW][C]106[/C][C]0.0941[/C][C]0.0027[/C][C]0.0138[/C][C]0.0136[/C][C]482.9235[/C][C]17805.0192[/C][C]133.4354[/C][C]0.0274[/C][C]0.1232[/C][/ROW]
[ROW][C]107[/C][C]0.1037[/C][C]-0.0323[/C][C]0.0184[/C][C]0.0182[/C][C]73163.1817[/C][C]31644.5598[/C][C]177.8892[/C][C]-0.3375[/C][C]0.1768[/C][/ROW]
[ROW][C]108[/C][C]0.1113[/C][C]-0.0472[/C][C]0.0242[/C][C]0.0238[/C][C]167264.3207[/C][C]58768.512[/C][C]242.4222[/C][C]-0.5104[/C][C]0.2435[/C][/ROW]
[ROW][C]109[/C][C]0.1404[/C][C]-0.0859[/C][C]0.0345[/C][C]0.0335[/C][C]393695.7432[/C][C]114589.7172[/C][C]338.511[/C][C]-0.783[/C][C]0.3334[/C][/ROW]
[ROW][C]110[/C][C]0.1824[/C][C]-0.1926[/C][C]0.0571[/C][C]0.0538[/C][C]1149243.7793[/C][C]262397.4403[/C][C]512.2474[/C][C]-1.3378[/C][C]0.4769[/C][/ROW]
[ROW][C]111[/C][C]0.2448[/C][C]-0.3228[/C][C]0.0903[/C][C]0.0819[/C][C]1686686.5982[/C][C]440433.5851[/C][C]663.6517[/C][C]-1.6206[/C][C]0.6199[/C][/ROW]
[ROW][C]112[/C][C]0.2575[/C][C]-0.3734[/C][C]0.1217[/C][C]0.1077[/C][C]2155934.0795[/C][C]631044.7511[/C][C]794.3833[/C][C]-1.8323[/C][C]0.7546[/C][/ROW]
[ROW][C]113[/C][C]0.2893[/C][C]-0.1312[/C][C]0.1227[/C][C]0.1093[/C][C]349973.558[/C][C]602937.6318[/C][C]776.4906[/C][C]-0.7382[/C][C]0.7529[/C][/ROW]
[ROW][C]114[/C][C]0.231[/C][C]-0.2275[/C][C]0.1322[/C][C]0.1179[/C][C]1559906.3932[/C][C]689934.7919[/C][C]830.6231[/C][C]-1.5585[/C][C]0.8262[/C][/ROW]
[ROW][C]115[/C][C]0.2189[/C][C]-0.1892[/C][C]0.137[/C][C]0.1225[/C][C]1413586.3147[/C][C]750239.0855[/C][C]866.1634[/C][C]-1.4837[/C][C]0.881[/C][/ROW]
[/TABLE]
Source: https://freestatistics.org/blog/index.php?pk=300918&T=2

Globally Unique Identifier (entire table): ba.freestatistics.org/blog/index.php?pk=300918&T=2

As an alternative you can also use a QR Code:  

The GUIDs for individual cells are displayed in the table below:

Univariate ARIMA Extrapolation Forecast Performance
time% S.E.PEMAPEsMAPESq.EMSERMSEScaledEMASE
1040.0614-0.03240.03240.031950480.494100-0.28040.2804
1050.08120.00640.01940.01912451.639926466.067162.68390.06180.1711
1060.09410.00270.01380.0136482.923517805.0192133.43540.02740.1232
1070.1037-0.03230.01840.018273163.181731644.5598177.8892-0.33750.1768
1080.1113-0.04720.02420.0238167264.320758768.512242.4222-0.51040.2435
1090.1404-0.08590.03450.0335393695.7432114589.7172338.511-0.7830.3334
1100.1824-0.19260.05710.05381149243.7793262397.4403512.2474-1.33780.4769
1110.2448-0.32280.09030.08191686686.5982440433.5851663.6517-1.62060.6199
1120.2575-0.37340.12170.10772155934.0795631044.7511794.3833-1.83230.7546
1130.2893-0.13120.12270.1093349973.558602937.6318776.4906-0.73820.7529
1140.231-0.22750.13220.11791559906.3932689934.7919830.6231-1.55850.8262
1150.2189-0.18920.1370.12251413586.3147750239.0855866.1634-1.48370.881


Parameters (Session):
par1 = 1 ; par2 = 2 ; par3 = 1 ; par4 = 12 ;
Parameters (R input):
par1 = 12 ; par2 = 1 ; par3 = 2 ; par4 = 1 ; par5 = 12 ; par6 = 0 ; par7 = 1 ; par8 = 0 ; par9 = 1 ; par10 = TRUE ;
R code (references can be found in the software module):
par10 <- 'TRUE'
par9 <- '1'
par8 <- '0'
par7 <- '1'
par6 <- '0'
par5 <- '12'
par4 <- '1'
par3 <- '2'
par2 <- '1'
par1 <- '0'
par1 <- as.numeric(par1) #cut off periods
par2 <- as.numeric(par2) #lambda
par3 <- as.numeric(par3) #degree of non-seasonal differencing
par4 <- as.numeric(par4) #degree of seasonal differencing
par5 <- as.numeric(par5) #seasonal period
par6 <- as.numeric(par6) #p
par7 <- as.numeric(par7) #q
par8 <- as.numeric(par8) #P
par9 <- as.numeric(par9) #Q
if (par10 == 'TRUE') par10 <- TRUE
if (par10 == 'FALSE') par10 <- FALSE
if (par2 == 0) x <- log(x)
if (par2 != 0) x <- x^par2
lx <- length(x)
first <- lx - 2*par1
nx <- lx - par1
nx1 <- nx + 1
fx <- lx - nx
if (fx < 1) {
fx <- par5*2
nx1 <- lx + fx - 1
first <- lx - 2*fx
}
first <- 1
if (fx < 3) fx <- round(lx/10,0)
(arima.out <- arima(x[1:nx], order=c(par6,par3,par7), seasonal=list(order=c(par8,par4,par9), period=par5), include.mean=par10, method='ML'))
(forecast <- predict(arima.out,fx))
(lb <- forecast$pred - 1.96 * forecast$se)
(ub <- forecast$pred + 1.96 * forecast$se)
if (par2 == 0) {
x <- exp(x)
forecast$pred <- exp(forecast$pred)
lb <- exp(lb)
ub <- exp(ub)
}
if (par2 != 0) {
x <- x^(1/par2)
forecast$pred <- forecast$pred^(1/par2)
lb <- lb^(1/par2)
ub <- ub^(1/par2)
}
if (par2 < 0) {
olb <- lb
lb <- ub
ub <- olb
}
(actandfor <- c(x[1:nx], forecast$pred))
(perc.se <- (ub-forecast$pred)/1.96/forecast$pred)
bitmap(file='test1.png')
opar <- par(mar=c(4,4,2,2),las=1)
ylim <- c( min(x[first:nx],lb), max(x[first:nx],ub))
plot(x,ylim=ylim,type='n',xlim=c(first,lx))
usr <- par('usr')
rect(usr[1],usr[3],nx+1,usr[4],border=NA,col='lemonchiffon')
rect(nx1,usr[3],usr[2],usr[4],border=NA,col='lavender')
abline(h= (-3:3)*2 , col ='gray', lty =3)
polygon( c(nx1:lx,lx:nx1), c(lb,rev(ub)), col = 'orange', lty=2,border=NA)
lines(nx1:lx, lb , lty=2)
lines(nx1:lx, ub , lty=2)
lines(x, lwd=2)
lines(nx1:lx, forecast$pred , lwd=2 , col ='white')
box()
par(opar)
dev.off()
prob.dec <- array(NA, dim=fx)
prob.sdec <- array(NA, dim=fx)
prob.ldec <- array(NA, dim=fx)
prob.pval <- array(NA, dim=fx)
perf.pe <- array(0, dim=fx)
perf.spe <- array(0, dim=fx)
perf.scalederr <- array(0, dim=fx)
perf.mase <- array(0, dim=fx)
perf.mase1 <- array(0, dim=fx)
perf.mape <- array(0, dim=fx)
perf.smape <- array(0, dim=fx)
perf.mape1 <- array(0, dim=fx)
perf.smape1 <- array(0,dim=fx)
perf.se <- array(0, dim=fx)
perf.mse <- array(0, dim=fx)
perf.mse1 <- array(0, dim=fx)
perf.rmse <- array(0, dim=fx)
perf.scaleddenom <- 0
for (i in 2:fx) {
perf.scaleddenom = perf.scaleddenom + abs(x[nx+i] - x[nx+i-1])
}
perf.scaleddenom = perf.scaleddenom / (fx-1)
for (i in 1:fx) {
locSD <- (ub[i] - forecast$pred[i]) / 1.96
perf.scalederr[i] = (x[nx+i] - forecast$pred[i]) / perf.scaleddenom
perf.pe[i] = (x[nx+i] - forecast$pred[i]) / x[nx+i]
perf.spe[i] = 2*(x[nx+i] - forecast$pred[i]) / (x[nx+i] + forecast$pred[i])
perf.se[i] = (x[nx+i] - forecast$pred[i])^2
prob.dec[i] = pnorm((x[nx+i-1] - forecast$pred[i]) / locSD)
prob.sdec[i] = pnorm((x[nx+i-par5] - forecast$pred[i]) / locSD)
prob.ldec[i] = pnorm((x[nx] - forecast$pred[i]) / locSD)
prob.pval[i] = pnorm(abs(x[nx+i] - forecast$pred[i]) / locSD)
}
perf.mape[1] = abs(perf.pe[1])
perf.smape[1] = abs(perf.spe[1])
perf.mape1[1] = perf.mape[1]
perf.smape1[1] = perf.smape[1]
perf.mse[1] = perf.se[1]
perf.mase[1] = abs(perf.scalederr[1])
perf.mase1[1] = perf.mase[1]
for (i in 2:fx) {
perf.mape[i] = perf.mape[i-1] + abs(perf.pe[i])
perf.mape1[i] = perf.mape[i] / i
perf.smape[i] = perf.smape[i-1] + abs(perf.spe[i])
perf.smape1[i] = perf.smape[i] / i
perf.mse[i] = perf.mse[i-1] + perf.se[i]
perf.mse1[i] = perf.mse[i] / i
perf.mase[i] = perf.mase[i-1] + abs(perf.scalederr[i])
perf.mase1[i] = perf.mase[i] / i
}
perf.rmse = sqrt(perf.mse1)
bitmap(file='test2.png')
plot(forecast$pred, pch=19, type='b',main='ARIMA Extrapolation Forecast', ylab='Forecast and 95% CI', xlab='time',ylim=c(min(lb),max(ub)))
dum <- forecast$pred
dum[1:par1] <- x[(nx+1):lx]
lines(dum, lty=1)
lines(ub,lty=3)
lines(lb,lty=3)
dev.off()
load(file='createtable')
a<-table.start()
a<-table.row.start(a)
a<-table.element(a,'Univariate ARIMA Extrapolation Forecast',9,TRUE)
a<-table.row.end(a)
a<-table.row.start(a)
a<-table.element(a,'time',1,header=TRUE)
a<-table.element(a,'Y[t]',1,header=TRUE)
a<-table.element(a,'F[t]',1,header=TRUE)
a<-table.element(a,'95% LB',1,header=TRUE)
a<-table.element(a,'95% UB',1,header=TRUE)
a<-table.element(a,'p-value
(H0: Y[t] = F[t])',1,header=TRUE)
a<-table.element(a,'P(F[t]>Y[t-1])',1,header=TRUE)
a<-table.element(a,'P(F[t]>Y[t-s])',1,header=TRUE)
mylab <- paste('P(F[t]>Y[',nx,sep='')
mylab <- paste(mylab,'])',sep='')
a<-table.element(a,mylab,1,header=TRUE)
a<-table.row.end(a)
for (i in (nx-par5):nx) {
a<-table.row.start(a)
a<-table.element(a,i,header=TRUE)
a<-table.element(a,x[i])
a<-table.element(a,'-')
a<-table.row.end(a)
}
for (i in 1:fx) {
a<-table.row.start(a)
a<-table.element(a,nx+i,header=TRUE)
a<-table.element(a,round(x[nx+i],4))
a<-table.element(a,round(forecast$pred[i],4))
a<-table.element(a,round(lb[i],4))
a<-table.element(a,round(ub[i],4))
a<-table.element(a,round((1-prob.pval[i]),4))
a<-table.element(a,round((1-prob.dec[i]),4))
a<-table.element(a,round((1-prob.sdec[i]),4))
a<-table.element(a,round((1-prob.ldec[i]),4))
a<-table.row.end(a)
}
a<-table.end(a)
table.save(a,file='mytable.tab')
a<-table.start()
a<-table.row.start(a)
a<-table.element(a,'Univariate ARIMA Extrapolation Forecast Performance',10,TRUE)
a<-table.row.end(a)
a<-table.row.start(a)
a<-table.element(a,'time',1,header=TRUE)
a<-table.element(a,'% S.E.',1,header=TRUE)
a<-table.element(a,'PE',1,header=TRUE)
a<-table.element(a,'MAPE',1,header=TRUE)
a<-table.element(a,'sMAPE',1,header=TRUE)
a<-table.element(a,'Sq.E',1,header=TRUE)
a<-table.element(a,'MSE',1,header=TRUE)
a<-table.element(a,'RMSE',1,header=TRUE)
a<-table.element(a,'ScaledE',1,header=TRUE)
a<-table.element(a,'MASE',1,header=TRUE)
a<-table.row.end(a)
for (i in 1:fx) {
a<-table.row.start(a)
a<-table.element(a,nx+i,header=TRUE)
a<-table.element(a,round(perc.se[i],4))
a<-table.element(a,round(perf.pe[i],4))
a<-table.element(a,round(perf.mape1[i],4))
a<-table.element(a,round(perf.smape1[i],4))
a<-table.element(a,round(perf.se[i],4))
a<-table.element(a,round(perf.mse1[i],4))
a<-table.element(a,round(perf.rmse[i],4))
a<-table.element(a,round(perf.scalederr[i],4))
a<-table.element(a,round(perf.mase1[i],4))
a<-table.row.end(a)
}
a<-table.end(a)
table.save(a,file='mytable1.tab')