Free Statistics

of Irreproducible Research!

Author's title

Author*The author of this computation has been verified*
R Software Modulerwasp_One Factor ANOVA.wasp
Title produced by softwareOne-Way-Between-Groups ANOVA- Free Statistics Software (Calculator)
Date of computationSat, 17 Dec 2016 15:17:55 +0100
Cite this page as followsStatistical Computations at FreeStatistics.org, Office for Research Development and Education, URL https://freestatistics.org/blog/index.php?v=date/2016/Dec/17/t14819844838b1dk88kktnof2l.htm/, Retrieved Fri, 01 Nov 2024 03:41:19 +0000
Statistical Computations at FreeStatistics.org, Office for Research Development and Education, URL https://freestatistics.org/blog/index.php?pk=300806, Retrieved Fri, 01 Nov 2024 03:41:19 +0000
QR Codes:

Original text written by user:
IsPrivate?No (this computation is public)
User-defined keywords
Estimated Impact144
Family? (F = Feedback message, R = changed R code, M = changed R Module, P = changed Parameters, D = changed Data)
-       [One-Way-Between-Groups ANOVA- Free Statistics Software (Calculator)] [one-way- ANOVA] [2016-12-17 14:17:55] [4b9ab307db0841e06829391b8f16ae7f] [Current]
Feedback Forum

Post a new message
Dataseries X:
14	13
19	16
17	17
17	NA
15	NA
20	16
15	NA
19	NA
15	NA
15	17
19	17
NA	15
20	16
18	14
15	16
14	17
20	NA
NA	NA
16	NA
16	NA
16	16
10	NA
19	16
19	NA
16	NA
15	NA
18	16
17	15
19	16
17	16
NA	13
19	15
20	17
5	NA
19	13
16	17
15	NA
16	14
18	14
16	18
15	NA
17	17
NA	13
20	16
19	15
7	15
13	NA
16	15
16	13
NA	NA
18	17
18	NA
16	NA
17	11
19	14
16	13
19	NA
13	17
16	16
13	NA
12	17
17	16
17	16
17	16
16	15
16	12
14	17
16	14
13	14
16	16
14	NA
20	NA
12	NA
13	NA
18	NA
14	15
19	16
18	14
14	15
18	17
19	NA
15	10
14	NA
17	17
19	NA
13	20
19	17
18	18
20	NA
15	17
15	14
15	NA
20	17
15	NA
19	17
18	NA
18	16
15	18
20	18
17	16
12	NA
18	NA
19	15
20	13
NA	NA
17	NA
15	NA
16	NA
18	NA
18	16
14	NA
15	NA
12	NA
17	12
14	NA
18	16
17	16
17	NA
20	16
16	14
14	15
15	14
18	NA
20	15
17	NA
17	15
17	16
17	NA
15	NA
17	NA
18	11
17	NA
20	18
15	NA
16	11
15	NA
18	18
11	NA
15	15
18	19
20	17
19	NA
14	14
16	NA
15	13
17	17
18	14
20	19
17	14
18	NA
15	NA
16	16
11	16
15	15
18	12
17	NA
16	17
12	NA
19	NA
18	18
15	15
17	18
19	15
18	NA
19	NA
16	NA
16	16
16	NA
14	16


Summary of computational transaction
Raw Input view raw input (R code)
Raw Outputview raw output of R engine
Computing time4 seconds
R ServerBig Analytics Cloud Computing Center

\begin{tabular}{lllllllll}
\hline
Summary of computational transaction \tabularnewline
Raw Input view raw input (R code)  \tabularnewline
Raw Outputview raw output of R engine  \tabularnewline
Computing time4 seconds \tabularnewline
R ServerBig Analytics Cloud Computing Center \tabularnewline
\hline
\end{tabular}
%Source: https://freestatistics.org/blog/index.php?pk=300806&T=0

[TABLE]
[ROW]
Summary of computational transaction[/C][/ROW] [ROW]Raw Input[/C] view raw input (R code) [/C][/ROW] [ROW]Raw Output[/C]view raw output of R engine [/C][/ROW] [ROW]Computing time[/C]4 seconds[/C][/ROW] [ROW]R Server[/C]Big Analytics Cloud Computing Center[/C][/ROW] [/TABLE] Source: https://freestatistics.org/blog/index.php?pk=300806&T=0

Globally Unique Identifier (entire table): ba.freestatistics.org/blog/index.php?pk=300806&T=0

As an alternative you can also use a QR Code:  

The GUIDs for individual cells are displayed in the table below:

Summary of computational transaction
Raw Input view raw input (R code)
Raw Outputview raw output of R engine
Computing time4 seconds
R ServerBig Analytics Cloud Computing Center


ANOVA Model
B ~ A
means1611-0.75-1.091-1.118-0.412-0.375-0.4620.5-1-2.333

\begin{tabular}{lllllllll}
\hline
ANOVA Model \tabularnewline
B  ~  A \tabularnewline
means & 16 & 1 & 1 & -0.75 & -1.091 & -1.118 & -0.412 & -0.375 & -0.462 & 0.5 & -1 & -2.333 \tabularnewline
\hline
\end{tabular}
%Source: https://freestatistics.org/blog/index.php?pk=300806&T=1

[TABLE]
[ROW][C]ANOVA Model[/C][/ROW]
[ROW][C]B  ~  A[/C][/ROW]
[ROW][C]means[/C][C]16[/C][C]1[/C][C]1[/C][C]-0.75[/C][C]-1.091[/C][C]-1.118[/C][C]-0.412[/C][C]-0.375[/C][C]-0.462[/C][C]0.5[/C][C]-1[/C][C]-2.333[/C][/ROW]
[/TABLE]
Source: https://freestatistics.org/blog/index.php?pk=300806&T=1

Globally Unique Identifier (entire table): ba.freestatistics.org/blog/index.php?pk=300806&T=1

As an alternative you can also use a QR Code:  

The GUIDs for individual cells are displayed in the table below:

ANOVA Model
B ~ A
means1611-0.75-1.091-1.118-0.412-0.375-0.4620.5-1-2.333


ANOVA Statistics
DfSum SqMean SqF valuePr(>F)
A1142.753.8861.1230.353
Residuals91314.9393.461

\begin{tabular}{lllllllll}
\hline
ANOVA Statistics \tabularnewline
  & Df & Sum Sq & Mean Sq & F value & Pr(>F) \tabularnewline
A & 11 & 42.75 & 3.886 & 1.123 & 0.353 \tabularnewline
Residuals & 91 & 314.939 & 3.461 &   &   \tabularnewline
\hline
\end{tabular}
%Source: https://freestatistics.org/blog/index.php?pk=300806&T=2

[TABLE]
[ROW][C]ANOVA Statistics[/C][/ROW]
[ROW][C] [/C][C]Df[/C][C]Sum Sq[/C][C]Mean Sq[/C][C]F value[/C][C]Pr(>F)[/C][/ROW]
[ROW][C]A[/C][C]11[/C][C]42.75[/C][C]3.886[/C][C]1.123[/C][C]0.353[/C][/ROW]
[ROW][C]Residuals[/C][C]91[/C][C]314.939[/C][C]3.461[/C][C] [/C][C] [/C][/ROW]
[/TABLE]
Source: https://freestatistics.org/blog/index.php?pk=300806&T=2

Globally Unique Identifier (entire table): ba.freestatistics.org/blog/index.php?pk=300806&T=2

As an alternative you can also use a QR Code:  

The GUIDs for individual cells are displayed in the table below:

ANOVA Statistics
DfSum SqMean SqF valuePr(>F)
A1142.753.8861.1230.353
Residuals91314.9393.461


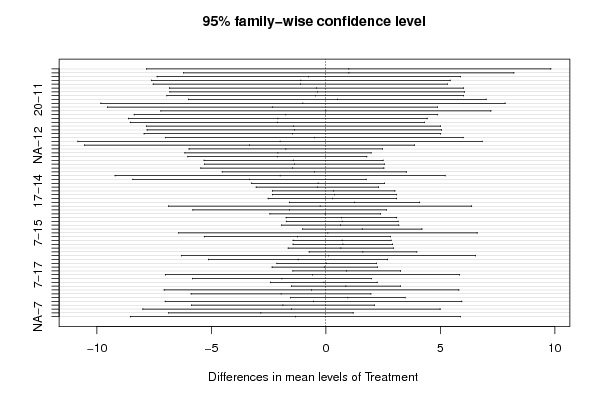
Tukey Honest Significant Difference Comparisons
difflwruprp adj
12-111-7.8269.8261
13-111-6.2068.2061
14-11-0.75-7.3695.8691
15-11-1.091-7.6095.4271
16-11-1.118-7.5395.3041
17-11-0.412-6.8346.011
18-11-0.375-6.8086.0581
19-11-0.462-6.9386.0151
20-110.5-5.9966.9961
7-11-1-9.8267.8261
NA-11-2.333-9.544.8730.995
13-120-7.2067.2061
14-12-1.75-8.3694.8690.999
15-12-2.091-8.6094.4270.995
16-12-2.118-8.5394.3040.994
17-12-1.412-7.8345.011
18-12-1.375-7.8085.0581
19-12-1.462-7.9385.0151
20-12-0.5-6.9965.9961
7-12-2-10.8266.8261
NA-12-3.333-10.543.8730.921
14-13-1.75-5.9752.4750.963
15-13-2.091-6.1561.9740.852
16-13-2.118-6.0261.7910.804
17-13-1.412-5.322.4960.987
18-13-1.375-5.3012.5510.99
19-13-1.462-5.4592.5360.985
20-13-0.5-4.5283.5281
7-13-2-9.2065.2060.999
NA-13-3.333-8.4291.7620.558
15-14-0.341-3.2412.5591
16-14-0.368-3.0432.3081
17-140.338-2.3383.0141
18-140.375-2.3273.0771
19-140.288-2.5163.0931
20-141.25-1.5994.0990.944
7-14-0.25-6.8696.3691
NA-14-1.583-5.8082.6420.982
16-15-0.027-2.4422.3881
17-150.679-1.7363.0940.998
18-150.716-1.7283.160.998
19-150.629-1.9273.1861
20-151.591-1.0144.1960.659
7-150.091-6.4276.6091
NA-15-1.242-5.3072.8220.997
17-160.706-1.4352.8460.994
18-160.743-1.4312.9160.992
19-160.656-1.6432.9550.998
20-161.618-0.7353.9710.48
7-160.118-6.3046.5391
NA-16-1.216-5.1242.6920.996
18-170.037-2.1372.2111
19-17-0.05-2.3492.251
20-170.912-1.4413.2650.977
7-17-0.588-7.015.8341
NA-17-1.922-5.831.9870.885
19-18-0.087-2.4172.2441
20-180.875-1.5083.2580.985
7-18-0.625-7.0585.8081
NA-18-1.958-5.8851.9680.875
20-190.962-1.5373.460.978
7-19-0.538-7.0155.9381
NA-19-1.872-5.8692.1260.915
7-20-1.5-7.9964.9961
NA-20-2.833-6.8621.1950.444
NA-7-1.333-8.545.8731

\begin{tabular}{lllllllll}
\hline
Tukey Honest Significant Difference Comparisons \tabularnewline
  & diff & lwr & upr & p adj \tabularnewline
12-11 & 1 & -7.826 & 9.826 & 1 \tabularnewline
13-11 & 1 & -6.206 & 8.206 & 1 \tabularnewline
14-11 & -0.75 & -7.369 & 5.869 & 1 \tabularnewline
15-11 & -1.091 & -7.609 & 5.427 & 1 \tabularnewline
16-11 & -1.118 & -7.539 & 5.304 & 1 \tabularnewline
17-11 & -0.412 & -6.834 & 6.01 & 1 \tabularnewline
18-11 & -0.375 & -6.808 & 6.058 & 1 \tabularnewline
19-11 & -0.462 & -6.938 & 6.015 & 1 \tabularnewline
20-11 & 0.5 & -5.996 & 6.996 & 1 \tabularnewline
7-11 & -1 & -9.826 & 7.826 & 1 \tabularnewline
NA-11 & -2.333 & -9.54 & 4.873 & 0.995 \tabularnewline
13-12 & 0 & -7.206 & 7.206 & 1 \tabularnewline
14-12 & -1.75 & -8.369 & 4.869 & 0.999 \tabularnewline
15-12 & -2.091 & -8.609 & 4.427 & 0.995 \tabularnewline
16-12 & -2.118 & -8.539 & 4.304 & 0.994 \tabularnewline
17-12 & -1.412 & -7.834 & 5.01 & 1 \tabularnewline
18-12 & -1.375 & -7.808 & 5.058 & 1 \tabularnewline
19-12 & -1.462 & -7.938 & 5.015 & 1 \tabularnewline
20-12 & -0.5 & -6.996 & 5.996 & 1 \tabularnewline
7-12 & -2 & -10.826 & 6.826 & 1 \tabularnewline
NA-12 & -3.333 & -10.54 & 3.873 & 0.921 \tabularnewline
14-13 & -1.75 & -5.975 & 2.475 & 0.963 \tabularnewline
15-13 & -2.091 & -6.156 & 1.974 & 0.852 \tabularnewline
16-13 & -2.118 & -6.026 & 1.791 & 0.804 \tabularnewline
17-13 & -1.412 & -5.32 & 2.496 & 0.987 \tabularnewline
18-13 & -1.375 & -5.301 & 2.551 & 0.99 \tabularnewline
19-13 & -1.462 & -5.459 & 2.536 & 0.985 \tabularnewline
20-13 & -0.5 & -4.528 & 3.528 & 1 \tabularnewline
7-13 & -2 & -9.206 & 5.206 & 0.999 \tabularnewline
NA-13 & -3.333 & -8.429 & 1.762 & 0.558 \tabularnewline
15-14 & -0.341 & -3.241 & 2.559 & 1 \tabularnewline
16-14 & -0.368 & -3.043 & 2.308 & 1 \tabularnewline
17-14 & 0.338 & -2.338 & 3.014 & 1 \tabularnewline
18-14 & 0.375 & -2.327 & 3.077 & 1 \tabularnewline
19-14 & 0.288 & -2.516 & 3.093 & 1 \tabularnewline
20-14 & 1.25 & -1.599 & 4.099 & 0.944 \tabularnewline
7-14 & -0.25 & -6.869 & 6.369 & 1 \tabularnewline
NA-14 & -1.583 & -5.808 & 2.642 & 0.982 \tabularnewline
16-15 & -0.027 & -2.442 & 2.388 & 1 \tabularnewline
17-15 & 0.679 & -1.736 & 3.094 & 0.998 \tabularnewline
18-15 & 0.716 & -1.728 & 3.16 & 0.998 \tabularnewline
19-15 & 0.629 & -1.927 & 3.186 & 1 \tabularnewline
20-15 & 1.591 & -1.014 & 4.196 & 0.659 \tabularnewline
7-15 & 0.091 & -6.427 & 6.609 & 1 \tabularnewline
NA-15 & -1.242 & -5.307 & 2.822 & 0.997 \tabularnewline
17-16 & 0.706 & -1.435 & 2.846 & 0.994 \tabularnewline
18-16 & 0.743 & -1.431 & 2.916 & 0.992 \tabularnewline
19-16 & 0.656 & -1.643 & 2.955 & 0.998 \tabularnewline
20-16 & 1.618 & -0.735 & 3.971 & 0.48 \tabularnewline
7-16 & 0.118 & -6.304 & 6.539 & 1 \tabularnewline
NA-16 & -1.216 & -5.124 & 2.692 & 0.996 \tabularnewline
18-17 & 0.037 & -2.137 & 2.211 & 1 \tabularnewline
19-17 & -0.05 & -2.349 & 2.25 & 1 \tabularnewline
20-17 & 0.912 & -1.441 & 3.265 & 0.977 \tabularnewline
7-17 & -0.588 & -7.01 & 5.834 & 1 \tabularnewline
NA-17 & -1.922 & -5.83 & 1.987 & 0.885 \tabularnewline
19-18 & -0.087 & -2.417 & 2.244 & 1 \tabularnewline
20-18 & 0.875 & -1.508 & 3.258 & 0.985 \tabularnewline
7-18 & -0.625 & -7.058 & 5.808 & 1 \tabularnewline
NA-18 & -1.958 & -5.885 & 1.968 & 0.875 \tabularnewline
20-19 & 0.962 & -1.537 & 3.46 & 0.978 \tabularnewline
7-19 & -0.538 & -7.015 & 5.938 & 1 \tabularnewline
NA-19 & -1.872 & -5.869 & 2.126 & 0.915 \tabularnewline
7-20 & -1.5 & -7.996 & 4.996 & 1 \tabularnewline
NA-20 & -2.833 & -6.862 & 1.195 & 0.444 \tabularnewline
NA-7 & -1.333 & -8.54 & 5.873 & 1 \tabularnewline
\hline
\end{tabular}
%Source: https://freestatistics.org/blog/index.php?pk=300806&T=3

[TABLE]
[ROW][C]Tukey Honest Significant Difference Comparisons[/C][/ROW]
[ROW][C] [/C][C]diff[/C][C]lwr[/C][C]upr[/C][C]p adj[/C][/ROW]
[ROW][C]12-11[/C][C]1[/C][C]-7.826[/C][C]9.826[/C][C]1[/C][/ROW]
[ROW][C]13-11[/C][C]1[/C][C]-6.206[/C][C]8.206[/C][C]1[/C][/ROW]
[ROW][C]14-11[/C][C]-0.75[/C][C]-7.369[/C][C]5.869[/C][C]1[/C][/ROW]
[ROW][C]15-11[/C][C]-1.091[/C][C]-7.609[/C][C]5.427[/C][C]1[/C][/ROW]
[ROW][C]16-11[/C][C]-1.118[/C][C]-7.539[/C][C]5.304[/C][C]1[/C][/ROW]
[ROW][C]17-11[/C][C]-0.412[/C][C]-6.834[/C][C]6.01[/C][C]1[/C][/ROW]
[ROW][C]18-11[/C][C]-0.375[/C][C]-6.808[/C][C]6.058[/C][C]1[/C][/ROW]
[ROW][C]19-11[/C][C]-0.462[/C][C]-6.938[/C][C]6.015[/C][C]1[/C][/ROW]
[ROW][C]20-11[/C][C]0.5[/C][C]-5.996[/C][C]6.996[/C][C]1[/C][/ROW]
[ROW][C]7-11[/C][C]-1[/C][C]-9.826[/C][C]7.826[/C][C]1[/C][/ROW]
[ROW][C]NA-11[/C][C]-2.333[/C][C]-9.54[/C][C]4.873[/C][C]0.995[/C][/ROW]
[ROW][C]13-12[/C][C]0[/C][C]-7.206[/C][C]7.206[/C][C]1[/C][/ROW]
[ROW][C]14-12[/C][C]-1.75[/C][C]-8.369[/C][C]4.869[/C][C]0.999[/C][/ROW]
[ROW][C]15-12[/C][C]-2.091[/C][C]-8.609[/C][C]4.427[/C][C]0.995[/C][/ROW]
[ROW][C]16-12[/C][C]-2.118[/C][C]-8.539[/C][C]4.304[/C][C]0.994[/C][/ROW]
[ROW][C]17-12[/C][C]-1.412[/C][C]-7.834[/C][C]5.01[/C][C]1[/C][/ROW]
[ROW][C]18-12[/C][C]-1.375[/C][C]-7.808[/C][C]5.058[/C][C]1[/C][/ROW]
[ROW][C]19-12[/C][C]-1.462[/C][C]-7.938[/C][C]5.015[/C][C]1[/C][/ROW]
[ROW][C]20-12[/C][C]-0.5[/C][C]-6.996[/C][C]5.996[/C][C]1[/C][/ROW]
[ROW][C]7-12[/C][C]-2[/C][C]-10.826[/C][C]6.826[/C][C]1[/C][/ROW]
[ROW][C]NA-12[/C][C]-3.333[/C][C]-10.54[/C][C]3.873[/C][C]0.921[/C][/ROW]
[ROW][C]14-13[/C][C]-1.75[/C][C]-5.975[/C][C]2.475[/C][C]0.963[/C][/ROW]
[ROW][C]15-13[/C][C]-2.091[/C][C]-6.156[/C][C]1.974[/C][C]0.852[/C][/ROW]
[ROW][C]16-13[/C][C]-2.118[/C][C]-6.026[/C][C]1.791[/C][C]0.804[/C][/ROW]
[ROW][C]17-13[/C][C]-1.412[/C][C]-5.32[/C][C]2.496[/C][C]0.987[/C][/ROW]
[ROW][C]18-13[/C][C]-1.375[/C][C]-5.301[/C][C]2.551[/C][C]0.99[/C][/ROW]
[ROW][C]19-13[/C][C]-1.462[/C][C]-5.459[/C][C]2.536[/C][C]0.985[/C][/ROW]
[ROW][C]20-13[/C][C]-0.5[/C][C]-4.528[/C][C]3.528[/C][C]1[/C][/ROW]
[ROW][C]7-13[/C][C]-2[/C][C]-9.206[/C][C]5.206[/C][C]0.999[/C][/ROW]
[ROW][C]NA-13[/C][C]-3.333[/C][C]-8.429[/C][C]1.762[/C][C]0.558[/C][/ROW]
[ROW][C]15-14[/C][C]-0.341[/C][C]-3.241[/C][C]2.559[/C][C]1[/C][/ROW]
[ROW][C]16-14[/C][C]-0.368[/C][C]-3.043[/C][C]2.308[/C][C]1[/C][/ROW]
[ROW][C]17-14[/C][C]0.338[/C][C]-2.338[/C][C]3.014[/C][C]1[/C][/ROW]
[ROW][C]18-14[/C][C]0.375[/C][C]-2.327[/C][C]3.077[/C][C]1[/C][/ROW]
[ROW][C]19-14[/C][C]0.288[/C][C]-2.516[/C][C]3.093[/C][C]1[/C][/ROW]
[ROW][C]20-14[/C][C]1.25[/C][C]-1.599[/C][C]4.099[/C][C]0.944[/C][/ROW]
[ROW][C]7-14[/C][C]-0.25[/C][C]-6.869[/C][C]6.369[/C][C]1[/C][/ROW]
[ROW][C]NA-14[/C][C]-1.583[/C][C]-5.808[/C][C]2.642[/C][C]0.982[/C][/ROW]
[ROW][C]16-15[/C][C]-0.027[/C][C]-2.442[/C][C]2.388[/C][C]1[/C][/ROW]
[ROW][C]17-15[/C][C]0.679[/C][C]-1.736[/C][C]3.094[/C][C]0.998[/C][/ROW]
[ROW][C]18-15[/C][C]0.716[/C][C]-1.728[/C][C]3.16[/C][C]0.998[/C][/ROW]
[ROW][C]19-15[/C][C]0.629[/C][C]-1.927[/C][C]3.186[/C][C]1[/C][/ROW]
[ROW][C]20-15[/C][C]1.591[/C][C]-1.014[/C][C]4.196[/C][C]0.659[/C][/ROW]
[ROW][C]7-15[/C][C]0.091[/C][C]-6.427[/C][C]6.609[/C][C]1[/C][/ROW]
[ROW][C]NA-15[/C][C]-1.242[/C][C]-5.307[/C][C]2.822[/C][C]0.997[/C][/ROW]
[ROW][C]17-16[/C][C]0.706[/C][C]-1.435[/C][C]2.846[/C][C]0.994[/C][/ROW]
[ROW][C]18-16[/C][C]0.743[/C][C]-1.431[/C][C]2.916[/C][C]0.992[/C][/ROW]
[ROW][C]19-16[/C][C]0.656[/C][C]-1.643[/C][C]2.955[/C][C]0.998[/C][/ROW]
[ROW][C]20-16[/C][C]1.618[/C][C]-0.735[/C][C]3.971[/C][C]0.48[/C][/ROW]
[ROW][C]7-16[/C][C]0.118[/C][C]-6.304[/C][C]6.539[/C][C]1[/C][/ROW]
[ROW][C]NA-16[/C][C]-1.216[/C][C]-5.124[/C][C]2.692[/C][C]0.996[/C][/ROW]
[ROW][C]18-17[/C][C]0.037[/C][C]-2.137[/C][C]2.211[/C][C]1[/C][/ROW]
[ROW][C]19-17[/C][C]-0.05[/C][C]-2.349[/C][C]2.25[/C][C]1[/C][/ROW]
[ROW][C]20-17[/C][C]0.912[/C][C]-1.441[/C][C]3.265[/C][C]0.977[/C][/ROW]
[ROW][C]7-17[/C][C]-0.588[/C][C]-7.01[/C][C]5.834[/C][C]1[/C][/ROW]
[ROW][C]NA-17[/C][C]-1.922[/C][C]-5.83[/C][C]1.987[/C][C]0.885[/C][/ROW]
[ROW][C]19-18[/C][C]-0.087[/C][C]-2.417[/C][C]2.244[/C][C]1[/C][/ROW]
[ROW][C]20-18[/C][C]0.875[/C][C]-1.508[/C][C]3.258[/C][C]0.985[/C][/ROW]
[ROW][C]7-18[/C][C]-0.625[/C][C]-7.058[/C][C]5.808[/C][C]1[/C][/ROW]
[ROW][C]NA-18[/C][C]-1.958[/C][C]-5.885[/C][C]1.968[/C][C]0.875[/C][/ROW]
[ROW][C]20-19[/C][C]0.962[/C][C]-1.537[/C][C]3.46[/C][C]0.978[/C][/ROW]
[ROW][C]7-19[/C][C]-0.538[/C][C]-7.015[/C][C]5.938[/C][C]1[/C][/ROW]
[ROW][C]NA-19[/C][C]-1.872[/C][C]-5.869[/C][C]2.126[/C][C]0.915[/C][/ROW]
[ROW][C]7-20[/C][C]-1.5[/C][C]-7.996[/C][C]4.996[/C][C]1[/C][/ROW]
[ROW][C]NA-20[/C][C]-2.833[/C][C]-6.862[/C][C]1.195[/C][C]0.444[/C][/ROW]
[ROW][C]NA-7[/C][C]-1.333[/C][C]-8.54[/C][C]5.873[/C][C]1[/C][/ROW]
[/TABLE]
Source: https://freestatistics.org/blog/index.php?pk=300806&T=3

Globally Unique Identifier (entire table): ba.freestatistics.org/blog/index.php?pk=300806&T=3

As an alternative you can also use a QR Code:  

The GUIDs for individual cells are displayed in the table below:

Tukey Honest Significant Difference Comparisons
difflwruprp adj
12-111-7.8269.8261
13-111-6.2068.2061
14-11-0.75-7.3695.8691
15-11-1.091-7.6095.4271
16-11-1.118-7.5395.3041
17-11-0.412-6.8346.011
18-11-0.375-6.8086.0581
19-11-0.462-6.9386.0151
20-110.5-5.9966.9961
7-11-1-9.8267.8261
NA-11-2.333-9.544.8730.995
13-120-7.2067.2061
14-12-1.75-8.3694.8690.999
15-12-2.091-8.6094.4270.995
16-12-2.118-8.5394.3040.994
17-12-1.412-7.8345.011
18-12-1.375-7.8085.0581
19-12-1.462-7.9385.0151
20-12-0.5-6.9965.9961
7-12-2-10.8266.8261
NA-12-3.333-10.543.8730.921
14-13-1.75-5.9752.4750.963
15-13-2.091-6.1561.9740.852
16-13-2.118-6.0261.7910.804
17-13-1.412-5.322.4960.987
18-13-1.375-5.3012.5510.99
19-13-1.462-5.4592.5360.985
20-13-0.5-4.5283.5281
7-13-2-9.2065.2060.999
NA-13-3.333-8.4291.7620.558
15-14-0.341-3.2412.5591
16-14-0.368-3.0432.3081
17-140.338-2.3383.0141
18-140.375-2.3273.0771
19-140.288-2.5163.0931
20-141.25-1.5994.0990.944
7-14-0.25-6.8696.3691
NA-14-1.583-5.8082.6420.982
16-15-0.027-2.4422.3881
17-150.679-1.7363.0940.998
18-150.716-1.7283.160.998
19-150.629-1.9273.1861
20-151.591-1.0144.1960.659
7-150.091-6.4276.6091
NA-15-1.242-5.3072.8220.997
17-160.706-1.4352.8460.994
18-160.743-1.4312.9160.992
19-160.656-1.6432.9550.998
20-161.618-0.7353.9710.48
7-160.118-6.3046.5391
NA-16-1.216-5.1242.6920.996
18-170.037-2.1372.2111
19-17-0.05-2.3492.251
20-170.912-1.4413.2650.977
7-17-0.588-7.015.8341
NA-17-1.922-5.831.9870.885
19-18-0.087-2.4172.2441
20-180.875-1.5083.2580.985
7-18-0.625-7.0585.8081
NA-18-1.958-5.8851.9680.875
20-190.962-1.5373.460.978
7-19-0.538-7.0155.9381
NA-19-1.872-5.8692.1260.915
7-20-1.5-7.9964.9961
NA-20-2.833-6.8621.1950.444
NA-7-1.333-8.545.8731


Levenes Test for Homogeneity of Variance
DfF valuePr(>F)
Group110.9370.509
91

\begin{tabular}{lllllllll}
\hline
Levenes Test for Homogeneity of Variance \tabularnewline
  & Df & F value & Pr(>F) \tabularnewline
Group & 11 & 0.937 & 0.509 \tabularnewline
  & 91 &   &   \tabularnewline
\hline
\end{tabular}
%Source: https://freestatistics.org/blog/index.php?pk=300806&T=4

[TABLE]
[ROW][C]Levenes Test for Homogeneity of Variance[/C][/ROW]
[ROW][C] [/C][C]Df[/C][C]F value[/C][C]Pr(>F)[/C][/ROW]
[ROW][C]Group[/C][C]11[/C][C]0.937[/C][C]0.509[/C][/ROW]
[ROW][C] [/C][C]91[/C][C] [/C][C] [/C][/ROW]
[/TABLE]
Source: https://freestatistics.org/blog/index.php?pk=300806&T=4

Globally Unique Identifier (entire table): ba.freestatistics.org/blog/index.php?pk=300806&T=4

As an alternative you can also use a QR Code:  

The GUIDs for individual cells are displayed in the table below:

Levenes Test for Homogeneity of Variance
DfF valuePr(>F)
Group110.9370.509
91


Parameters (Session):
par1 = 2 ; par2 = 1 ; par3 = TRUE ;
Parameters (R input):
par1 = 2 ; par2 = 1 ; par3 = TRUE ;
R code (references can be found in the software module):
par3 <- 'FALSE'
par2 <- '1'
par1 <- '2'
cat1 <- as.numeric(par1) #
cat2<- as.numeric(par2) #
intercept<-as.logical(par3)
x <- t(x)
x1<-as.numeric(x[,cat1])
f1<-as.character(x[,cat2])
xdf<-data.frame(x1,f1)
(V1<-dimnames(y)[[1]][cat1])
(V2<-dimnames(y)[[1]][cat2])
names(xdf)<-c('Response', 'Treatment')
if(intercept == FALSE) (lmxdf<-lm(Response ~ Treatment - 1, data = xdf) ) else (lmxdf<-lm(Response ~ Treatment, data = xdf) )
(aov.xdf<-aov(lmxdf) )
(anova.xdf<-anova(lmxdf) )
load(file='createtable')
a<-table.start()
a<-table.row.start(a)
a<-table.element(a,'ANOVA Model', length(lmxdf$coefficients)+1,TRUE)
a<-table.row.end(a)
a<-table.row.start(a)
a<-table.element(a, paste(V1, ' ~ ', V2), length(lmxdf$coefficients)+1,TRUE)
a<-table.row.end(a)
a<-table.row.start(a)
a<-table.element(a, 'means',,TRUE)
for(i in 1:length(lmxdf$coefficients)){
a<-table.element(a, round(lmxdf$coefficients[i], digits=3),,FALSE)
}
a<-table.row.end(a)
a<-table.end(a)
table.save(a,file='mytable.tab')
a<-table.start()
a<-table.row.start(a)
a<-table.element(a,'ANOVA Statistics', 5+1,TRUE)
a<-table.row.end(a)
a<-table.row.start(a)
a<-table.element(a, ' ',,TRUE)
a<-table.element(a, 'Df',,FALSE)
a<-table.element(a, 'Sum Sq',,FALSE)
a<-table.element(a, 'Mean Sq',,FALSE)
a<-table.element(a, 'F value',,FALSE)
a<-table.element(a, 'Pr(>F)',,FALSE)
a<-table.row.end(a)
a<-table.row.start(a)
a<-table.element(a, V2,,TRUE)
a<-table.element(a, anova.xdf$Df[1],,FALSE)
a<-table.element(a, round(anova.xdf$'Sum Sq'[1], digits=3),,FALSE)
a<-table.element(a, round(anova.xdf$'Mean Sq'[1], digits=3),,FALSE)
a<-table.element(a, round(anova.xdf$'F value'[1], digits=3),,FALSE)
a<-table.element(a, round(anova.xdf$'Pr(>F)'[1], digits=3),,FALSE)
a<-table.row.end(a)
a<-table.row.start(a)
a<-table.element(a, 'Residuals',,TRUE)
a<-table.element(a, anova.xdf$Df[2],,FALSE)
a<-table.element(a, round(anova.xdf$'Sum Sq'[2], digits=3),,FALSE)
a<-table.element(a, round(anova.xdf$'Mean Sq'[2], digits=3),,FALSE)
a<-table.element(a, ' ',,FALSE)
a<-table.row.end(a)
a<-table.end(a)
table.save(a,file='mytable1.tab')
bitmap(file='anovaplot.png')
boxplot(Response ~ Treatment, data=xdf, xlab=V2, ylab=V1)
dev.off()
if(intercept==TRUE){
'Tukey Plot'
thsd<-TukeyHSD(aov.xdf)
bitmap(file='TukeyHSDPlot.png')
plot(thsd)
dev.off()
}
if(intercept==TRUE){
a<-table.start()
a<-table.row.start(a)
a<-table.element(a,'Tukey Honest Significant Difference Comparisons', 5,TRUE)
a<-table.row.end(a)
a<-table.row.start(a)
a<-table.element(a, ' ', 1, TRUE)
for(i in 1:4){
a<-table.element(a,colnames(thsd[[1]])[i], 1, TRUE)
}
a<-table.row.end(a)
for(i in 1:length(rownames(thsd[[1]]))){
a<-table.row.start(a)
a<-table.element(a,rownames(thsd[[1]])[i], 1, TRUE)
for(j in 1:4){
a<-table.element(a,round(thsd[[1]][i,j], digits=3), 1, FALSE)
}
a<-table.row.end(a)
}
a<-table.end(a)
table.save(a,file='mytable2.tab')
}
if(intercept==FALSE){
a<-table.start()
a<-table.row.start(a)
a<-table.element(a,'TukeyHSD Message', 1,TRUE)
a<-table.row.end(a)
a<-table.start()
a<-table.row.start(a)
a<-table.element(a,'Must Include Intercept to use Tukey Test ', 1, FALSE)
a<-table.row.end(a)
a<-table.end(a)
table.save(a,file='mytable2.tab')
}
library(car)
lt.lmxdf<-leveneTest(lmxdf)
a<-table.start()
a<-table.row.start(a)
a<-table.element(a,'Levenes Test for Homogeneity of Variance', 4,TRUE)
a<-table.row.end(a)
a<-table.row.start(a)
a<-table.element(a,' ', 1, TRUE)
for (i in 1:3){
a<-table.element(a,names(lt.lmxdf)[i], 1, FALSE)
}
a<-table.row.end(a)
a<-table.row.start(a)
a<-table.element(a,'Group', 1, TRUE)
for (i in 1:3){
a<-table.element(a,round(lt.lmxdf[[i]][1], digits=3), 1, FALSE)
}
a<-table.row.end(a)
a<-table.row.start(a)
a<-table.element(a,' ', 1, TRUE)
a<-table.element(a,lt.lmxdf[[1]][2], 1, FALSE)
a<-table.element(a,' ', 1, FALSE)
a<-table.row.end(a)
a<-table.end(a)
table.save(a,file='mytable3.tab')