Free Statistics

of Irreproducible Research!

Author's title

Author*The author of this computation has been verified*
R Software Modulerwasp_smp.wasp
Title produced by softwareStandard Deviation-Mean Plot
Date of computationSat, 17 Dec 2016 12:55:34 +0100
Cite this page as followsStatistical Computations at FreeStatistics.org, Office for Research Development and Education, URL https://freestatistics.org/blog/index.php?v=date/2016/Dec/17/t1481975811n74q1kk730sgwg8.htm/, Retrieved Fri, 01 Nov 2024 03:36:20 +0000
Statistical Computations at FreeStatistics.org, Office for Research Development and Education, URL https://freestatistics.org/blog/index.php?pk=300736, Retrieved Fri, 01 Nov 2024 03:36:20 +0000
QR Codes:

Original text written by user:
IsPrivate?No (this computation is public)
User-defined keywords
Estimated Impact95
Family? (F = Feedback message, R = changed R code, M = changed R Module, P = changed Parameters, D = changed Data)
-       [Standard Deviation-Mean Plot] [] [2016-12-17 11:55:34] [349958aef20b862f8399a5ba04d6f6e3] [Current]
Feedback Forum

Post a new message
Dataseries X:
990
1384
1350
716
2068
1392
734
758
558
1620
3132
1392
918
776
1348
502
1274
1638
912
1250
1614
2840
1150
1652
1526
1412
882
848
820
1226
1212
2110
1178
2548
1568
2088
2178
3016
5514
1358
3604
1962
2036
2246
3434
4316
3032
5296
3850
2098
3992
4860
7336
9614
2988
2756
3540
2710
3730
3508
2640
2788
3502
3700
3250
4866
2836
3498
3468
3924
5738
7028
5608
6030
11976
7774
7906
10940
7626
5930
6286
6788
6932
6660
4910
4182
3550
3184
3872
3226
2504
3648
4448
2954
3842
3982
4864
6796
5844
5656
6118
7068
7696
7016
5820
4904
3860
7222
7738
7142
13804
7964
9716
8462
6884
8072
7320
11700
10792
10930
7112
8196
16818
10524
14878
13696


Summary of computational transaction
Raw Input view raw input (R code)
Raw Outputview raw output of R engine
Computing time1 seconds
R ServerBig Analytics Cloud Computing Center

\begin{tabular}{lllllllll}
\hline
Summary of computational transaction \tabularnewline
Raw Input view raw input (R code)  \tabularnewline
Raw Outputview raw output of R engine  \tabularnewline
Computing time1 seconds \tabularnewline
R ServerBig Analytics Cloud Computing Center \tabularnewline
\hline
\end{tabular}
%Source: https://freestatistics.org/blog/index.php?pk=300736&T=0

[TABLE]
[ROW]
Summary of computational transaction[/C][/ROW] [ROW]Raw Input[/C] view raw input (R code) [/C][/ROW] [ROW]Raw Output[/C]view raw output of R engine [/C][/ROW] [ROW]Computing time[/C]1 seconds[/C][/ROW] [ROW]R Server[/C]Big Analytics Cloud Computing Center[/C][/ROW] [/TABLE] Source: https://freestatistics.org/blog/index.php?pk=300736&T=0

Globally Unique Identifier (entire table): ba.freestatistics.org/blog/index.php?pk=300736&T=0

As an alternative you can also use a QR Code:  

The GUIDs for individual cells are displayed in the table below:

Summary of computational transaction
Raw Input view raw input (R code)
Raw Outputview raw output of R engine
Computing time1 seconds
R ServerBig Analytics Cloud Computing Center


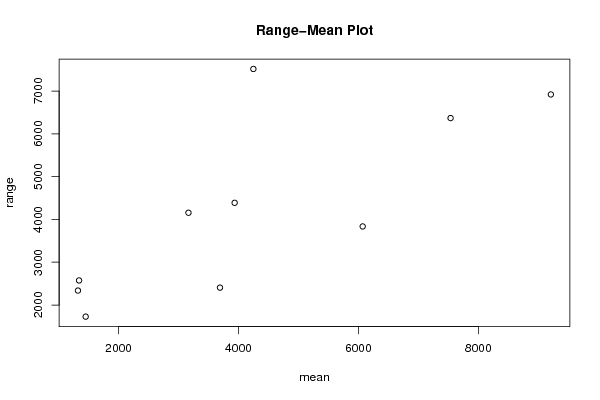
Standard Deviation-Mean Plot
SectionMeanStandard DeviationRange
11341.16666666667717.0923401085972574
21322.83333333333598.3246053216712338
31451.5550.3797862302991728
431661331.252042251954156
54248.52154.213144683527516
63936.51314.456161307794388
775381984.509648617156368
83691.83333333333666.5697581080642406
960721143.133492562523836
109210.333333333332171.194532272436920

\begin{tabular}{lllllllll}
\hline
Standard Deviation-Mean Plot \tabularnewline
Section & Mean & Standard Deviation & Range \tabularnewline
1 & 1341.16666666667 & 717.092340108597 & 2574 \tabularnewline
2 & 1322.83333333333 & 598.324605321671 & 2338 \tabularnewline
3 & 1451.5 & 550.379786230299 & 1728 \tabularnewline
4 & 3166 & 1331.25204225195 & 4156 \tabularnewline
5 & 4248.5 & 2154.21314468352 & 7516 \tabularnewline
6 & 3936.5 & 1314.45616130779 & 4388 \tabularnewline
7 & 7538 & 1984.50964861715 & 6368 \tabularnewline
8 & 3691.83333333333 & 666.569758108064 & 2406 \tabularnewline
9 & 6072 & 1143.13349256252 & 3836 \tabularnewline
10 & 9210.33333333333 & 2171.19453227243 & 6920 \tabularnewline
\hline
\end{tabular}
%Source: https://freestatistics.org/blog/index.php?pk=300736&T=1

[TABLE]
[ROW][C]Standard Deviation-Mean Plot[/C][/ROW]
[ROW][C]Section[/C][C]Mean[/C][C]Standard Deviation[/C][C]Range[/C][/ROW]
[ROW][C]1[/C][C]1341.16666666667[/C][C]717.092340108597[/C][C]2574[/C][/ROW]
[ROW][C]2[/C][C]1322.83333333333[/C][C]598.324605321671[/C][C]2338[/C][/ROW]
[ROW][C]3[/C][C]1451.5[/C][C]550.379786230299[/C][C]1728[/C][/ROW]
[ROW][C]4[/C][C]3166[/C][C]1331.25204225195[/C][C]4156[/C][/ROW]
[ROW][C]5[/C][C]4248.5[/C][C]2154.21314468352[/C][C]7516[/C][/ROW]
[ROW][C]6[/C][C]3936.5[/C][C]1314.45616130779[/C][C]4388[/C][/ROW]
[ROW][C]7[/C][C]7538[/C][C]1984.50964861715[/C][C]6368[/C][/ROW]
[ROW][C]8[/C][C]3691.83333333333[/C][C]666.569758108064[/C][C]2406[/C][/ROW]
[ROW][C]9[/C][C]6072[/C][C]1143.13349256252[/C][C]3836[/C][/ROW]
[ROW][C]10[/C][C]9210.33333333333[/C][C]2171.19453227243[/C][C]6920[/C][/ROW]
[/TABLE]
Source: https://freestatistics.org/blog/index.php?pk=300736&T=1

Globally Unique Identifier (entire table): ba.freestatistics.org/blog/index.php?pk=300736&T=1

As an alternative you can also use a QR Code:  

The GUIDs for individual cells are displayed in the table below:

Standard Deviation-Mean Plot
SectionMeanStandard DeviationRange
11341.16666666667717.0923401085972574
21322.83333333333598.3246053216712338
31451.5550.3797862302991728
431661331.252042251954156
54248.52154.213144683527516
63936.51314.456161307794388
775381984.509648617156368
83691.83333333333666.5697581080642406
960721143.133492562523836
109210.333333333332171.194532272436920


Regression: S.E.(k) = alpha + beta * Mean(k)
alpha462.368792008753
beta0.190750164957831
S.D.0.0517148737690699
T-STAT3.68849715866301
p-value0.00614348322701312

\begin{tabular}{lllllllll}
\hline
Regression: S.E.(k) = alpha + beta * Mean(k) \tabularnewline
alpha & 462.368792008753 \tabularnewline
beta & 0.190750164957831 \tabularnewline
S.D. & 0.0517148737690699 \tabularnewline
T-STAT & 3.68849715866301 \tabularnewline
p-value & 0.00614348322701312 \tabularnewline
\hline
\end{tabular}
%Source: https://freestatistics.org/blog/index.php?pk=300736&T=2

[TABLE]
[ROW][C]Regression: S.E.(k) = alpha + beta * Mean(k)[/C][/ROW]
[ROW][C]alpha[/C][C]462.368792008753[/C][/ROW]
[ROW][C]beta[/C][C]0.190750164957831[/C][/ROW]
[ROW][C]S.D.[/C][C]0.0517148737690699[/C][/ROW]
[ROW][C]T-STAT[/C][C]3.68849715866301[/C][/ROW]
[ROW][C]p-value[/C][C]0.00614348322701312[/C][/ROW]
[/TABLE]
Source: https://freestatistics.org/blog/index.php?pk=300736&T=2

Globally Unique Identifier (entire table): ba.freestatistics.org/blog/index.php?pk=300736&T=2

As an alternative you can also use a QR Code:  

The GUIDs for individual cells are displayed in the table below:

Regression: S.E.(k) = alpha + beta * Mean(k)
alpha462.368792008753
beta0.190750164957831
S.D.0.0517148737690699
T-STAT3.68849715866301
p-value0.00614348322701312


Regression: ln S.E.(k) = alpha + beta * ln Mean(k)
alpha1.8895094586504
beta0.630109419687828
S.D.0.150218689170845
T-STAT4.1946140201716
p-value0.00301865317400799
Lambda0.369890580312172

\begin{tabular}{lllllllll}
\hline
Regression: ln S.E.(k) = alpha + beta * ln Mean(k) \tabularnewline
alpha & 1.8895094586504 \tabularnewline
beta & 0.630109419687828 \tabularnewline
S.D. & 0.150218689170845 \tabularnewline
T-STAT & 4.1946140201716 \tabularnewline
p-value & 0.00301865317400799 \tabularnewline
Lambda & 0.369890580312172 \tabularnewline
\hline
\end{tabular}
%Source: https://freestatistics.org/blog/index.php?pk=300736&T=3

[TABLE]
[ROW][C]Regression: ln S.E.(k) = alpha + beta * ln Mean(k)[/C][/ROW]
[ROW][C]alpha[/C][C]1.8895094586504[/C][/ROW]
[ROW][C]beta[/C][C]0.630109419687828[/C][/ROW]
[ROW][C]S.D.[/C][C]0.150218689170845[/C][/ROW]
[ROW][C]T-STAT[/C][C]4.1946140201716[/C][/ROW]
[ROW][C]p-value[/C][C]0.00301865317400799[/C][/ROW]
[ROW][C]Lambda[/C][C]0.369890580312172[/C][/ROW]
[/TABLE]
Source: https://freestatistics.org/blog/index.php?pk=300736&T=3

Globally Unique Identifier (entire table): ba.freestatistics.org/blog/index.php?pk=300736&T=3

As an alternative you can also use a QR Code:  

The GUIDs for individual cells are displayed in the table below:

Regression: ln S.E.(k) = alpha + beta * ln Mean(k)
alpha1.8895094586504
beta0.630109419687828
S.D.0.150218689170845
T-STAT4.1946140201716
p-value0.00301865317400799
Lambda0.369890580312172


Parameters (Session):
par1 = 12 ;
Parameters (R input):
par1 = 12 ;
R code (references can be found in the software module):
par1 <- as.numeric(par1)
(n <- length(x))
(np <- floor(n / par1))
arr <- array(NA,dim=c(par1,np))
j <- 0
k <- 1
for (i in 1:(np*par1))
{
j = j + 1
arr[j,k] <- x[i]
if (j == par1) {
j = 0
k=k+1
}
}
arr
arr.mean <- array(NA,dim=np)
arr.sd <- array(NA,dim=np)
arr.range <- array(NA,dim=np)
for (j in 1:np)
{
arr.mean[j] <- mean(arr[,j],na.rm=TRUE)
arr.sd[j] <- sd(arr[,j],na.rm=TRUE)
arr.range[j] <- max(arr[,j],na.rm=TRUE) - min(arr[,j],na.rm=TRUE)
}
arr.mean
arr.sd
arr.range
(lm1 <- lm(arr.sd~arr.mean))
(lnlm1 <- lm(log(arr.sd)~log(arr.mean)))
(lm2 <- lm(arr.range~arr.mean))
bitmap(file='test1.png')
plot(arr.mean,arr.sd,main='Standard Deviation-Mean Plot',xlab='mean',ylab='standard deviation')
dev.off()
bitmap(file='test2.png')
plot(arr.mean,arr.range,main='Range-Mean Plot',xlab='mean',ylab='range')
dev.off()
load(file='createtable')
a<-table.start()
a<-table.row.start(a)
a<-table.element(a,'Standard Deviation-Mean Plot',4,TRUE)
a<-table.row.end(a)
a<-table.row.start(a)
a<-table.element(a,'Section',header=TRUE)
a<-table.element(a,'Mean',header=TRUE)
a<-table.element(a,'Standard Deviation',header=TRUE)
a<-table.element(a,'Range',header=TRUE)
a<-table.row.end(a)
for (j in 1:np) {
a<-table.row.start(a)
a<-table.element(a,j,header=TRUE)
a<-table.element(a,arr.mean[j])
a<-table.element(a,arr.sd[j] )
a<-table.element(a,arr.range[j] )
a<-table.row.end(a)
}
a<-table.end(a)
table.save(a,file='mytable.tab')
a<-table.start()
a<-table.row.start(a)
a<-table.element(a,'Regression: S.E.(k) = alpha + beta * Mean(k)',2,TRUE)
a<-table.row.end(a)
a<-table.row.start(a)
a<-table.element(a,'alpha',header=TRUE)
a<-table.element(a,lm1$coefficients[[1]])
a<-table.row.end(a)
a<-table.row.start(a)
a<-table.element(a,'beta',header=TRUE)
a<-table.element(a,lm1$coefficients[[2]])
a<-table.row.end(a)
a<-table.row.start(a)
a<-table.element(a,'S.D.',header=TRUE)
a<-table.element(a,summary(lm1)$coefficients[2,2])
a<-table.row.end(a)
a<-table.row.start(a)
a<-table.element(a,'T-STAT',header=TRUE)
a<-table.element(a,summary(lm1)$coefficients[2,3])
a<-table.row.end(a)
a<-table.row.start(a)
a<-table.element(a,'p-value',header=TRUE)
a<-table.element(a,summary(lm1)$coefficients[2,4])
a<-table.row.end(a)
a<-table.end(a)
table.save(a,file='mytable1.tab')
a<-table.start()
a<-table.row.start(a)
a<-table.element(a,'Regression: ln S.E.(k) = alpha + beta * ln Mean(k)',2,TRUE)
a<-table.row.end(a)
a<-table.row.start(a)
a<-table.element(a,'alpha',header=TRUE)
a<-table.element(a,lnlm1$coefficients[[1]])
a<-table.row.end(a)
a<-table.row.start(a)
a<-table.element(a,'beta',header=TRUE)
a<-table.element(a,lnlm1$coefficients[[2]])
a<-table.row.end(a)
a<-table.row.start(a)
a<-table.element(a,'S.D.',header=TRUE)
a<-table.element(a,summary(lnlm1)$coefficients[2,2])
a<-table.row.end(a)
a<-table.row.start(a)
a<-table.element(a,'T-STAT',header=TRUE)
a<-table.element(a,summary(lnlm1)$coefficients[2,3])
a<-table.row.end(a)
a<-table.row.start(a)
a<-table.element(a,'p-value',header=TRUE)
a<-table.element(a,summary(lnlm1)$coefficients[2,4])
a<-table.row.end(a)
a<-table.row.start(a)
a<-table.element(a,'Lambda',header=TRUE)
a<-table.element(a,1-lnlm1$coefficients[[2]])
a<-table.row.end(a)
a<-table.end(a)
table.save(a,file='mytable2.tab')