Free Statistics

of Irreproducible Research!

Author's title

Author*The author of this computation has been verified*
R Software Modulerwasp_structuraltimeseries.wasp
Title produced by softwareStructural Time Series Models
Date of computationSat, 17 Dec 2016 11:05:30 +0100
Cite this page as followsStatistical Computations at FreeStatistics.org, Office for Research Development and Education, URL https://freestatistics.org/blog/index.php?v=date/2016/Dec/17/t1481969571v7jixadwa8h098u.htm/, Retrieved Fri, 01 Nov 2024 03:48:01 +0000
Statistical Computations at FreeStatistics.org, Office for Research Development and Education, URL https://freestatistics.org/blog/index.php?pk=300665, Retrieved Fri, 01 Nov 2024 03:48:01 +0000
QR Codes:

Original text written by user:
IsPrivate?No (this computation is public)
User-defined keywords
Estimated Impact80
Family? (F = Feedback message, R = changed R code, M = changed R Module, P = changed Parameters, D = changed Data)
-       [Structural Time Series Models] [strucutural time ...] [2016-12-17 10:05:30] [0fbc99f8be9cad246c7cf6558103ab95] [Current]
Feedback Forum

Post a new message
Dataseries X:
5929.07
6332.38
6043.28
6127.9
6262.29
6416.96
5999.64
6424.27
5769.61
5623.18
5357.77
5265
4900.33
4529.55
4130.8
4225.07
4181.2
4189.48
3988.72
3863.11
3719.97
3591.07
3391.82
3031.74
2650.98
2409.32


Summary of computational transaction
Raw Input view raw input (R code)
Raw Outputview raw output of R engine
Computing time3 seconds
R ServerBig Analytics Cloud Computing Center

\begin{tabular}{lllllllll}
\hline
Summary of computational transaction \tabularnewline
Raw Input view raw input (R code)  \tabularnewline
Raw Outputview raw output of R engine  \tabularnewline
Computing time3 seconds \tabularnewline
R ServerBig Analytics Cloud Computing Center \tabularnewline
\hline
\end{tabular}
%Source: https://freestatistics.org/blog/index.php?pk=300665&T=0

[TABLE]
[ROW]
Summary of computational transaction[/C][/ROW] [ROW]Raw Input[/C] view raw input (R code) [/C][/ROW] [ROW]Raw Output[/C]view raw output of R engine [/C][/ROW] [ROW]Computing time[/C]3 seconds[/C][/ROW] [ROW]R Server[/C]Big Analytics Cloud Computing Center[/C][/ROW] [/TABLE] Source: https://freestatistics.org/blog/index.php?pk=300665&T=0

Globally Unique Identifier (entire table): ba.freestatistics.org/blog/index.php?pk=300665&T=0

As an alternative you can also use a QR Code:  

The GUIDs for individual cells are displayed in the table below:

Summary of computational transaction
Raw Input view raw input (R code)
Raw Outputview raw output of R engine
Computing time3 seconds
R ServerBig Analytics Cloud Computing Center


Structural Time Series Model -- Interpolation
tObservedLevelSlopeSeasonalStand. Residuals
15929.075929.07000
26332.386237.8548669460132.634708515832319.30977999149051.42875303068112
36043.286095.946531647113.4174116671053615.5316129779933-1.06364380015449
46127.96108.821550962165.4848990743030615.58843636462890.0552641903501368
56262.296212.6469137570129.796054657091315.68137868882560.55006645060725
66416.966361.6782345777760.974296648214115.6245350478240.651057890316846
75999.646091.80926595908-27.795469084143615.8634924621676-1.78572597920202
86424.276324.2980886969842.8793397412915.69906287182251.39751099127911
95769.615903.30398551028-83.775199650311615.9210054280325-2.4848294940294
105623.185658.91864302297-127.74143999690415.9759012167142-0.859478203650441
115357.775387.86955265018-167.01923139180516.0099466617822-0.766567210990069
1252655242.14426700935-161.17956570262416.00647831758650.11388487688989
134900.335078.57400570108-161.8004656202-177.518320219638-0.0149281148677409
144529.554596.23391429473-246.2361606721797.67316551137728-1.42066879152686
154130.84178.68278699877-292.7295345070696.4986034192742-0.911169115958692
164225.074137.5250502847-223.7314147234516.608984404691231.34594763481404
174181.24111.39621169321-169.475184937826.370189879825761.05510506184626
184189.484124.70102385877-119.3154190458326.122141510940770.975713435150575
193988.723988.12169516275-124.0512878862786.14133232658022-0.0921952666003996
203863.113858.69203133627-125.5265256872916.14574913032151-0.028734991445441
213719.973718.52179488501-129.5432651240756.15424398121124-0.0782626407694626
223591.073585.90311672708-130.3869069344696.15547724685933-0.0164401099640174
233391.823402.64749170118-144.8908770207046.16997258232446-0.282660380097656
243031.743082.03747585137-193.1006687373176.20272481840333-0.939567485971431
252650.982783.9078356789-221.181994403498-100.133022956772-0.612015268673032
262409.322435.72223123043-255.0874297511656.86722742822992-0.603178403892985

\begin{tabular}{lllllllll}
\hline
Structural Time Series Model -- Interpolation \tabularnewline
t & Observed & Level & Slope & Seasonal & Stand. Residuals \tabularnewline
1 & 5929.07 & 5929.07 & 0 & 0 & 0 \tabularnewline
2 & 6332.38 & 6237.85486694601 & 32.6347085158323 & 19.3097799914905 & 1.42875303068112 \tabularnewline
3 & 6043.28 & 6095.94653164711 & 3.41741166710536 & 15.5316129779933 & -1.06364380015449 \tabularnewline
4 & 6127.9 & 6108.82155096216 & 5.48489907430306 & 15.5884363646289 & 0.0552641903501368 \tabularnewline
5 & 6262.29 & 6212.64691375701 & 29.7960546570913 & 15.6813786888256 & 0.55006645060725 \tabularnewline
6 & 6416.96 & 6361.67823457777 & 60.9742966482141 & 15.624535047824 & 0.651057890316846 \tabularnewline
7 & 5999.64 & 6091.80926595908 & -27.7954690841436 & 15.8634924621676 & -1.78572597920202 \tabularnewline
8 & 6424.27 & 6324.29808869698 & 42.87933974129 & 15.6990628718225 & 1.39751099127911 \tabularnewline
9 & 5769.61 & 5903.30398551028 & -83.7751996503116 & 15.9210054280325 & -2.4848294940294 \tabularnewline
10 & 5623.18 & 5658.91864302297 & -127.741439996904 & 15.9759012167142 & -0.859478203650441 \tabularnewline
11 & 5357.77 & 5387.86955265018 & -167.019231391805 & 16.0099466617822 & -0.766567210990069 \tabularnewline
12 & 5265 & 5242.14426700935 & -161.179565702624 & 16.0064783175865 & 0.11388487688989 \tabularnewline
13 & 4900.33 & 5078.57400570108 & -161.8004656202 & -177.518320219638 & -0.0149281148677409 \tabularnewline
14 & 4529.55 & 4596.23391429473 & -246.236160672179 & 7.67316551137728 & -1.42066879152686 \tabularnewline
15 & 4130.8 & 4178.68278699877 & -292.729534507069 & 6.4986034192742 & -0.911169115958692 \tabularnewline
16 & 4225.07 & 4137.5250502847 & -223.731414723451 & 6.60898440469123 & 1.34594763481404 \tabularnewline
17 & 4181.2 & 4111.39621169321 & -169.47518493782 & 6.37018987982576 & 1.05510506184626 \tabularnewline
18 & 4189.48 & 4124.70102385877 & -119.315419045832 & 6.12214151094077 & 0.975713435150575 \tabularnewline
19 & 3988.72 & 3988.12169516275 & -124.051287886278 & 6.14133232658022 & -0.0921952666003996 \tabularnewline
20 & 3863.11 & 3858.69203133627 & -125.526525687291 & 6.14574913032151 & -0.028734991445441 \tabularnewline
21 & 3719.97 & 3718.52179488501 & -129.543265124075 & 6.15424398121124 & -0.0782626407694626 \tabularnewline
22 & 3591.07 & 3585.90311672708 & -130.386906934469 & 6.15547724685933 & -0.0164401099640174 \tabularnewline
23 & 3391.82 & 3402.64749170118 & -144.890877020704 & 6.16997258232446 & -0.282660380097656 \tabularnewline
24 & 3031.74 & 3082.03747585137 & -193.100668737317 & 6.20272481840333 & -0.939567485971431 \tabularnewline
25 & 2650.98 & 2783.9078356789 & -221.181994403498 & -100.133022956772 & -0.612015268673032 \tabularnewline
26 & 2409.32 & 2435.72223123043 & -255.087429751165 & 6.86722742822992 & -0.603178403892985 \tabularnewline
\hline
\end{tabular}
%Source: https://freestatistics.org/blog/index.php?pk=300665&T=1

[TABLE]
[ROW][C]Structural Time Series Model -- Interpolation[/C][/ROW]
[ROW][C]t[/C][C]Observed[/C][C]Level[/C][C]Slope[/C][C]Seasonal[/C][C]Stand. Residuals[/C][/ROW]
[ROW][C]1[/C][C]5929.07[/C][C]5929.07[/C][C]0[/C][C]0[/C][C]0[/C][/ROW]
[ROW][C]2[/C][C]6332.38[/C][C]6237.85486694601[/C][C]32.6347085158323[/C][C]19.3097799914905[/C][C]1.42875303068112[/C][/ROW]
[ROW][C]3[/C][C]6043.28[/C][C]6095.94653164711[/C][C]3.41741166710536[/C][C]15.5316129779933[/C][C]-1.06364380015449[/C][/ROW]
[ROW][C]4[/C][C]6127.9[/C][C]6108.82155096216[/C][C]5.48489907430306[/C][C]15.5884363646289[/C][C]0.0552641903501368[/C][/ROW]
[ROW][C]5[/C][C]6262.29[/C][C]6212.64691375701[/C][C]29.7960546570913[/C][C]15.6813786888256[/C][C]0.55006645060725[/C][/ROW]
[ROW][C]6[/C][C]6416.96[/C][C]6361.67823457777[/C][C]60.9742966482141[/C][C]15.624535047824[/C][C]0.651057890316846[/C][/ROW]
[ROW][C]7[/C][C]5999.64[/C][C]6091.80926595908[/C][C]-27.7954690841436[/C][C]15.8634924621676[/C][C]-1.78572597920202[/C][/ROW]
[ROW][C]8[/C][C]6424.27[/C][C]6324.29808869698[/C][C]42.87933974129[/C][C]15.6990628718225[/C][C]1.39751099127911[/C][/ROW]
[ROW][C]9[/C][C]5769.61[/C][C]5903.30398551028[/C][C]-83.7751996503116[/C][C]15.9210054280325[/C][C]-2.4848294940294[/C][/ROW]
[ROW][C]10[/C][C]5623.18[/C][C]5658.91864302297[/C][C]-127.741439996904[/C][C]15.9759012167142[/C][C]-0.859478203650441[/C][/ROW]
[ROW][C]11[/C][C]5357.77[/C][C]5387.86955265018[/C][C]-167.019231391805[/C][C]16.0099466617822[/C][C]-0.766567210990069[/C][/ROW]
[ROW][C]12[/C][C]5265[/C][C]5242.14426700935[/C][C]-161.179565702624[/C][C]16.0064783175865[/C][C]0.11388487688989[/C][/ROW]
[ROW][C]13[/C][C]4900.33[/C][C]5078.57400570108[/C][C]-161.8004656202[/C][C]-177.518320219638[/C][C]-0.0149281148677409[/C][/ROW]
[ROW][C]14[/C][C]4529.55[/C][C]4596.23391429473[/C][C]-246.236160672179[/C][C]7.67316551137728[/C][C]-1.42066879152686[/C][/ROW]
[ROW][C]15[/C][C]4130.8[/C][C]4178.68278699877[/C][C]-292.729534507069[/C][C]6.4986034192742[/C][C]-0.911169115958692[/C][/ROW]
[ROW][C]16[/C][C]4225.07[/C][C]4137.5250502847[/C][C]-223.731414723451[/C][C]6.60898440469123[/C][C]1.34594763481404[/C][/ROW]
[ROW][C]17[/C][C]4181.2[/C][C]4111.39621169321[/C][C]-169.47518493782[/C][C]6.37018987982576[/C][C]1.05510506184626[/C][/ROW]
[ROW][C]18[/C][C]4189.48[/C][C]4124.70102385877[/C][C]-119.315419045832[/C][C]6.12214151094077[/C][C]0.975713435150575[/C][/ROW]
[ROW][C]19[/C][C]3988.72[/C][C]3988.12169516275[/C][C]-124.051287886278[/C][C]6.14133232658022[/C][C]-0.0921952666003996[/C][/ROW]
[ROW][C]20[/C][C]3863.11[/C][C]3858.69203133627[/C][C]-125.526525687291[/C][C]6.14574913032151[/C][C]-0.028734991445441[/C][/ROW]
[ROW][C]21[/C][C]3719.97[/C][C]3718.52179488501[/C][C]-129.543265124075[/C][C]6.15424398121124[/C][C]-0.0782626407694626[/C][/ROW]
[ROW][C]22[/C][C]3591.07[/C][C]3585.90311672708[/C][C]-130.386906934469[/C][C]6.15547724685933[/C][C]-0.0164401099640174[/C][/ROW]
[ROW][C]23[/C][C]3391.82[/C][C]3402.64749170118[/C][C]-144.890877020704[/C][C]6.16997258232446[/C][C]-0.282660380097656[/C][/ROW]
[ROW][C]24[/C][C]3031.74[/C][C]3082.03747585137[/C][C]-193.100668737317[/C][C]6.20272481840333[/C][C]-0.939567485971431[/C][/ROW]
[ROW][C]25[/C][C]2650.98[/C][C]2783.9078356789[/C][C]-221.181994403498[/C][C]-100.133022956772[/C][C]-0.612015268673032[/C][/ROW]
[ROW][C]26[/C][C]2409.32[/C][C]2435.72223123043[/C][C]-255.087429751165[/C][C]6.86722742822992[/C][C]-0.603178403892985[/C][/ROW]
[/TABLE]
Source: https://freestatistics.org/blog/index.php?pk=300665&T=1

Globally Unique Identifier (entire table): ba.freestatistics.org/blog/index.php?pk=300665&T=1

As an alternative you can also use a QR Code:  

The GUIDs for individual cells are displayed in the table below:

Structural Time Series Model -- Interpolation
tObservedLevelSlopeSeasonalStand. Residuals
15929.075929.07000
26332.386237.8548669460132.634708515832319.30977999149051.42875303068112
36043.286095.946531647113.4174116671053615.5316129779933-1.06364380015449
46127.96108.821550962165.4848990743030615.58843636462890.0552641903501368
56262.296212.6469137570129.796054657091315.68137868882560.55006645060725
66416.966361.6782345777760.974296648214115.6245350478240.651057890316846
75999.646091.80926595908-27.795469084143615.8634924621676-1.78572597920202
86424.276324.2980886969842.8793397412915.69906287182251.39751099127911
95769.615903.30398551028-83.775199650311615.9210054280325-2.4848294940294
105623.185658.91864302297-127.74143999690415.9759012167142-0.859478203650441
115357.775387.86955265018-167.01923139180516.0099466617822-0.766567210990069
1252655242.14426700935-161.17956570262416.00647831758650.11388487688989
134900.335078.57400570108-161.8004656202-177.518320219638-0.0149281148677409
144529.554596.23391429473-246.2361606721797.67316551137728-1.42066879152686
154130.84178.68278699877-292.7295345070696.4986034192742-0.911169115958692
164225.074137.5250502847-223.7314147234516.608984404691231.34594763481404
174181.24111.39621169321-169.475184937826.370189879825761.05510506184626
184189.484124.70102385877-119.3154190458326.122141510940770.975713435150575
193988.723988.12169516275-124.0512878862786.14133232658022-0.0921952666003996
203863.113858.69203133627-125.5265256872916.14574913032151-0.028734991445441
213719.973718.52179488501-129.5432651240756.15424398121124-0.0782626407694626
223591.073585.90311672708-130.3869069344696.15547724685933-0.0164401099640174
233391.823402.64749170118-144.8908770207046.16997258232446-0.282660380097656
243031.743082.03747585137-193.1006687373176.20272481840333-0.939567485971431
252650.982783.9078356789-221.181994403498-100.133022956772-0.612015268673032
262409.322435.72223123043-255.0874297511656.86722742822992-0.603178403892985


Structural Time Series Model -- Extrapolation
tObservedLevelSeasonal
12023.821991986132398.78141246335-374.959420477217
22027.476912222472196.72396374266-169.247051520184
31994.982740402821994.666515021970.31622538085449
42006.739574879441792.60906630128214.130508578156
51636.017810404171590.5516175805945.4661928235755
61731.881913926771388.4941688599343.387745066865
71287.372616694741186.43672013921100.935896555531
81112.13432845168984.379271418525127.75505703316
9850.267232407374782.32182269783667.9454097095385
10602.34120474816580.26437397714722.0768307710132
11157.083336320758378.206925256458-221.1235889357
1219.4656715501762176.14947653577-156.683804985593

\begin{tabular}{lllllllll}
\hline
Structural Time Series Model -- Extrapolation \tabularnewline
t & Observed & Level & Seasonal \tabularnewline
1 & 2023.82199198613 & 2398.78141246335 & -374.959420477217 \tabularnewline
2 & 2027.47691222247 & 2196.72396374266 & -169.247051520184 \tabularnewline
3 & 1994.98274040282 & 1994.66651502197 & 0.31622538085449 \tabularnewline
4 & 2006.73957487944 & 1792.60906630128 & 214.130508578156 \tabularnewline
5 & 1636.01781040417 & 1590.55161758059 & 45.4661928235755 \tabularnewline
6 & 1731.88191392677 & 1388.4941688599 & 343.387745066865 \tabularnewline
7 & 1287.37261669474 & 1186.43672013921 & 100.935896555531 \tabularnewline
8 & 1112.13432845168 & 984.379271418525 & 127.75505703316 \tabularnewline
9 & 850.267232407374 & 782.321822697836 & 67.9454097095385 \tabularnewline
10 & 602.34120474816 & 580.264373977147 & 22.0768307710132 \tabularnewline
11 & 157.083336320758 & 378.206925256458 & -221.1235889357 \tabularnewline
12 & 19.4656715501762 & 176.14947653577 & -156.683804985593 \tabularnewline
\hline
\end{tabular}
%Source: https://freestatistics.org/blog/index.php?pk=300665&T=2

[TABLE]
[ROW][C]Structural Time Series Model -- Extrapolation[/C][/ROW]
[ROW][C]t[/C][C]Observed[/C][C]Level[/C][C]Seasonal[/C][/ROW]
[ROW][C]1[/C][C]2023.82199198613[/C][C]2398.78141246335[/C][C]-374.959420477217[/C][/ROW]
[ROW][C]2[/C][C]2027.47691222247[/C][C]2196.72396374266[/C][C]-169.247051520184[/C][/ROW]
[ROW][C]3[/C][C]1994.98274040282[/C][C]1994.66651502197[/C][C]0.31622538085449[/C][/ROW]
[ROW][C]4[/C][C]2006.73957487944[/C][C]1792.60906630128[/C][C]214.130508578156[/C][/ROW]
[ROW][C]5[/C][C]1636.01781040417[/C][C]1590.55161758059[/C][C]45.4661928235755[/C][/ROW]
[ROW][C]6[/C][C]1731.88191392677[/C][C]1388.4941688599[/C][C]343.387745066865[/C][/ROW]
[ROW][C]7[/C][C]1287.37261669474[/C][C]1186.43672013921[/C][C]100.935896555531[/C][/ROW]
[ROW][C]8[/C][C]1112.13432845168[/C][C]984.379271418525[/C][C]127.75505703316[/C][/ROW]
[ROW][C]9[/C][C]850.267232407374[/C][C]782.321822697836[/C][C]67.9454097095385[/C][/ROW]
[ROW][C]10[/C][C]602.34120474816[/C][C]580.264373977147[/C][C]22.0768307710132[/C][/ROW]
[ROW][C]11[/C][C]157.083336320758[/C][C]378.206925256458[/C][C]-221.1235889357[/C][/ROW]
[ROW][C]12[/C][C]19.4656715501762[/C][C]176.14947653577[/C][C]-156.683804985593[/C][/ROW]
[/TABLE]
Source: https://freestatistics.org/blog/index.php?pk=300665&T=2

Globally Unique Identifier (entire table): ba.freestatistics.org/blog/index.php?pk=300665&T=2

As an alternative you can also use a QR Code:  

The GUIDs for individual cells are displayed in the table below:

Structural Time Series Model -- Extrapolation
tObservedLevelSeasonal
12023.821991986132398.78141246335-374.959420477217
22027.476912222472196.72396374266-169.247051520184
31994.982740402821994.666515021970.31622538085449
42006.739574879441792.60906630128214.130508578156
51636.017810404171590.5516175805945.4661928235755
61731.881913926771388.4941688599343.387745066865
71287.372616694741186.43672013921100.935896555531
81112.13432845168984.379271418525127.75505703316
9850.267232407374782.32182269783667.9454097095385
10602.34120474816580.26437397714722.0768307710132
11157.083336320758378.206925256458-221.1235889357
1219.4656715501762176.14947653577-156.683804985593


Parameters (Session):
par1 = TRUE ;
Parameters (R input):
par1 = 12 ; par2 = 12 ; par3 = BFGS ;
R code (references can be found in the software module):
require('stsm')
require('stsm.class')
require('KFKSDS')
par1 <- as.numeric(par1)
par2 <- as.numeric(par2)
nx <- length(x)
x <- ts(x,frequency=par1)
m <- StructTS(x,type='BSM')
print(m$coef)
print(m$fitted)
print(m$resid)
mylevel <- as.numeric(m$fitted[,'level'])
myslope <- as.numeric(m$fitted[,'slope'])
myseas <- as.numeric(m$fitted[,'sea'])
myresid <- as.numeric(m$resid)
myfit <- mylevel+myseas
mm <- stsm.model(model = 'BSM', y = x, transPars = 'StructTS')
fit2 <- stsmFit(mm, stsm.method = 'maxlik.td.optim', method = par3, KF.args = list(P0cov = TRUE))
(fit2.comps <- tsSmooth(fit2, P0cov = FALSE)$states)
m2 <- set.pars(mm, pmax(fit2$par, .Machine$double.eps))
(ss <- char2numeric(m2))
(pred <- predict(ss, x, n.ahead = par2))
mylagmax <- nx/2
bitmap(file='test2.png')
op <- par(mfrow = c(2,2))
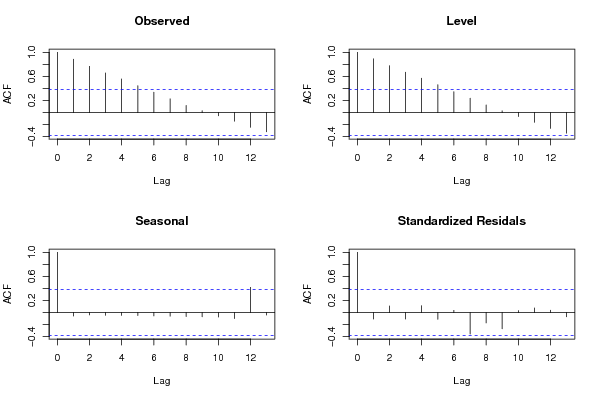
acf(as.numeric(x),lag.max = mylagmax,main='Observed')
acf(mylevel,na.action=na.pass,lag.max = mylagmax,main='Level')
acf(myseas,na.action=na.pass,lag.max = mylagmax,main='Seasonal')
acf(myresid,na.action=na.pass,lag.max = mylagmax,main='Standardized Residals')
par(op)
dev.off()
bitmap(file='test3.png')
op <- par(mfrow = c(2,2))
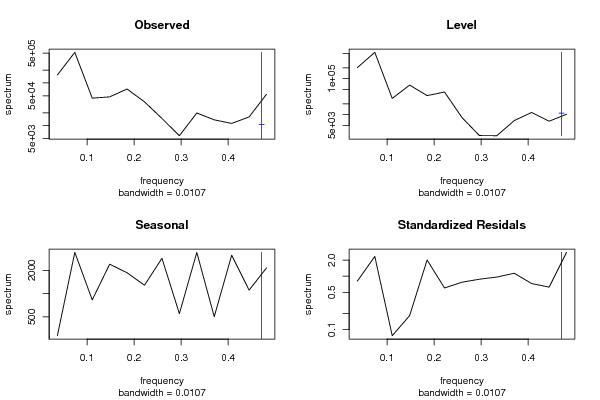
spectrum(as.numeric(x),main='Observed')
spectrum(mylevel,main='Level')
spectrum(myseas,main='Seasonal')
spectrum(myresid,main='Standardized Residals')
par(op)
dev.off()
bitmap(file='test4.png')
op <- par(mfrow = c(2,2))
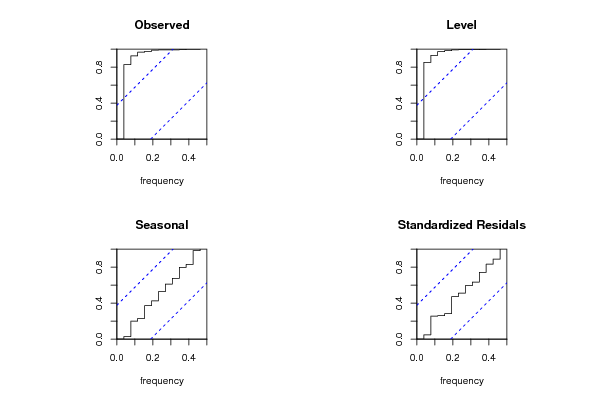
cpgram(as.numeric(x),main='Observed')
cpgram(mylevel,main='Level')
cpgram(myseas,main='Seasonal')
cpgram(myresid,main='Standardized Residals')
par(op)
dev.off()
bitmap(file='test1.png')
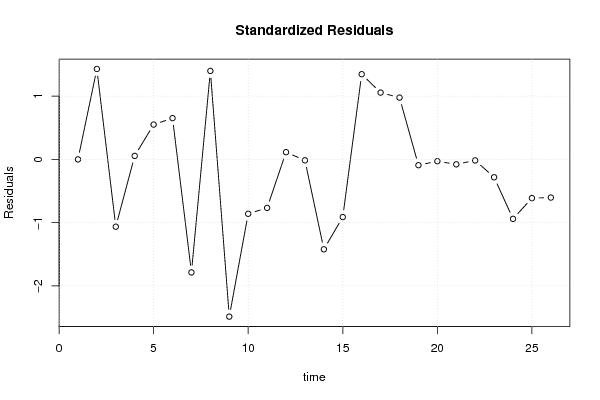
plot(as.numeric(m$resid),main='Standardized Residuals',ylab='Residuals',xlab='time',type='b')
grid()
dev.off()
bitmap(file='test5.png')
op <- par(mfrow = c(2,2))
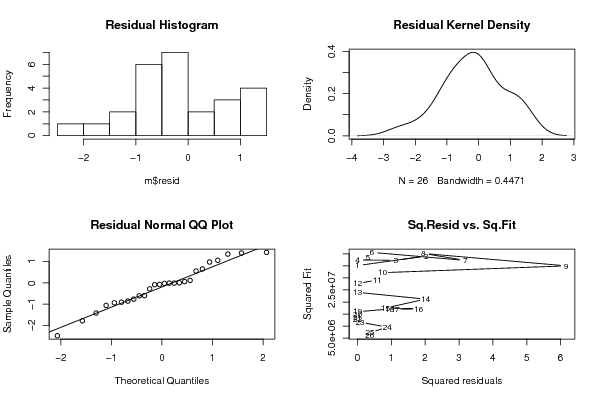
hist(m$resid,main='Residual Histogram')
plot(density(m$resid),main='Residual Kernel Density')
qqnorm(m$resid,main='Residual Normal QQ Plot')
qqline(m$resid)
plot(m$resid^2, myfit^2,main='Sq.Resid vs. Sq.Fit',xlab='Squared residuals',ylab='Squared Fit')
par(op)
dev.off()
bitmap(file='test6.png')
par(mfrow = c(3,1), mar = c(3,3,3,3))
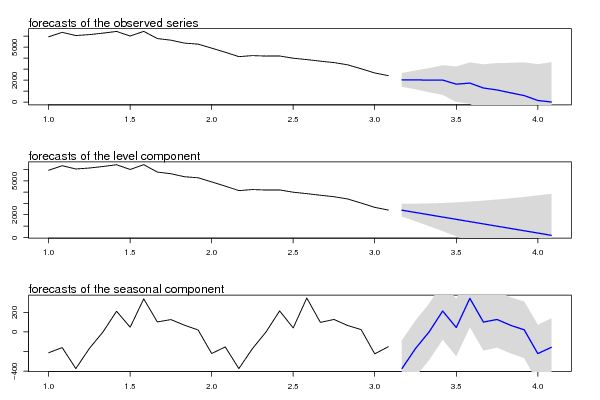
plot(cbind(x, pred$pred), type = 'n', plot.type = 'single', ylab = '')
lines(x)
polygon(c(time(pred$pred), rev(time(pred$pred))), c(pred$pred + 2 * pred$se, rev(pred$pred)), col = 'gray85', border = NA)
polygon(c(time(pred$pred), rev(time(pred$pred))), c(pred$pred - 2 * pred$se, rev(pred$pred)), col = ' gray85', border = NA)
lines(pred$pred, col = 'blue', lwd = 1.5)
mtext(text = 'forecasts of the observed series', side = 3, adj = 0)
plot(cbind(x, pred$a[,1]), type = 'n', plot.type = 'single', ylab = '')
lines(x)
polygon(c(time(pred$a[,1]), rev(time(pred$a[,1]))), c(pred$a[,1] + 2 * sqrt(pred$P[,1]), rev(pred$a[,1])), col = 'gray85', border = NA)
polygon(c(time(pred$a[,1]), rev(time(pred$a[,1]))), c(pred$a[,1] - 2 * sqrt(pred$P[,1]), rev(pred$a[,1])), col = ' gray85', border = NA)
lines(pred$a[,1], col = 'blue', lwd = 1.5)
mtext(text = 'forecasts of the level component', side = 3, adj = 0)
plot(cbind(fit2.comps[,3], pred$a[,3]), type = 'n', plot.type = 'single', ylab = '')
lines(fit2.comps[,3])
polygon(c(time(pred$a[,3]), rev(time(pred$a[,3]))), c(pred$a[,3] + 2 * sqrt(pred$P[,3]), rev(pred$a[,3])), col = 'gray85', border = NA)
polygon(c(time(pred$a[,3]), rev(time(pred$a[,3]))), c(pred$a[,3] - 2 * sqrt(pred$P[,3]), rev(pred$a[,3])), col = ' gray85', border = NA)
lines(pred$a[,3], col = 'blue', lwd = 1.5)
mtext(text = 'forecasts of the seasonal component', side = 3, adj = 0)
dev.off()
load(file='createtable')
a<-table.start()
a<-table.row.start(a)
a<-table.element(a,'Structural Time Series Model -- Interpolation',6,TRUE)
a<-table.row.end(a)
a<-table.row.start(a)
a<-table.element(a,'t',header=TRUE)
a<-table.element(a,'Observed',header=TRUE)
a<-table.element(a,'Level',header=TRUE)
a<-table.element(a,'Slope',header=TRUE)
a<-table.element(a,'Seasonal',header=TRUE)
a<-table.element(a,'Stand. Residuals',header=TRUE)
a<-table.row.end(a)
for (i in 1:nx) {
a<-table.row.start(a)
a<-table.element(a,i,header=TRUE)
a<-table.element(a,x[i])
a<-table.element(a,mylevel[i])
a<-table.element(a,myslope[i])
a<-table.element(a,myseas[i])
a<-table.element(a,myresid[i])
a<-table.row.end(a)
}
a<-table.end(a)
table.save(a,file='mytable.tab')
a<-table.start()
a<-table.row.start(a)
a<-table.element(a,'Structural Time Series Model -- Extrapolation',4,TRUE)
a<-table.row.end(a)
a<-table.row.start(a)
a<-table.element(a,'t',header=TRUE)
a<-table.element(a,'Observed',header=TRUE)
a<-table.element(a,'Level',header=TRUE)
a<-table.element(a,'Seasonal',header=TRUE)
a<-table.row.end(a)
for (i in 1:par2) {
a<-table.row.start(a)
a<-table.element(a,i,header=TRUE)
a<-table.element(a,pred$pred[i])
a<-table.element(a,pred$a[i,1])
a<-table.element(a,pred$a[i,3])
a<-table.row.end(a)
}
a<-table.end(a)
table.save(a,file='mytable1.tab')