Free Statistics

of Irreproducible Research!

Author's title

Author*The author of this computation has been verified*
R Software Modulerwasp_structuraltimeseries.wasp
Title produced by softwareStructural Time Series Models
Date of computationSat, 17 Dec 2016 10:57:52 +0100
Cite this page as followsStatistical Computations at FreeStatistics.org, Office for Research Development and Education, URL https://freestatistics.org/blog/index.php?v=date/2016/Dec/17/t1481968717e26st8w1imqzsm3.htm/, Retrieved Fri, 01 Nov 2024 03:37:43 +0000
Statistical Computations at FreeStatistics.org, Office for Research Development and Education, URL https://freestatistics.org/blog/index.php?pk=300660, Retrieved Fri, 01 Nov 2024 03:37:43 +0000
QR Codes:

Original text written by user:
IsPrivate?No (this computation is public)
User-defined keywords
Estimated Impact87
Family? (F = Feedback message, R = changed R code, M = changed R Module, P = changed Parameters, D = changed Data)
-       [Structural Time Series Models] [] [2016-12-17 09:57:52] [57f1f1af0ba442a9c0352eeef9ded060] [Current]
Feedback Forum

Post a new message
Dataseries X:
4304
4380
4465
4528
4557.5
4557.5
4588.5
4627.5
4711
4776.5
4781.5
4603
4770.5
4792
4803.5
4747.5
4838
4854
4902.5
4953.5
4969.5
4971
4998.5
5080
5111
5110.5
5096
4939.5
5108
5137.5
5185.5
5103
5168
5208
5250.5
5204.5
5293.5
5339.5
5484
5533
5513
5595.5
5605
5919.5


Summary of computational transaction
Raw Input view raw input (R code)
Raw Outputview raw output of R engine
Computing time3 seconds
R ServerBig Analytics Cloud Computing Center

\begin{tabular}{lllllllll}
\hline
Summary of computational transaction \tabularnewline
Raw Input view raw input (R code)  \tabularnewline
Raw Outputview raw output of R engine  \tabularnewline
Computing time3 seconds \tabularnewline
R ServerBig Analytics Cloud Computing Center \tabularnewline
\hline
\end{tabular}
%Source: https://freestatistics.org/blog/index.php?pk=300660&T=0

[TABLE]
[ROW]
Summary of computational transaction[/C][/ROW] [ROW]Raw Input[/C] view raw input (R code) [/C][/ROW] [ROW]Raw Output[/C]view raw output of R engine [/C][/ROW] [ROW]Computing time[/C]3 seconds[/C][/ROW] [ROW]R Server[/C]Big Analytics Cloud Computing Center[/C][/ROW] [/TABLE] Source: https://freestatistics.org/blog/index.php?pk=300660&T=0

Globally Unique Identifier (entire table): ba.freestatistics.org/blog/index.php?pk=300660&T=0

As an alternative you can also use a QR Code:  

The GUIDs for individual cells are displayed in the table below:

Summary of computational transaction
Raw Input view raw input (R code)
Raw Outputview raw output of R engine
Computing time3 seconds
R ServerBig Analytics Cloud Computing Center


Structural Time Series Model -- Interpolation
tObservedLevelSlopeSeasonalStand. Residuals
143044304000
243804361.297936092564.283429578089093.730265530262160.76209555700766
344654429.940306548728.464886442353995.580180741276511.19992851620577
445284494.8562872515312.74362570978326.389771849648181.07111716775768
54557.54537.1374328773415.43063648663366.650615752548260.55183773624181
64557.54551.3902218517615.3071150967226.64303970623667-0.0216288757238051
74588.54577.1648718605416.52256655173086.696839237456350.18944744477695
84627.54612.5187892602318.87127116067116.777318224357420.336966105567748
947114682.1920328265725.53219568585856.960384760123490.90121894425167
104776.54750.9828110439931.40574400160247.092278976128130.762459238926899
114781.54776.7898841835130.62675713764767.07783953739201-0.0982099071830473
1246034658.779887172639.588727625411066.75399033759811-2.59820160791112
134770.54752.2219483033819.9141522273268-15.29822836660241.73885089813536
1447924785.8995627641221.93290745281351.770294972272090.202063201035316
154803.54803.5260034292121.30697657027521.7296173478436-0.0739510495173874
164747.54769.1175227721213.18708632599361.56932183604365-0.967324111592967
1748384820.5119099910318.7708043646811.594198714532220.662649708837814
1848544848.5543085196520.12858880860871.59356649460780.160632654531484
194902.54891.457106157423.4688331794461.587373814621280.394361905963767
204953.54941.0699668083327.30756266565331.579441584103950.452600545156826
214969.54968.0545049577627.26009491722731.57953238795251-0.00559143017397442
2249714977.0103069477924.56876132371681.58402312829017-0.316818887182729
234998.54998.2827881605324.08389733080051.58471315112723-0.0570514239410493
2450805061.9863614510429.91347928602741.577700452405230.685717584897032
2551115112.5642276132332.8725737924476-9.839478359027950.392404492922627
265110.55119.245663261729.04477077551520.423571930538951-0.409509030480171
2750965111.0558878969523.58239656275830.207994170793271-0.640857042253241
284939.54996.729239722463.292845385555460.00158511600877576-2.38881887741273
2951085076.3321672896314.52857891688040.007887445030035191.32094583271741
305137.55123.8311054536619.3835717166805-0.003322607497734870.570458680285191
315185.55173.1175719284723.7867011544617-0.01613422585280710.517324682682028
3251035130.5159531033314.01160234828570.011070302707621-1.14855194011764
3351685161.1162210623216.45407869874050.00507077527086850.287009197539619
3452085199.0812110481119.6212700749609-0.001595896739914290.372194621691957
355250.55241.1840358494822.9313850502882-0.007497227898804770.389010883400207
365204.55221.9752571927216.72674089407920.00182729506172894-0.729209198917488
375293.55271.9153903389221.54518414980188.14458255344350.613236108045015
385339.55327.3608958320126.5014689241022-0.2829608903452890.544617916358895
3954845445.9975855900340.02708615562950.112576217027951.58818143288692
4055335519.1191665976744.89738145422730.148423177204360.573129717105319
4155135527.8544919109439.57225404815960.147354216346154-0.625927984898631
425595.55587.17051212642.4798612996520.1417849131455310.341625496462164
4356055612.1209521643739.89848602854320.147815849337722-0.303286599160125
445919.55841.0346188042767.73134269307290.08612005895192143.27033551620156

\begin{tabular}{lllllllll}
\hline
Structural Time Series Model -- Interpolation \tabularnewline
t & Observed & Level & Slope & Seasonal & Stand. Residuals \tabularnewline
1 & 4304 & 4304 & 0 & 0 & 0 \tabularnewline
2 & 4380 & 4361.29793609256 & 4.28342957808909 & 3.73026553026216 & 0.76209555700766 \tabularnewline
3 & 4465 & 4429.94030654872 & 8.46488644235399 & 5.58018074127651 & 1.19992851620577 \tabularnewline
4 & 4528 & 4494.85628725153 & 12.7436257097832 & 6.38977184964818 & 1.07111716775768 \tabularnewline
5 & 4557.5 & 4537.13743287734 & 15.4306364866336 & 6.65061575254826 & 0.55183773624181 \tabularnewline
6 & 4557.5 & 4551.39022185176 & 15.307115096722 & 6.64303970623667 & -0.0216288757238051 \tabularnewline
7 & 4588.5 & 4577.16487186054 & 16.5225665517308 & 6.69683923745635 & 0.18944744477695 \tabularnewline
8 & 4627.5 & 4612.51878926023 & 18.8712711606711 & 6.77731822435742 & 0.336966105567748 \tabularnewline
9 & 4711 & 4682.19203282657 & 25.5321956858585 & 6.96038476012349 & 0.90121894425167 \tabularnewline
10 & 4776.5 & 4750.98281104399 & 31.4057440016024 & 7.09227897612813 & 0.762459238926899 \tabularnewline
11 & 4781.5 & 4776.78988418351 & 30.6267571376476 & 7.07783953739201 & -0.0982099071830473 \tabularnewline
12 & 4603 & 4658.77988717263 & 9.58872762541106 & 6.75399033759811 & -2.59820160791112 \tabularnewline
13 & 4770.5 & 4752.22194830338 & 19.9141522273268 & -15.2982283666024 & 1.73885089813536 \tabularnewline
14 & 4792 & 4785.89956276412 & 21.9329074528135 & 1.77029497227209 & 0.202063201035316 \tabularnewline
15 & 4803.5 & 4803.52600342921 & 21.3069765702752 & 1.7296173478436 & -0.0739510495173874 \tabularnewline
16 & 4747.5 & 4769.11752277212 & 13.1870863259936 & 1.56932183604365 & -0.967324111592967 \tabularnewline
17 & 4838 & 4820.51190999103 & 18.770804364681 & 1.59419871453222 & 0.662649708837814 \tabularnewline
18 & 4854 & 4848.55430851965 & 20.1285888086087 & 1.5935664946078 & 0.160632654531484 \tabularnewline
19 & 4902.5 & 4891.4571061574 & 23.468833179446 & 1.58737381462128 & 0.394361905963767 \tabularnewline
20 & 4953.5 & 4941.06996680833 & 27.3075626656533 & 1.57944158410395 & 0.452600545156826 \tabularnewline
21 & 4969.5 & 4968.05450495776 & 27.2600949172273 & 1.57953238795251 & -0.00559143017397442 \tabularnewline
22 & 4971 & 4977.01030694779 & 24.5687613237168 & 1.58402312829017 & -0.316818887182729 \tabularnewline
23 & 4998.5 & 4998.28278816053 & 24.0838973308005 & 1.58471315112723 & -0.0570514239410493 \tabularnewline
24 & 5080 & 5061.98636145104 & 29.9134792860274 & 1.57770045240523 & 0.685717584897032 \tabularnewline
25 & 5111 & 5112.56422761323 & 32.8725737924476 & -9.83947835902795 & 0.392404492922627 \tabularnewline
26 & 5110.5 & 5119.2456632617 & 29.0447707755152 & 0.423571930538951 & -0.409509030480171 \tabularnewline
27 & 5096 & 5111.05588789695 & 23.5823965627583 & 0.207994170793271 & -0.640857042253241 \tabularnewline
28 & 4939.5 & 4996.72923972246 & 3.29284538555546 & 0.00158511600877576 & -2.38881887741273 \tabularnewline
29 & 5108 & 5076.33216728963 & 14.5285789168804 & 0.00788744503003519 & 1.32094583271741 \tabularnewline
30 & 5137.5 & 5123.83110545366 & 19.3835717166805 & -0.00332260749773487 & 0.570458680285191 \tabularnewline
31 & 5185.5 & 5173.11757192847 & 23.7867011544617 & -0.0161342258528071 & 0.517324682682028 \tabularnewline
32 & 5103 & 5130.51595310333 & 14.0116023482857 & 0.011070302707621 & -1.14855194011764 \tabularnewline
33 & 5168 & 5161.11622106232 & 16.4540786987405 & 0.0050707752708685 & 0.287009197539619 \tabularnewline
34 & 5208 & 5199.08121104811 & 19.6212700749609 & -0.00159589673991429 & 0.372194621691957 \tabularnewline
35 & 5250.5 & 5241.18403584948 & 22.9313850502882 & -0.00749722789880477 & 0.389010883400207 \tabularnewline
36 & 5204.5 & 5221.97525719272 & 16.7267408940792 & 0.00182729506172894 & -0.729209198917488 \tabularnewline
37 & 5293.5 & 5271.91539033892 & 21.5451841498018 & 8.1445825534435 & 0.613236108045015 \tabularnewline
38 & 5339.5 & 5327.36089583201 & 26.5014689241022 & -0.282960890345289 & 0.544617916358895 \tabularnewline
39 & 5484 & 5445.99758559003 & 40.0270861556295 & 0.11257621702795 & 1.58818143288692 \tabularnewline
40 & 5533 & 5519.11916659767 & 44.8973814542273 & 0.14842317720436 & 0.573129717105319 \tabularnewline
41 & 5513 & 5527.85449191094 & 39.5722540481596 & 0.147354216346154 & -0.625927984898631 \tabularnewline
42 & 5595.5 & 5587.170512126 & 42.479861299652 & 0.141784913145531 & 0.341625496462164 \tabularnewline
43 & 5605 & 5612.12095216437 & 39.8984860285432 & 0.147815849337722 & -0.303286599160125 \tabularnewline
44 & 5919.5 & 5841.03461880427 & 67.7313426930729 & 0.0861200589519214 & 3.27033551620156 \tabularnewline
\hline
\end{tabular}
%Source: https://freestatistics.org/blog/index.php?pk=300660&T=1

[TABLE]
[ROW][C]Structural Time Series Model -- Interpolation[/C][/ROW]
[ROW][C]t[/C][C]Observed[/C][C]Level[/C][C]Slope[/C][C]Seasonal[/C][C]Stand. Residuals[/C][/ROW]
[ROW][C]1[/C][C]4304[/C][C]4304[/C][C]0[/C][C]0[/C][C]0[/C][/ROW]
[ROW][C]2[/C][C]4380[/C][C]4361.29793609256[/C][C]4.28342957808909[/C][C]3.73026553026216[/C][C]0.76209555700766[/C][/ROW]
[ROW][C]3[/C][C]4465[/C][C]4429.94030654872[/C][C]8.46488644235399[/C][C]5.58018074127651[/C][C]1.19992851620577[/C][/ROW]
[ROW][C]4[/C][C]4528[/C][C]4494.85628725153[/C][C]12.7436257097832[/C][C]6.38977184964818[/C][C]1.07111716775768[/C][/ROW]
[ROW][C]5[/C][C]4557.5[/C][C]4537.13743287734[/C][C]15.4306364866336[/C][C]6.65061575254826[/C][C]0.55183773624181[/C][/ROW]
[ROW][C]6[/C][C]4557.5[/C][C]4551.39022185176[/C][C]15.307115096722[/C][C]6.64303970623667[/C][C]-0.0216288757238051[/C][/ROW]
[ROW][C]7[/C][C]4588.5[/C][C]4577.16487186054[/C][C]16.5225665517308[/C][C]6.69683923745635[/C][C]0.18944744477695[/C][/ROW]
[ROW][C]8[/C][C]4627.5[/C][C]4612.51878926023[/C][C]18.8712711606711[/C][C]6.77731822435742[/C][C]0.336966105567748[/C][/ROW]
[ROW][C]9[/C][C]4711[/C][C]4682.19203282657[/C][C]25.5321956858585[/C][C]6.96038476012349[/C][C]0.90121894425167[/C][/ROW]
[ROW][C]10[/C][C]4776.5[/C][C]4750.98281104399[/C][C]31.4057440016024[/C][C]7.09227897612813[/C][C]0.762459238926899[/C][/ROW]
[ROW][C]11[/C][C]4781.5[/C][C]4776.78988418351[/C][C]30.6267571376476[/C][C]7.07783953739201[/C][C]-0.0982099071830473[/C][/ROW]
[ROW][C]12[/C][C]4603[/C][C]4658.77988717263[/C][C]9.58872762541106[/C][C]6.75399033759811[/C][C]-2.59820160791112[/C][/ROW]
[ROW][C]13[/C][C]4770.5[/C][C]4752.22194830338[/C][C]19.9141522273268[/C][C]-15.2982283666024[/C][C]1.73885089813536[/C][/ROW]
[ROW][C]14[/C][C]4792[/C][C]4785.89956276412[/C][C]21.9329074528135[/C][C]1.77029497227209[/C][C]0.202063201035316[/C][/ROW]
[ROW][C]15[/C][C]4803.5[/C][C]4803.52600342921[/C][C]21.3069765702752[/C][C]1.7296173478436[/C][C]-0.0739510495173874[/C][/ROW]
[ROW][C]16[/C][C]4747.5[/C][C]4769.11752277212[/C][C]13.1870863259936[/C][C]1.56932183604365[/C][C]-0.967324111592967[/C][/ROW]
[ROW][C]17[/C][C]4838[/C][C]4820.51190999103[/C][C]18.770804364681[/C][C]1.59419871453222[/C][C]0.662649708837814[/C][/ROW]
[ROW][C]18[/C][C]4854[/C][C]4848.55430851965[/C][C]20.1285888086087[/C][C]1.5935664946078[/C][C]0.160632654531484[/C][/ROW]
[ROW][C]19[/C][C]4902.5[/C][C]4891.4571061574[/C][C]23.468833179446[/C][C]1.58737381462128[/C][C]0.394361905963767[/C][/ROW]
[ROW][C]20[/C][C]4953.5[/C][C]4941.06996680833[/C][C]27.3075626656533[/C][C]1.57944158410395[/C][C]0.452600545156826[/C][/ROW]
[ROW][C]21[/C][C]4969.5[/C][C]4968.05450495776[/C][C]27.2600949172273[/C][C]1.57953238795251[/C][C]-0.00559143017397442[/C][/ROW]
[ROW][C]22[/C][C]4971[/C][C]4977.01030694779[/C][C]24.5687613237168[/C][C]1.58402312829017[/C][C]-0.316818887182729[/C][/ROW]
[ROW][C]23[/C][C]4998.5[/C][C]4998.28278816053[/C][C]24.0838973308005[/C][C]1.58471315112723[/C][C]-0.0570514239410493[/C][/ROW]
[ROW][C]24[/C][C]5080[/C][C]5061.98636145104[/C][C]29.9134792860274[/C][C]1.57770045240523[/C][C]0.685717584897032[/C][/ROW]
[ROW][C]25[/C][C]5111[/C][C]5112.56422761323[/C][C]32.8725737924476[/C][C]-9.83947835902795[/C][C]0.392404492922627[/C][/ROW]
[ROW][C]26[/C][C]5110.5[/C][C]5119.2456632617[/C][C]29.0447707755152[/C][C]0.423571930538951[/C][C]-0.409509030480171[/C][/ROW]
[ROW][C]27[/C][C]5096[/C][C]5111.05588789695[/C][C]23.5823965627583[/C][C]0.207994170793271[/C][C]-0.640857042253241[/C][/ROW]
[ROW][C]28[/C][C]4939.5[/C][C]4996.72923972246[/C][C]3.29284538555546[/C][C]0.00158511600877576[/C][C]-2.38881887741273[/C][/ROW]
[ROW][C]29[/C][C]5108[/C][C]5076.33216728963[/C][C]14.5285789168804[/C][C]0.00788744503003519[/C][C]1.32094583271741[/C][/ROW]
[ROW][C]30[/C][C]5137.5[/C][C]5123.83110545366[/C][C]19.3835717166805[/C][C]-0.00332260749773487[/C][C]0.570458680285191[/C][/ROW]
[ROW][C]31[/C][C]5185.5[/C][C]5173.11757192847[/C][C]23.7867011544617[/C][C]-0.0161342258528071[/C][C]0.517324682682028[/C][/ROW]
[ROW][C]32[/C][C]5103[/C][C]5130.51595310333[/C][C]14.0116023482857[/C][C]0.011070302707621[/C][C]-1.14855194011764[/C][/ROW]
[ROW][C]33[/C][C]5168[/C][C]5161.11622106232[/C][C]16.4540786987405[/C][C]0.0050707752708685[/C][C]0.287009197539619[/C][/ROW]
[ROW][C]34[/C][C]5208[/C][C]5199.08121104811[/C][C]19.6212700749609[/C][C]-0.00159589673991429[/C][C]0.372194621691957[/C][/ROW]
[ROW][C]35[/C][C]5250.5[/C][C]5241.18403584948[/C][C]22.9313850502882[/C][C]-0.00749722789880477[/C][C]0.389010883400207[/C][/ROW]
[ROW][C]36[/C][C]5204.5[/C][C]5221.97525719272[/C][C]16.7267408940792[/C][C]0.00182729506172894[/C][C]-0.729209198917488[/C][/ROW]
[ROW][C]37[/C][C]5293.5[/C][C]5271.91539033892[/C][C]21.5451841498018[/C][C]8.1445825534435[/C][C]0.613236108045015[/C][/ROW]
[ROW][C]38[/C][C]5339.5[/C][C]5327.36089583201[/C][C]26.5014689241022[/C][C]-0.282960890345289[/C][C]0.544617916358895[/C][/ROW]
[ROW][C]39[/C][C]5484[/C][C]5445.99758559003[/C][C]40.0270861556295[/C][C]0.11257621702795[/C][C]1.58818143288692[/C][/ROW]
[ROW][C]40[/C][C]5533[/C][C]5519.11916659767[/C][C]44.8973814542273[/C][C]0.14842317720436[/C][C]0.573129717105319[/C][/ROW]
[ROW][C]41[/C][C]5513[/C][C]5527.85449191094[/C][C]39.5722540481596[/C][C]0.147354216346154[/C][C]-0.625927984898631[/C][/ROW]
[ROW][C]42[/C][C]5595.5[/C][C]5587.170512126[/C][C]42.479861299652[/C][C]0.141784913145531[/C][C]0.341625496462164[/C][/ROW]
[ROW][C]43[/C][C]5605[/C][C]5612.12095216437[/C][C]39.8984860285432[/C][C]0.147815849337722[/C][C]-0.303286599160125[/C][/ROW]
[ROW][C]44[/C][C]5919.5[/C][C]5841.03461880427[/C][C]67.7313426930729[/C][C]0.0861200589519214[/C][C]3.27033551620156[/C][/ROW]
[/TABLE]
Source: https://freestatistics.org/blog/index.php?pk=300660&T=1

Globally Unique Identifier (entire table): ba.freestatistics.org/blog/index.php?pk=300660&T=1

As an alternative you can also use a QR Code:  

The GUIDs for individual cells are displayed in the table below:

Structural Time Series Model -- Interpolation
tObservedLevelSlopeSeasonalStand. Residuals
143044304000
243804361.297936092564.283429578089093.730265530262160.76209555700766
344654429.940306548728.464886442353995.580180741276511.19992851620577
445284494.8562872515312.74362570978326.389771849648181.07111716775768
54557.54537.1374328773415.43063648663366.650615752548260.55183773624181
64557.54551.3902218517615.3071150967226.64303970623667-0.0216288757238051
74588.54577.1648718605416.52256655173086.696839237456350.18944744477695
84627.54612.5187892602318.87127116067116.777318224357420.336966105567748
947114682.1920328265725.53219568585856.960384760123490.90121894425167
104776.54750.9828110439931.40574400160247.092278976128130.762459238926899
114781.54776.7898841835130.62675713764767.07783953739201-0.0982099071830473
1246034658.779887172639.588727625411066.75399033759811-2.59820160791112
134770.54752.2219483033819.9141522273268-15.29822836660241.73885089813536
1447924785.8995627641221.93290745281351.770294972272090.202063201035316
154803.54803.5260034292121.30697657027521.7296173478436-0.0739510495173874
164747.54769.1175227721213.18708632599361.56932183604365-0.967324111592967
1748384820.5119099910318.7708043646811.594198714532220.662649708837814
1848544848.5543085196520.12858880860871.59356649460780.160632654531484
194902.54891.457106157423.4688331794461.587373814621280.394361905963767
204953.54941.0699668083327.30756266565331.579441584103950.452600545156826
214969.54968.0545049577627.26009491722731.57953238795251-0.00559143017397442
2249714977.0103069477924.56876132371681.58402312829017-0.316818887182729
234998.54998.2827881605324.08389733080051.58471315112723-0.0570514239410493
2450805061.9863614510429.91347928602741.577700452405230.685717584897032
2551115112.5642276132332.8725737924476-9.839478359027950.392404492922627
265110.55119.245663261729.04477077551520.423571930538951-0.409509030480171
2750965111.0558878969523.58239656275830.207994170793271-0.640857042253241
284939.54996.729239722463.292845385555460.00158511600877576-2.38881887741273
2951085076.3321672896314.52857891688040.007887445030035191.32094583271741
305137.55123.8311054536619.3835717166805-0.003322607497734870.570458680285191
315185.55173.1175719284723.7867011544617-0.01613422585280710.517324682682028
3251035130.5159531033314.01160234828570.011070302707621-1.14855194011764
3351685161.1162210623216.45407869874050.00507077527086850.287009197539619
3452085199.0812110481119.6212700749609-0.001595896739914290.372194621691957
355250.55241.1840358494822.9313850502882-0.007497227898804770.389010883400207
365204.55221.9752571927216.72674089407920.00182729506172894-0.729209198917488
375293.55271.9153903389221.54518414980188.14458255344350.613236108045015
385339.55327.3608958320126.5014689241022-0.2829608903452890.544617916358895
3954845445.9975855900340.02708615562950.112576217027951.58818143288692
4055335519.1191665976744.89738145422730.148423177204360.573129717105319
4155135527.8544919109439.57225404815960.147354216346154-0.625927984898631
425595.55587.17051212642.4798612996520.1417849131455310.341625496462164
4356055612.1209521643739.89848602854320.147815849337722-0.303286599160125
445919.55841.0346188042767.73134269307290.08612005895192143.27033551620156


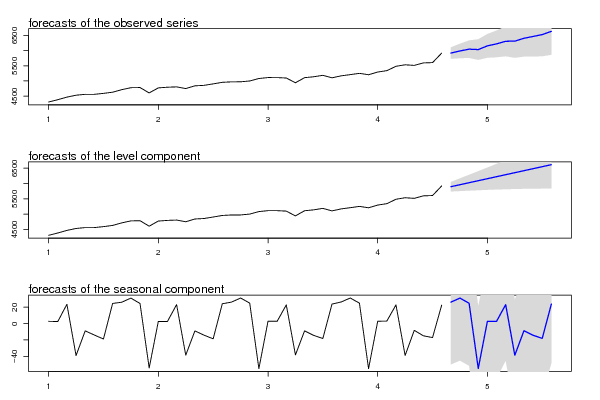
Structural Time Series Model -- Extrapolation
tObservedLevelSeasonal
15919.817889771985893.6572014817626.1606882902146
25990.273825135595959.1631439215731.1106812140231
36049.455621034846024.6690863613724.7865346734672
46035.363306336496090.17502880118-54.8117224646913
56158.421655933566155.680971240992.74068469256823
66223.90861189566221.18691368082.72169821480604
76309.814936610656286.692856120623.1220804900474
86313.515679466686352.19879856041-38.6831190937252
96409.010741453796417.70474100022-8.69399954643035
106468.925187737646483.21068344002-14.2854957023814
116530.634001018096548.71662587983-18.0826248617364
126638.137162413476614.2225683196423.9145940938381

\begin{tabular}{lllllllll}
\hline
Structural Time Series Model -- Extrapolation \tabularnewline
t & Observed & Level & Seasonal \tabularnewline
1 & 5919.81788977198 & 5893.65720148176 & 26.1606882902146 \tabularnewline
2 & 5990.27382513559 & 5959.16314392157 & 31.1106812140231 \tabularnewline
3 & 6049.45562103484 & 6024.66908636137 & 24.7865346734672 \tabularnewline
4 & 6035.36330633649 & 6090.17502880118 & -54.8117224646913 \tabularnewline
5 & 6158.42165593356 & 6155.68097124099 & 2.74068469256823 \tabularnewline
6 & 6223.9086118956 & 6221.1869136808 & 2.72169821480604 \tabularnewline
7 & 6309.81493661065 & 6286.6928561206 & 23.1220804900474 \tabularnewline
8 & 6313.51567946668 & 6352.19879856041 & -38.6831190937252 \tabularnewline
9 & 6409.01074145379 & 6417.70474100022 & -8.69399954643035 \tabularnewline
10 & 6468.92518773764 & 6483.21068344002 & -14.2854957023814 \tabularnewline
11 & 6530.63400101809 & 6548.71662587983 & -18.0826248617364 \tabularnewline
12 & 6638.13716241347 & 6614.22256831964 & 23.9145940938381 \tabularnewline
\hline
\end{tabular}
%Source: https://freestatistics.org/blog/index.php?pk=300660&T=2

[TABLE]
[ROW][C]Structural Time Series Model -- Extrapolation[/C][/ROW]
[ROW][C]t[/C][C]Observed[/C][C]Level[/C][C]Seasonal[/C][/ROW]
[ROW][C]1[/C][C]5919.81788977198[/C][C]5893.65720148176[/C][C]26.1606882902146[/C][/ROW]
[ROW][C]2[/C][C]5990.27382513559[/C][C]5959.16314392157[/C][C]31.1106812140231[/C][/ROW]
[ROW][C]3[/C][C]6049.45562103484[/C][C]6024.66908636137[/C][C]24.7865346734672[/C][/ROW]
[ROW][C]4[/C][C]6035.36330633649[/C][C]6090.17502880118[/C][C]-54.8117224646913[/C][/ROW]
[ROW][C]5[/C][C]6158.42165593356[/C][C]6155.68097124099[/C][C]2.74068469256823[/C][/ROW]
[ROW][C]6[/C][C]6223.9086118956[/C][C]6221.1869136808[/C][C]2.72169821480604[/C][/ROW]
[ROW][C]7[/C][C]6309.81493661065[/C][C]6286.6928561206[/C][C]23.1220804900474[/C][/ROW]
[ROW][C]8[/C][C]6313.51567946668[/C][C]6352.19879856041[/C][C]-38.6831190937252[/C][/ROW]
[ROW][C]9[/C][C]6409.01074145379[/C][C]6417.70474100022[/C][C]-8.69399954643035[/C][/ROW]
[ROW][C]10[/C][C]6468.92518773764[/C][C]6483.21068344002[/C][C]-14.2854957023814[/C][/ROW]
[ROW][C]11[/C][C]6530.63400101809[/C][C]6548.71662587983[/C][C]-18.0826248617364[/C][/ROW]
[ROW][C]12[/C][C]6638.13716241347[/C][C]6614.22256831964[/C][C]23.9145940938381[/C][/ROW]
[/TABLE]
Source: https://freestatistics.org/blog/index.php?pk=300660&T=2

Globally Unique Identifier (entire table): ba.freestatistics.org/blog/index.php?pk=300660&T=2

As an alternative you can also use a QR Code:  

The GUIDs for individual cells are displayed in the table below:

Structural Time Series Model -- Extrapolation
tObservedLevelSeasonal
15919.817889771985893.6572014817626.1606882902146
25990.273825135595959.1631439215731.1106812140231
36049.455621034846024.6690863613724.7865346734672
46035.363306336496090.17502880118-54.8117224646913
56158.421655933566155.680971240992.74068469256823
66223.90861189566221.18691368082.72169821480604
76309.814936610656286.692856120623.1220804900474
86313.515679466686352.19879856041-38.6831190937252
96409.010741453796417.70474100022-8.69399954643035
106468.925187737646483.21068344002-14.2854957023814
116530.634001018096548.71662587983-18.0826248617364
126638.137162413476614.2225683196423.9145940938381


Parameters (Session):
par1 = 12 ; par2 = 12 ; par3 = BFGS ;
Parameters (R input):
par1 = 12 ; par2 = 12 ; par3 = BFGS ;
R code (references can be found in the software module):
require('stsm')
require('stsm.class')
require('KFKSDS')
par1 <- as.numeric(par1)
par2 <- as.numeric(par2)
nx <- length(x)
x <- ts(x,frequency=par1)
m <- StructTS(x,type='BSM')
print(m$coef)
print(m$fitted)
print(m$resid)
mylevel <- as.numeric(m$fitted[,'level'])
myslope <- as.numeric(m$fitted[,'slope'])
myseas <- as.numeric(m$fitted[,'sea'])
myresid <- as.numeric(m$resid)
myfit <- mylevel+myseas
mm <- stsm.model(model = 'BSM', y = x, transPars = 'StructTS')
fit2 <- stsmFit(mm, stsm.method = 'maxlik.td.optim', method = par3, KF.args = list(P0cov = TRUE))
(fit2.comps <- tsSmooth(fit2, P0cov = FALSE)$states)
m2 <- set.pars(mm, pmax(fit2$par, .Machine$double.eps))
(ss <- char2numeric(m2))
(pred <- predict(ss, x, n.ahead = par2))
mylagmax <- nx/2
bitmap(file='test2.png')
op <- par(mfrow = c(2,2))
acf(as.numeric(x),lag.max = mylagmax,main='Observed')
acf(mylevel,na.action=na.pass,lag.max = mylagmax,main='Level')
acf(myseas,na.action=na.pass,lag.max = mylagmax,main='Seasonal')
acf(myresid,na.action=na.pass,lag.max = mylagmax,main='Standardized Residals')
par(op)
dev.off()
bitmap(file='test3.png')
op <- par(mfrow = c(2,2))
spectrum(as.numeric(x),main='Observed')
spectrum(mylevel,main='Level')
spectrum(myseas,main='Seasonal')
spectrum(myresid,main='Standardized Residals')
par(op)
dev.off()
bitmap(file='test4.png')
op <- par(mfrow = c(2,2))
cpgram(as.numeric(x),main='Observed')
cpgram(mylevel,main='Level')
cpgram(myseas,main='Seasonal')
cpgram(myresid,main='Standardized Residals')
par(op)
dev.off()
bitmap(file='test1.png')
plot(as.numeric(m$resid),main='Standardized Residuals',ylab='Residuals',xlab='time',type='b')
grid()
dev.off()
bitmap(file='test5.png')
op <- par(mfrow = c(2,2))
hist(m$resid,main='Residual Histogram')
plot(density(m$resid),main='Residual Kernel Density')
qqnorm(m$resid,main='Residual Normal QQ Plot')
qqline(m$resid)
plot(m$resid^2, myfit^2,main='Sq.Resid vs. Sq.Fit',xlab='Squared residuals',ylab='Squared Fit')
par(op)
dev.off()
bitmap(file='test6.png')
par(mfrow = c(3,1), mar = c(3,3,3,3))
plot(cbind(x, pred$pred), type = 'n', plot.type = 'single', ylab = '')
lines(x)
polygon(c(time(pred$pred), rev(time(pred$pred))), c(pred$pred + 2 * pred$se, rev(pred$pred)), col = 'gray85', border = NA)
polygon(c(time(pred$pred), rev(time(pred$pred))), c(pred$pred - 2 * pred$se, rev(pred$pred)), col = ' gray85', border = NA)
lines(pred$pred, col = 'blue', lwd = 1.5)
mtext(text = 'forecasts of the observed series', side = 3, adj = 0)
plot(cbind(x, pred$a[,1]), type = 'n', plot.type = 'single', ylab = '')
lines(x)
polygon(c(time(pred$a[,1]), rev(time(pred$a[,1]))), c(pred$a[,1] + 2 * sqrt(pred$P[,1]), rev(pred$a[,1])), col = 'gray85', border = NA)
polygon(c(time(pred$a[,1]), rev(time(pred$a[,1]))), c(pred$a[,1] - 2 * sqrt(pred$P[,1]), rev(pred$a[,1])), col = ' gray85', border = NA)
lines(pred$a[,1], col = 'blue', lwd = 1.5)
mtext(text = 'forecasts of the level component', side = 3, adj = 0)
plot(cbind(fit2.comps[,3], pred$a[,3]), type = 'n', plot.type = 'single', ylab = '')
lines(fit2.comps[,3])
polygon(c(time(pred$a[,3]), rev(time(pred$a[,3]))), c(pred$a[,3] + 2 * sqrt(pred$P[,3]), rev(pred$a[,3])), col = 'gray85', border = NA)
polygon(c(time(pred$a[,3]), rev(time(pred$a[,3]))), c(pred$a[,3] - 2 * sqrt(pred$P[,3]), rev(pred$a[,3])), col = ' gray85', border = NA)
lines(pred$a[,3], col = 'blue', lwd = 1.5)
mtext(text = 'forecasts of the seasonal component', side = 3, adj = 0)
dev.off()
load(file='createtable')
a<-table.start()
a<-table.row.start(a)
a<-table.element(a,'Structural Time Series Model -- Interpolation',6,TRUE)
a<-table.row.end(a)
a<-table.row.start(a)
a<-table.element(a,'t',header=TRUE)
a<-table.element(a,'Observed',header=TRUE)
a<-table.element(a,'Level',header=TRUE)
a<-table.element(a,'Slope',header=TRUE)
a<-table.element(a,'Seasonal',header=TRUE)
a<-table.element(a,'Stand. Residuals',header=TRUE)
a<-table.row.end(a)
for (i in 1:nx) {
a<-table.row.start(a)
a<-table.element(a,i,header=TRUE)
a<-table.element(a,x[i])
a<-table.element(a,mylevel[i])
a<-table.element(a,myslope[i])
a<-table.element(a,myseas[i])
a<-table.element(a,myresid[i])
a<-table.row.end(a)
}
a<-table.end(a)
table.save(a,file='mytable.tab')
a<-table.start()
a<-table.row.start(a)
a<-table.element(a,'Structural Time Series Model -- Extrapolation',4,TRUE)
a<-table.row.end(a)
a<-table.row.start(a)
a<-table.element(a,'t',header=TRUE)
a<-table.element(a,'Observed',header=TRUE)
a<-table.element(a,'Level',header=TRUE)
a<-table.element(a,'Seasonal',header=TRUE)
a<-table.row.end(a)
for (i in 1:par2) {
a<-table.row.start(a)
a<-table.element(a,i,header=TRUE)
a<-table.element(a,pred$pred[i])
a<-table.element(a,pred$a[i,1])
a<-table.element(a,pred$a[i,3])
a<-table.row.end(a)
}
a<-table.end(a)
table.save(a,file='mytable1.tab')