Free Statistics

of Irreproducible Research!

Author's title

Author*The author of this computation has been verified*
R Software Modulerwasp_structuraltimeseries.wasp
Title produced by softwareStructural Time Series Models
Date of computationSat, 17 Dec 2016 10:52:55 +0100
Cite this page as followsStatistical Computations at FreeStatistics.org, Office for Research Development and Education, URL https://freestatistics.org/blog/index.php?v=date/2016/Dec/17/t14819684181ydogyync198x9d.htm/, Retrieved Fri, 01 Nov 2024 03:48:02 +0000
Statistical Computations at FreeStatistics.org, Office for Research Development and Education, URL https://freestatistics.org/blog/index.php?pk=300655, Retrieved Fri, 01 Nov 2024 03:48:02 +0000
QR Codes:

Original text written by user:
IsPrivate?No (this computation is public)
User-defined keywords
Estimated Impact90
Family? (F = Feedback message, R = changed R code, M = changed R Module, P = changed Parameters, D = changed Data)
-       [Structural Time Series Models] [] [2016-12-17 09:52:55] [57f1f1af0ba442a9c0352eeef9ded060] [Current]
Feedback Forum

Post a new message
Dataseries X:
3600
6600
5400
5400
2400
4200
7800
9000
5400
7800
8400
4200
2700
6000
6900
6900
6300
5100
9000
4800
6300
6300
5100
8400
3600
2400
3900
6000
4800
5700
5700
8400
5400
5400
5700
2700
6300
4500
2700
7500
3300
4800
2100
3600
5400
2100
6300
5100
3900
3000
4800


Summary of computational transaction
Raw Input view raw input (R code)
Raw Outputview raw output of R engine
Computing time4 seconds
R ServerBig Analytics Cloud Computing Center

\begin{tabular}{lllllllll}
\hline
Summary of computational transaction \tabularnewline
Raw Input view raw input (R code)  \tabularnewline
Raw Outputview raw output of R engine  \tabularnewline
Computing time4 seconds \tabularnewline
R ServerBig Analytics Cloud Computing Center \tabularnewline
\hline
\end{tabular}
%Source: https://freestatistics.org/blog/index.php?pk=300655&T=0

[TABLE]
[ROW]
Summary of computational transaction[/C][/ROW] [ROW]Raw Input[/C] view raw input (R code) [/C][/ROW] [ROW]Raw Output[/C]view raw output of R engine [/C][/ROW] [ROW]Computing time[/C]4 seconds[/C][/ROW] [ROW]R Server[/C]Big Analytics Cloud Computing Center[/C][/ROW] [/TABLE] Source: https://freestatistics.org/blog/index.php?pk=300655&T=0

Globally Unique Identifier (entire table): ba.freestatistics.org/blog/index.php?pk=300655&T=0

As an alternative you can also use a QR Code:  

The GUIDs for individual cells are displayed in the table below:

Summary of computational transaction
Raw Input view raw input (R code)
Raw Outputview raw output of R engine
Computing time4 seconds
R ServerBig Analytics Cloud Computing Center


Structural Time Series Model -- Interpolation
tObservedLevelSlopeSeasonalStand. Residuals
136003600000
266004192.03816530944127.032456129548126.5713262195521.54431760966198
354004541.77924944582164.012834964871163.1698419138970.480773099560721
454004838.69422404083182.174555334831180.9600946748490.26529450562992
524004304.4306041898498.4422011832536100.123857178452-1.3989619887637
642004325.5619359777290.498946377604192.6033757696334-0.151770705543094
778005245.0879317338167.002921898593163.2457666769451.65619918394842
890006260.21031722088238.545474927877227.2970648583421.73155991405518
954006176.05538858354213.29152037618205.506030946634-0.673465478525758
1078006677.87105097427234.505008292889223.0450376823240.614463820899665
1184007210.79574484659255.341723511554239.4610366292520.646922487588515
1242006648.94349943603200.657111010285198.614909734201-1.79837411826169
1327006606.2065010393210.392709378875-2477.18738586011-0.989141493207457
1460006540.94611761215191.853428014529211.634468102939-0.52269032245633
1569006721.63938176809191.139136400419211.148776619202-0.0225316226565202
1669006858.54450101933187.801059510048209.056216853096-0.114358285368081
1763006820.77837094189174.331250907591201.320055112569-0.490306220051849
1851006508.91501640732145.958394911328186.45935166085-1.07956211555519
1990007149.3140533213174.319801097561199.962424398271.11431044431275
2048006705.10441647965139.28809951927184.832689776116-1.40836153647256
2163006679.73399213901130.04782599669181.216808468543-0.37754559114298
2263006654.33609120862121.381697801377178.14557443637-0.358069312679756
2351006359.6301746635598.2911971572632170.734078739519-0.961254456124689
2484006854.98613698673120.256846717723177.1224603333970.918868817730039
2536006716.10220735877111.602753919891-2113.62466077487-0.706008055550398
2624005725.1415913083447.7679425824879165.997219909135-2.3706847282645
2739005295.8169471204920.5714641287598156.277507655374-1.05010792750335
2860005438.1528085018927.4347774642113158.4098563609520.272274609917043
2948005276.999721817616.8904089285421155.567617097447-0.426179440762829
3057005350.8995724991820.059811033497156.3082041715570.129736275376964
3157005410.1180535444122.2281991608417156.7474663196980.0895175883645879
3284006068.1332859841157.3394622154278162.9182380662161.4575517451541
3354005924.7929530593946.2768722064655161.229395353322-0.460837046752042
3454005805.7571365674437.1744572945557160.020412909397-0.379964762269091
3557005774.5566694866133.4122708964722159.584858633765-0.157218019889001
3627005070.45265524363-7.15198393827416155.48304958685-1.69589398743902
3763005655.4188879455921.5184839649855-1393.774049861171.44679542366834
3845005373.581039978444.51108674893862122.301608141586-0.672604527150651
3927004733.27429674658-31.4302632212422114.516430221673-1.44771045692606
4075005315.591714679322.6417423651139120.6646575866561.3892043818229
4133004831.16479424587-24.3228698868565116.623766218689-1.10820976266887
4248004778.80028760331-25.8723407844492116.431433148675-0.0640088672907297
4321004124.91409576798-60.5291353910984112.876645848315-1.43631083284557
4436003933.58593291172-67.7409424960244112.266785795204-0.299473382200103
4554004187.90451201849-49.9941170341287113.5011877063270.737781193438456
4621003650.65689232915-76.8333260998918111.969464514156-1.11643967795762
4763004165.93647461186-44.2265634172749113.4921539905511.35669824396721
4851004317.61791926208-33.4399935928379113.9030674569180.448825363899243
4939004465.2319502327-23.8934888809146-1167.835387233420.427111087750006
5030004084.52049689285-43.6764507280871102.337394869842-0.800003001905545
5148004191.21739750531-35.3595448371699103.6502299794590.34001767223528

\begin{tabular}{lllllllll}
\hline
Structural Time Series Model -- Interpolation \tabularnewline
t & Observed & Level & Slope & Seasonal & Stand. Residuals \tabularnewline
1 & 3600 & 3600 & 0 & 0 & 0 \tabularnewline
2 & 6600 & 4192.03816530944 & 127.032456129548 & 126.571326219552 & 1.54431760966198 \tabularnewline
3 & 5400 & 4541.77924944582 & 164.012834964871 & 163.169841913897 & 0.480773099560721 \tabularnewline
4 & 5400 & 4838.69422404083 & 182.174555334831 & 180.960094674849 & 0.26529450562992 \tabularnewline
5 & 2400 & 4304.43060418984 & 98.4422011832536 & 100.123857178452 & -1.3989619887637 \tabularnewline
6 & 4200 & 4325.56193597772 & 90.4989463776041 & 92.6033757696334 & -0.151770705543094 \tabularnewline
7 & 7800 & 5245.0879317338 & 167.002921898593 & 163.245766676945 & 1.65619918394842 \tabularnewline
8 & 9000 & 6260.21031722088 & 238.545474927877 & 227.297064858342 & 1.73155991405518 \tabularnewline
9 & 5400 & 6176.05538858354 & 213.29152037618 & 205.506030946634 & -0.673465478525758 \tabularnewline
10 & 7800 & 6677.87105097427 & 234.505008292889 & 223.045037682324 & 0.614463820899665 \tabularnewline
11 & 8400 & 7210.79574484659 & 255.341723511554 & 239.461036629252 & 0.646922487588515 \tabularnewline
12 & 4200 & 6648.94349943603 & 200.657111010285 & 198.614909734201 & -1.79837411826169 \tabularnewline
13 & 2700 & 6606.2065010393 & 210.392709378875 & -2477.18738586011 & -0.989141493207457 \tabularnewline
14 & 6000 & 6540.94611761215 & 191.853428014529 & 211.634468102939 & -0.52269032245633 \tabularnewline
15 & 6900 & 6721.63938176809 & 191.139136400419 & 211.148776619202 & -0.0225316226565202 \tabularnewline
16 & 6900 & 6858.54450101933 & 187.801059510048 & 209.056216853096 & -0.114358285368081 \tabularnewline
17 & 6300 & 6820.77837094189 & 174.331250907591 & 201.320055112569 & -0.490306220051849 \tabularnewline
18 & 5100 & 6508.91501640732 & 145.958394911328 & 186.45935166085 & -1.07956211555519 \tabularnewline
19 & 9000 & 7149.3140533213 & 174.319801097561 & 199.96242439827 & 1.11431044431275 \tabularnewline
20 & 4800 & 6705.10441647965 & 139.28809951927 & 184.832689776116 & -1.40836153647256 \tabularnewline
21 & 6300 & 6679.73399213901 & 130.04782599669 & 181.216808468543 & -0.37754559114298 \tabularnewline
22 & 6300 & 6654.33609120862 & 121.381697801377 & 178.14557443637 & -0.358069312679756 \tabularnewline
23 & 5100 & 6359.63017466355 & 98.2911971572632 & 170.734078739519 & -0.961254456124689 \tabularnewline
24 & 8400 & 6854.98613698673 & 120.256846717723 & 177.122460333397 & 0.918868817730039 \tabularnewline
25 & 3600 & 6716.10220735877 & 111.602753919891 & -2113.62466077487 & -0.706008055550398 \tabularnewline
26 & 2400 & 5725.14159130834 & 47.7679425824879 & 165.997219909135 & -2.3706847282645 \tabularnewline
27 & 3900 & 5295.81694712049 & 20.5714641287598 & 156.277507655374 & -1.05010792750335 \tabularnewline
28 & 6000 & 5438.15280850189 & 27.4347774642113 & 158.409856360952 & 0.272274609917043 \tabularnewline
29 & 4800 & 5276.9997218176 & 16.8904089285421 & 155.567617097447 & -0.426179440762829 \tabularnewline
30 & 5700 & 5350.89957249918 & 20.059811033497 & 156.308204171557 & 0.129736275376964 \tabularnewline
31 & 5700 & 5410.11805354441 & 22.2281991608417 & 156.747466319698 & 0.0895175883645879 \tabularnewline
32 & 8400 & 6068.13328598411 & 57.3394622154278 & 162.918238066216 & 1.4575517451541 \tabularnewline
33 & 5400 & 5924.79295305939 & 46.2768722064655 & 161.229395353322 & -0.460837046752042 \tabularnewline
34 & 5400 & 5805.75713656744 & 37.1744572945557 & 160.020412909397 & -0.379964762269091 \tabularnewline
35 & 5700 & 5774.55666948661 & 33.4122708964722 & 159.584858633765 & -0.157218019889001 \tabularnewline
36 & 2700 & 5070.45265524363 & -7.15198393827416 & 155.48304958685 & -1.69589398743902 \tabularnewline
37 & 6300 & 5655.41888794559 & 21.5184839649855 & -1393.77404986117 & 1.44679542366834 \tabularnewline
38 & 4500 & 5373.58103997844 & 4.51108674893862 & 122.301608141586 & -0.672604527150651 \tabularnewline
39 & 2700 & 4733.27429674658 & -31.4302632212422 & 114.516430221673 & -1.44771045692606 \tabularnewline
40 & 7500 & 5315.59171467932 & 2.6417423651139 & 120.664657586656 & 1.3892043818229 \tabularnewline
41 & 3300 & 4831.16479424587 & -24.3228698868565 & 116.623766218689 & -1.10820976266887 \tabularnewline
42 & 4800 & 4778.80028760331 & -25.8723407844492 & 116.431433148675 & -0.0640088672907297 \tabularnewline
43 & 2100 & 4124.91409576798 & -60.5291353910984 & 112.876645848315 & -1.43631083284557 \tabularnewline
44 & 3600 & 3933.58593291172 & -67.7409424960244 & 112.266785795204 & -0.299473382200103 \tabularnewline
45 & 5400 & 4187.90451201849 & -49.9941170341287 & 113.501187706327 & 0.737781193438456 \tabularnewline
46 & 2100 & 3650.65689232915 & -76.8333260998918 & 111.969464514156 & -1.11643967795762 \tabularnewline
47 & 6300 & 4165.93647461186 & -44.2265634172749 & 113.492153990551 & 1.35669824396721 \tabularnewline
48 & 5100 & 4317.61791926208 & -33.4399935928379 & 113.903067456918 & 0.448825363899243 \tabularnewline
49 & 3900 & 4465.2319502327 & -23.8934888809146 & -1167.83538723342 & 0.427111087750006 \tabularnewline
50 & 3000 & 4084.52049689285 & -43.6764507280871 & 102.337394869842 & -0.800003001905545 \tabularnewline
51 & 4800 & 4191.21739750531 & -35.3595448371699 & 103.650229979459 & 0.34001767223528 \tabularnewline
\hline
\end{tabular}
%Source: https://freestatistics.org/blog/index.php?pk=300655&T=1

[TABLE]
[ROW][C]Structural Time Series Model -- Interpolation[/C][/ROW]
[ROW][C]t[/C][C]Observed[/C][C]Level[/C][C]Slope[/C][C]Seasonal[/C][C]Stand. Residuals[/C][/ROW]
[ROW][C]1[/C][C]3600[/C][C]3600[/C][C]0[/C][C]0[/C][C]0[/C][/ROW]
[ROW][C]2[/C][C]6600[/C][C]4192.03816530944[/C][C]127.032456129548[/C][C]126.571326219552[/C][C]1.54431760966198[/C][/ROW]
[ROW][C]3[/C][C]5400[/C][C]4541.77924944582[/C][C]164.012834964871[/C][C]163.169841913897[/C][C]0.480773099560721[/C][/ROW]
[ROW][C]4[/C][C]5400[/C][C]4838.69422404083[/C][C]182.174555334831[/C][C]180.960094674849[/C][C]0.26529450562992[/C][/ROW]
[ROW][C]5[/C][C]2400[/C][C]4304.43060418984[/C][C]98.4422011832536[/C][C]100.123857178452[/C][C]-1.3989619887637[/C][/ROW]
[ROW][C]6[/C][C]4200[/C][C]4325.56193597772[/C][C]90.4989463776041[/C][C]92.6033757696334[/C][C]-0.151770705543094[/C][/ROW]
[ROW][C]7[/C][C]7800[/C][C]5245.0879317338[/C][C]167.002921898593[/C][C]163.245766676945[/C][C]1.65619918394842[/C][/ROW]
[ROW][C]8[/C][C]9000[/C][C]6260.21031722088[/C][C]238.545474927877[/C][C]227.297064858342[/C][C]1.73155991405518[/C][/ROW]
[ROW][C]9[/C][C]5400[/C][C]6176.05538858354[/C][C]213.29152037618[/C][C]205.506030946634[/C][C]-0.673465478525758[/C][/ROW]
[ROW][C]10[/C][C]7800[/C][C]6677.87105097427[/C][C]234.505008292889[/C][C]223.045037682324[/C][C]0.614463820899665[/C][/ROW]
[ROW][C]11[/C][C]8400[/C][C]7210.79574484659[/C][C]255.341723511554[/C][C]239.461036629252[/C][C]0.646922487588515[/C][/ROW]
[ROW][C]12[/C][C]4200[/C][C]6648.94349943603[/C][C]200.657111010285[/C][C]198.614909734201[/C][C]-1.79837411826169[/C][/ROW]
[ROW][C]13[/C][C]2700[/C][C]6606.2065010393[/C][C]210.392709378875[/C][C]-2477.18738586011[/C][C]-0.989141493207457[/C][/ROW]
[ROW][C]14[/C][C]6000[/C][C]6540.94611761215[/C][C]191.853428014529[/C][C]211.634468102939[/C][C]-0.52269032245633[/C][/ROW]
[ROW][C]15[/C][C]6900[/C][C]6721.63938176809[/C][C]191.139136400419[/C][C]211.148776619202[/C][C]-0.0225316226565202[/C][/ROW]
[ROW][C]16[/C][C]6900[/C][C]6858.54450101933[/C][C]187.801059510048[/C][C]209.056216853096[/C][C]-0.114358285368081[/C][/ROW]
[ROW][C]17[/C][C]6300[/C][C]6820.77837094189[/C][C]174.331250907591[/C][C]201.320055112569[/C][C]-0.490306220051849[/C][/ROW]
[ROW][C]18[/C][C]5100[/C][C]6508.91501640732[/C][C]145.958394911328[/C][C]186.45935166085[/C][C]-1.07956211555519[/C][/ROW]
[ROW][C]19[/C][C]9000[/C][C]7149.3140533213[/C][C]174.319801097561[/C][C]199.96242439827[/C][C]1.11431044431275[/C][/ROW]
[ROW][C]20[/C][C]4800[/C][C]6705.10441647965[/C][C]139.28809951927[/C][C]184.832689776116[/C][C]-1.40836153647256[/C][/ROW]
[ROW][C]21[/C][C]6300[/C][C]6679.73399213901[/C][C]130.04782599669[/C][C]181.216808468543[/C][C]-0.37754559114298[/C][/ROW]
[ROW][C]22[/C][C]6300[/C][C]6654.33609120862[/C][C]121.381697801377[/C][C]178.14557443637[/C][C]-0.358069312679756[/C][/ROW]
[ROW][C]23[/C][C]5100[/C][C]6359.63017466355[/C][C]98.2911971572632[/C][C]170.734078739519[/C][C]-0.961254456124689[/C][/ROW]
[ROW][C]24[/C][C]8400[/C][C]6854.98613698673[/C][C]120.256846717723[/C][C]177.122460333397[/C][C]0.918868817730039[/C][/ROW]
[ROW][C]25[/C][C]3600[/C][C]6716.10220735877[/C][C]111.602753919891[/C][C]-2113.62466077487[/C][C]-0.706008055550398[/C][/ROW]
[ROW][C]26[/C][C]2400[/C][C]5725.14159130834[/C][C]47.7679425824879[/C][C]165.997219909135[/C][C]-2.3706847282645[/C][/ROW]
[ROW][C]27[/C][C]3900[/C][C]5295.81694712049[/C][C]20.5714641287598[/C][C]156.277507655374[/C][C]-1.05010792750335[/C][/ROW]
[ROW][C]28[/C][C]6000[/C][C]5438.15280850189[/C][C]27.4347774642113[/C][C]158.409856360952[/C][C]0.272274609917043[/C][/ROW]
[ROW][C]29[/C][C]4800[/C][C]5276.9997218176[/C][C]16.8904089285421[/C][C]155.567617097447[/C][C]-0.426179440762829[/C][/ROW]
[ROW][C]30[/C][C]5700[/C][C]5350.89957249918[/C][C]20.059811033497[/C][C]156.308204171557[/C][C]0.129736275376964[/C][/ROW]
[ROW][C]31[/C][C]5700[/C][C]5410.11805354441[/C][C]22.2281991608417[/C][C]156.747466319698[/C][C]0.0895175883645879[/C][/ROW]
[ROW][C]32[/C][C]8400[/C][C]6068.13328598411[/C][C]57.3394622154278[/C][C]162.918238066216[/C][C]1.4575517451541[/C][/ROW]
[ROW][C]33[/C][C]5400[/C][C]5924.79295305939[/C][C]46.2768722064655[/C][C]161.229395353322[/C][C]-0.460837046752042[/C][/ROW]
[ROW][C]34[/C][C]5400[/C][C]5805.75713656744[/C][C]37.1744572945557[/C][C]160.020412909397[/C][C]-0.379964762269091[/C][/ROW]
[ROW][C]35[/C][C]5700[/C][C]5774.55666948661[/C][C]33.4122708964722[/C][C]159.584858633765[/C][C]-0.157218019889001[/C][/ROW]
[ROW][C]36[/C][C]2700[/C][C]5070.45265524363[/C][C]-7.15198393827416[/C][C]155.48304958685[/C][C]-1.69589398743902[/C][/ROW]
[ROW][C]37[/C][C]6300[/C][C]5655.41888794559[/C][C]21.5184839649855[/C][C]-1393.77404986117[/C][C]1.44679542366834[/C][/ROW]
[ROW][C]38[/C][C]4500[/C][C]5373.58103997844[/C][C]4.51108674893862[/C][C]122.301608141586[/C][C]-0.672604527150651[/C][/ROW]
[ROW][C]39[/C][C]2700[/C][C]4733.27429674658[/C][C]-31.4302632212422[/C][C]114.516430221673[/C][C]-1.44771045692606[/C][/ROW]
[ROW][C]40[/C][C]7500[/C][C]5315.59171467932[/C][C]2.6417423651139[/C][C]120.664657586656[/C][C]1.3892043818229[/C][/ROW]
[ROW][C]41[/C][C]3300[/C][C]4831.16479424587[/C][C]-24.3228698868565[/C][C]116.623766218689[/C][C]-1.10820976266887[/C][/ROW]
[ROW][C]42[/C][C]4800[/C][C]4778.80028760331[/C][C]-25.8723407844492[/C][C]116.431433148675[/C][C]-0.0640088672907297[/C][/ROW]
[ROW][C]43[/C][C]2100[/C][C]4124.91409576798[/C][C]-60.5291353910984[/C][C]112.876645848315[/C][C]-1.43631083284557[/C][/ROW]
[ROW][C]44[/C][C]3600[/C][C]3933.58593291172[/C][C]-67.7409424960244[/C][C]112.266785795204[/C][C]-0.299473382200103[/C][/ROW]
[ROW][C]45[/C][C]5400[/C][C]4187.90451201849[/C][C]-49.9941170341287[/C][C]113.501187706327[/C][C]0.737781193438456[/C][/ROW]
[ROW][C]46[/C][C]2100[/C][C]3650.65689232915[/C][C]-76.8333260998918[/C][C]111.969464514156[/C][C]-1.11643967795762[/C][/ROW]
[ROW][C]47[/C][C]6300[/C][C]4165.93647461186[/C][C]-44.2265634172749[/C][C]113.492153990551[/C][C]1.35669824396721[/C][/ROW]
[ROW][C]48[/C][C]5100[/C][C]4317.61791926208[/C][C]-33.4399935928379[/C][C]113.903067456918[/C][C]0.448825363899243[/C][/ROW]
[ROW][C]49[/C][C]3900[/C][C]4465.2319502327[/C][C]-23.8934888809146[/C][C]-1167.83538723342[/C][C]0.427111087750006[/C][/ROW]
[ROW][C]50[/C][C]3000[/C][C]4084.52049689285[/C][C]-43.6764507280871[/C][C]102.337394869842[/C][C]-0.800003001905545[/C][/ROW]
[ROW][C]51[/C][C]4800[/C][C]4191.21739750531[/C][C]-35.3595448371699[/C][C]103.650229979459[/C][C]0.34001767223528[/C][/ROW]
[/TABLE]
Source: https://freestatistics.org/blog/index.php?pk=300655&T=1

Globally Unique Identifier (entire table): ba.freestatistics.org/blog/index.php?pk=300655&T=1

As an alternative you can also use a QR Code:  

The GUIDs for individual cells are displayed in the table below:

Structural Time Series Model -- Interpolation
tObservedLevelSlopeSeasonalStand. Residuals
136003600000
266004192.03816530944127.032456129548126.5713262195521.54431760966198
354004541.77924944582164.012834964871163.1698419138970.480773099560721
454004838.69422404083182.174555334831180.9600946748490.26529450562992
524004304.4306041898498.4422011832536100.123857178452-1.3989619887637
642004325.5619359777290.498946377604192.6033757696334-0.151770705543094
778005245.0879317338167.002921898593163.2457666769451.65619918394842
890006260.21031722088238.545474927877227.2970648583421.73155991405518
954006176.05538858354213.29152037618205.506030946634-0.673465478525758
1078006677.87105097427234.505008292889223.0450376823240.614463820899665
1184007210.79574484659255.341723511554239.4610366292520.646922487588515
1242006648.94349943603200.657111010285198.614909734201-1.79837411826169
1327006606.2065010393210.392709378875-2477.18738586011-0.989141493207457
1460006540.94611761215191.853428014529211.634468102939-0.52269032245633
1569006721.63938176809191.139136400419211.148776619202-0.0225316226565202
1669006858.54450101933187.801059510048209.056216853096-0.114358285368081
1763006820.77837094189174.331250907591201.320055112569-0.490306220051849
1851006508.91501640732145.958394911328186.45935166085-1.07956211555519
1990007149.3140533213174.319801097561199.962424398271.11431044431275
2048006705.10441647965139.28809951927184.832689776116-1.40836153647256
2163006679.73399213901130.04782599669181.216808468543-0.37754559114298
2263006654.33609120862121.381697801377178.14557443637-0.358069312679756
2351006359.6301746635598.2911971572632170.734078739519-0.961254456124689
2484006854.98613698673120.256846717723177.1224603333970.918868817730039
2536006716.10220735877111.602753919891-2113.62466077487-0.706008055550398
2624005725.1415913083447.7679425824879165.997219909135-2.3706847282645
2739005295.8169471204920.5714641287598156.277507655374-1.05010792750335
2860005438.1528085018927.4347774642113158.4098563609520.272274609917043
2948005276.999721817616.8904089285421155.567617097447-0.426179440762829
3057005350.8995724991820.059811033497156.3082041715570.129736275376964
3157005410.1180535444122.2281991608417156.7474663196980.0895175883645879
3284006068.1332859841157.3394622154278162.9182380662161.4575517451541
3354005924.7929530593946.2768722064655161.229395353322-0.460837046752042
3454005805.7571365674437.1744572945557160.020412909397-0.379964762269091
3557005774.5566694866133.4122708964722159.584858633765-0.157218019889001
3627005070.45265524363-7.15198393827416155.48304958685-1.69589398743902
3763005655.4188879455921.5184839649855-1393.774049861171.44679542366834
3845005373.581039978444.51108674893862122.301608141586-0.672604527150651
3927004733.27429674658-31.4302632212422114.516430221673-1.44771045692606
4075005315.591714679322.6417423651139120.6646575866561.3892043818229
4133004831.16479424587-24.3228698868565116.623766218689-1.10820976266887
4248004778.80028760331-25.8723407844492116.431433148675-0.0640088672907297
4321004124.91409576798-60.5291353910984112.876645848315-1.43631083284557
4436003933.58593291172-67.7409424960244112.266785795204-0.299473382200103
4554004187.90451201849-49.9941170341287113.5011877063270.737781193438456
4621003650.65689232915-76.8333260998918111.969464514156-1.11643967795762
4763004165.93647461186-44.2265634172749113.4921539905511.35669824396721
4851004317.61791926208-33.4399935928379113.9030674569180.448825363899243
4939004465.2319502327-23.8934888809146-1167.835387233420.427111087750006
5030004084.52049689285-43.6764507280871102.337394869842-0.800003001905545
5148004191.21739750531-35.3595448371699103.6502299794590.34001767223528


Structural Time Series Model -- Extrapolation
tObservedLevelSeasonal
18175.194893475626249.61690298141925.57799049421
25459.498476480316683.38107841301-1223.8826019327
37894.50707267657117.14525384462777.361818831882
46922.795136166917550.90942927623-628.114293109315
58990.369512915057984.673604707841005.69590820722
610189.74931365978418.437780139451771.31153352023
77621.087543214118852.20195557106-1231.11441235694
810976.63516013269285.966131002661690.66902912992
99624.131998232639719.73030643427-95.5983082016415
109395.82940235510153.4944818659-757.665079510881
118578.0381467202610587.2586572975-2009.22051057723
129796.0017582343511021.0228327291-1225.02107449475

\begin{tabular}{lllllllll}
\hline
Structural Time Series Model -- Extrapolation \tabularnewline
t & Observed & Level & Seasonal \tabularnewline
1 & 8175.19489347562 & 6249.6169029814 & 1925.57799049421 \tabularnewline
2 & 5459.49847648031 & 6683.38107841301 & -1223.8826019327 \tabularnewline
3 & 7894.5070726765 & 7117.14525384462 & 777.361818831882 \tabularnewline
4 & 6922.79513616691 & 7550.90942927623 & -628.114293109315 \tabularnewline
5 & 8990.36951291505 & 7984.67360470784 & 1005.69590820722 \tabularnewline
6 & 10189.7493136597 & 8418.43778013945 & 1771.31153352023 \tabularnewline
7 & 7621.08754321411 & 8852.20195557106 & -1231.11441235694 \tabularnewline
8 & 10976.6351601326 & 9285.96613100266 & 1690.66902912992 \tabularnewline
9 & 9624.13199823263 & 9719.73030643427 & -95.5983082016415 \tabularnewline
10 & 9395.829402355 & 10153.4944818659 & -757.665079510881 \tabularnewline
11 & 8578.03814672026 & 10587.2586572975 & -2009.22051057723 \tabularnewline
12 & 9796.00175823435 & 11021.0228327291 & -1225.02107449475 \tabularnewline
\hline
\end{tabular}
%Source: https://freestatistics.org/blog/index.php?pk=300655&T=2

[TABLE]
[ROW][C]Structural Time Series Model -- Extrapolation[/C][/ROW]
[ROW][C]t[/C][C]Observed[/C][C]Level[/C][C]Seasonal[/C][/ROW]
[ROW][C]1[/C][C]8175.19489347562[/C][C]6249.6169029814[/C][C]1925.57799049421[/C][/ROW]
[ROW][C]2[/C][C]5459.49847648031[/C][C]6683.38107841301[/C][C]-1223.8826019327[/C][/ROW]
[ROW][C]3[/C][C]7894.5070726765[/C][C]7117.14525384462[/C][C]777.361818831882[/C][/ROW]
[ROW][C]4[/C][C]6922.79513616691[/C][C]7550.90942927623[/C][C]-628.114293109315[/C][/ROW]
[ROW][C]5[/C][C]8990.36951291505[/C][C]7984.67360470784[/C][C]1005.69590820722[/C][/ROW]
[ROW][C]6[/C][C]10189.7493136597[/C][C]8418.43778013945[/C][C]1771.31153352023[/C][/ROW]
[ROW][C]7[/C][C]7621.08754321411[/C][C]8852.20195557106[/C][C]-1231.11441235694[/C][/ROW]
[ROW][C]8[/C][C]10976.6351601326[/C][C]9285.96613100266[/C][C]1690.66902912992[/C][/ROW]
[ROW][C]9[/C][C]9624.13199823263[/C][C]9719.73030643427[/C][C]-95.5983082016415[/C][/ROW]
[ROW][C]10[/C][C]9395.829402355[/C][C]10153.4944818659[/C][C]-757.665079510881[/C][/ROW]
[ROW][C]11[/C][C]8578.03814672026[/C][C]10587.2586572975[/C][C]-2009.22051057723[/C][/ROW]
[ROW][C]12[/C][C]9796.00175823435[/C][C]11021.0228327291[/C][C]-1225.02107449475[/C][/ROW]
[/TABLE]
Source: https://freestatistics.org/blog/index.php?pk=300655&T=2

Globally Unique Identifier (entire table): ba.freestatistics.org/blog/index.php?pk=300655&T=2

As an alternative you can also use a QR Code:  

The GUIDs for individual cells are displayed in the table below:

Structural Time Series Model -- Extrapolation
tObservedLevelSeasonal
18175.194893475626249.61690298141925.57799049421
25459.498476480316683.38107841301-1223.8826019327
37894.50707267657117.14525384462777.361818831882
46922.795136166917550.90942927623-628.114293109315
58990.369512915057984.673604707841005.69590820722
610189.74931365978418.437780139451771.31153352023
77621.087543214118852.20195557106-1231.11441235694
810976.63516013269285.966131002661690.66902912992
99624.131998232639719.73030643427-95.5983082016415
109395.82940235510153.4944818659-757.665079510881
118578.0381467202610587.2586572975-2009.22051057723
129796.0017582343511021.0228327291-1225.02107449475


Parameters (Session):
par1 = 12 ; par2 = 12 ; par3 = BFGS ;
Parameters (R input):
par1 = 12 ; par2 = 12 ; par3 = BFGS ;
R code (references can be found in the software module):
require('stsm')
require('stsm.class')
require('KFKSDS')
par1 <- as.numeric(par1)
par2 <- as.numeric(par2)
nx <- length(x)
x <- ts(x,frequency=par1)
m <- StructTS(x,type='BSM')
print(m$coef)
print(m$fitted)
print(m$resid)
mylevel <- as.numeric(m$fitted[,'level'])
myslope <- as.numeric(m$fitted[,'slope'])
myseas <- as.numeric(m$fitted[,'sea'])
myresid <- as.numeric(m$resid)
myfit <- mylevel+myseas
mm <- stsm.model(model = 'BSM', y = x, transPars = 'StructTS')
fit2 <- stsmFit(mm, stsm.method = 'maxlik.td.optim', method = par3, KF.args = list(P0cov = TRUE))
(fit2.comps <- tsSmooth(fit2, P0cov = FALSE)$states)
m2 <- set.pars(mm, pmax(fit2$par, .Machine$double.eps))
(ss <- char2numeric(m2))
(pred <- predict(ss, x, n.ahead = par2))
mylagmax <- nx/2
bitmap(file='test2.png')
op <- par(mfrow = c(2,2))
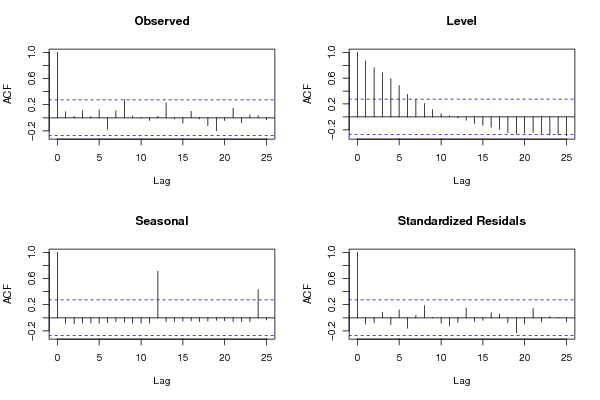
acf(as.numeric(x),lag.max = mylagmax,main='Observed')
acf(mylevel,na.action=na.pass,lag.max = mylagmax,main='Level')
acf(myseas,na.action=na.pass,lag.max = mylagmax,main='Seasonal')
acf(myresid,na.action=na.pass,lag.max = mylagmax,main='Standardized Residals')
par(op)
dev.off()
bitmap(file='test3.png')
op <- par(mfrow = c(2,2))
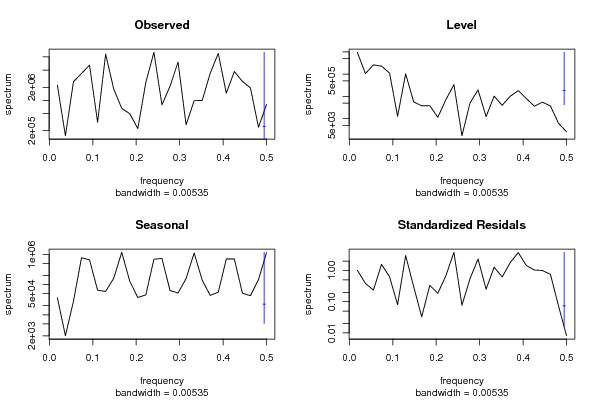
spectrum(as.numeric(x),main='Observed')
spectrum(mylevel,main='Level')
spectrum(myseas,main='Seasonal')
spectrum(myresid,main='Standardized Residals')
par(op)
dev.off()
bitmap(file='test4.png')
op <- par(mfrow = c(2,2))
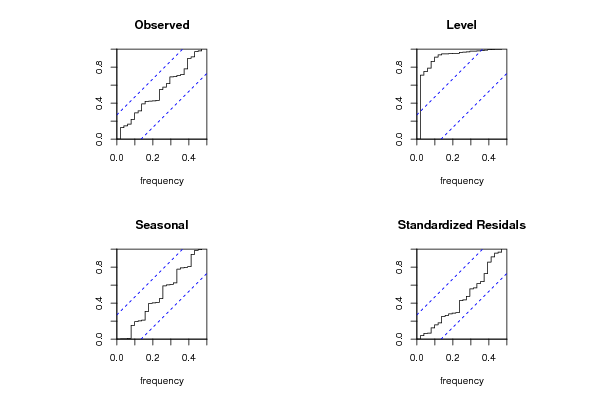
cpgram(as.numeric(x),main='Observed')
cpgram(mylevel,main='Level')
cpgram(myseas,main='Seasonal')
cpgram(myresid,main='Standardized Residals')
par(op)
dev.off()
bitmap(file='test1.png')
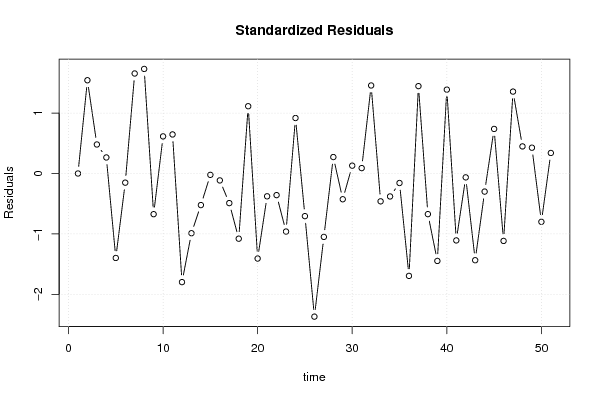
plot(as.numeric(m$resid),main='Standardized Residuals',ylab='Residuals',xlab='time',type='b')
grid()
dev.off()
bitmap(file='test5.png')
op <- par(mfrow = c(2,2))
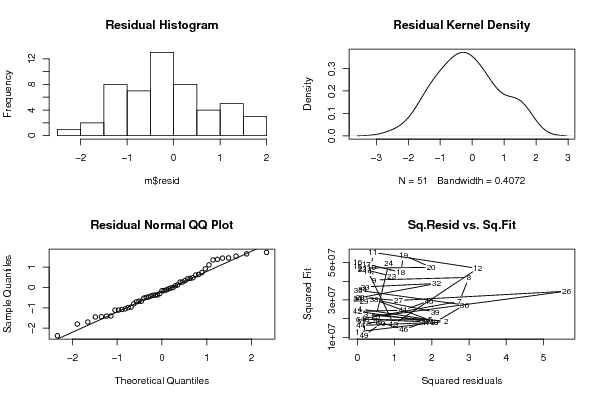
hist(m$resid,main='Residual Histogram')
plot(density(m$resid),main='Residual Kernel Density')
qqnorm(m$resid,main='Residual Normal QQ Plot')
qqline(m$resid)
plot(m$resid^2, myfit^2,main='Sq.Resid vs. Sq.Fit',xlab='Squared residuals',ylab='Squared Fit')
par(op)
dev.off()
bitmap(file='test6.png')
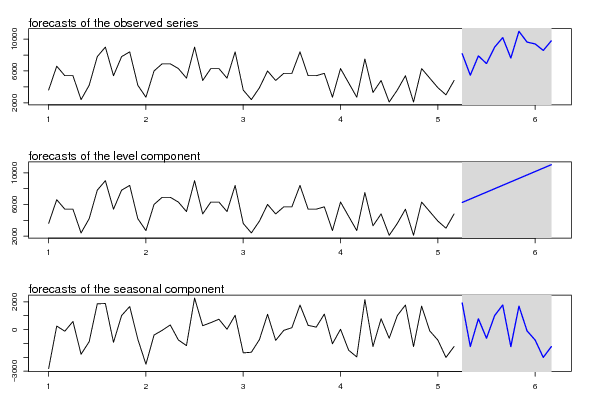
par(mfrow = c(3,1), mar = c(3,3,3,3))
plot(cbind(x, pred$pred), type = 'n', plot.type = 'single', ylab = '')
lines(x)
polygon(c(time(pred$pred), rev(time(pred$pred))), c(pred$pred + 2 * pred$se, rev(pred$pred)), col = 'gray85', border = NA)
polygon(c(time(pred$pred), rev(time(pred$pred))), c(pred$pred - 2 * pred$se, rev(pred$pred)), col = ' gray85', border = NA)
lines(pred$pred, col = 'blue', lwd = 1.5)
mtext(text = 'forecasts of the observed series', side = 3, adj = 0)
plot(cbind(x, pred$a[,1]), type = 'n', plot.type = 'single', ylab = '')
lines(x)
polygon(c(time(pred$a[,1]), rev(time(pred$a[,1]))), c(pred$a[,1] + 2 * sqrt(pred$P[,1]), rev(pred$a[,1])), col = 'gray85', border = NA)
polygon(c(time(pred$a[,1]), rev(time(pred$a[,1]))), c(pred$a[,1] - 2 * sqrt(pred$P[,1]), rev(pred$a[,1])), col = ' gray85', border = NA)
lines(pred$a[,1], col = 'blue', lwd = 1.5)
mtext(text = 'forecasts of the level component', side = 3, adj = 0)
plot(cbind(fit2.comps[,3], pred$a[,3]), type = 'n', plot.type = 'single', ylab = '')
lines(fit2.comps[,3])
polygon(c(time(pred$a[,3]), rev(time(pred$a[,3]))), c(pred$a[,3] + 2 * sqrt(pred$P[,3]), rev(pred$a[,3])), col = 'gray85', border = NA)
polygon(c(time(pred$a[,3]), rev(time(pred$a[,3]))), c(pred$a[,3] - 2 * sqrt(pred$P[,3]), rev(pred$a[,3])), col = ' gray85', border = NA)
lines(pred$a[,3], col = 'blue', lwd = 1.5)
mtext(text = 'forecasts of the seasonal component', side = 3, adj = 0)
dev.off()
load(file='createtable')
a<-table.start()
a<-table.row.start(a)
a<-table.element(a,'Structural Time Series Model -- Interpolation',6,TRUE)
a<-table.row.end(a)
a<-table.row.start(a)
a<-table.element(a,'t',header=TRUE)
a<-table.element(a,'Observed',header=TRUE)
a<-table.element(a,'Level',header=TRUE)
a<-table.element(a,'Slope',header=TRUE)
a<-table.element(a,'Seasonal',header=TRUE)
a<-table.element(a,'Stand. Residuals',header=TRUE)
a<-table.row.end(a)
for (i in 1:nx) {
a<-table.row.start(a)
a<-table.element(a,i,header=TRUE)
a<-table.element(a,x[i])
a<-table.element(a,mylevel[i])
a<-table.element(a,myslope[i])
a<-table.element(a,myseas[i])
a<-table.element(a,myresid[i])
a<-table.row.end(a)
}
a<-table.end(a)
table.save(a,file='mytable.tab')
a<-table.start()
a<-table.row.start(a)
a<-table.element(a,'Structural Time Series Model -- Extrapolation',4,TRUE)
a<-table.row.end(a)
a<-table.row.start(a)
a<-table.element(a,'t',header=TRUE)
a<-table.element(a,'Observed',header=TRUE)
a<-table.element(a,'Level',header=TRUE)
a<-table.element(a,'Seasonal',header=TRUE)
a<-table.row.end(a)
for (i in 1:par2) {
a<-table.row.start(a)
a<-table.element(a,i,header=TRUE)
a<-table.element(a,pred$pred[i])
a<-table.element(a,pred$a[i,1])
a<-table.element(a,pred$a[i,3])
a<-table.row.end(a)
}
a<-table.end(a)
table.save(a,file='mytable1.tab')