Free Statistics

of Irreproducible Research!

Author's title

Author*The author of this computation has been verified*
R Software Modulerwasp_autocorrelation.wasp
Title produced by software(Partial) Autocorrelation Function
Date of computationSat, 17 Dec 2016 10:42:14 +0100
Cite this page as followsStatistical Computations at FreeStatistics.org, Office for Research Development and Education, URL https://freestatistics.org/blog/index.php?v=date/2016/Dec/17/t1481967965gszqkx0ew3i304i.htm/, Retrieved Fri, 01 Nov 2024 03:44:30 +0000
Statistical Computations at FreeStatistics.org, Office for Research Development and Education, URL https://freestatistics.org/blog/index.php?pk=300649, Retrieved Fri, 01 Nov 2024 03:44:30 +0000
QR Codes:

Original text written by user:
IsPrivate?No (this computation is public)
User-defined keywords
Estimated Impact88
Family? (F = Feedback message, R = changed R code, M = changed R Module, P = changed Parameters, D = changed Data)
-       [(Partial) Autocorrelation Function] [partial autocorre...] [2016-12-17 09:42:14] [e4ec2dc388263dc7bca2f210fca20b5e] [Current]
Feedback Forum

Post a new message
Dataseries X:
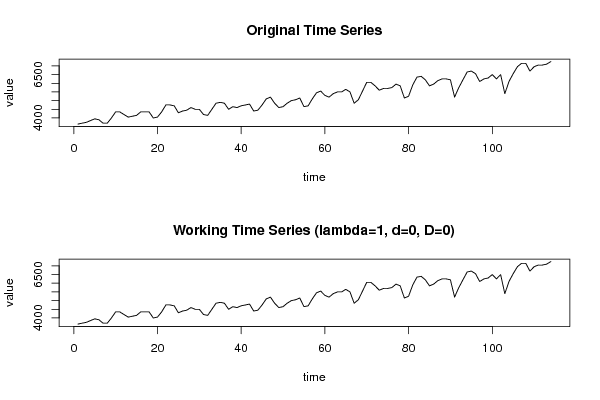
3650
3700
3750
3850
3950
3900
3700
3700
4000
4350
4350
4200
4050
4100
4150
4350
4350
4350
4000
4050
4350
4750
4750
4700
4300
4400
4450
4600
4500
4500
4200
4150
4500
4850
4900
4850
4500
4650
4600
4700
4750
4800
4400
4450
4750
5100
5200
4850
4600
4650
4850
5000
5050
5150
4650
4700
5100
5450
5550
5300
5200
5400
5500
5500
5650
5500
4850
5050
5550
6050
6050
5850
5600
5700
5700
5750
5950
5850
5150
5250
5900
6350
6400
6200
5850
5950
6150
6250
6250
6200
5200
5750
6200
6650
6700
6550
6100
6250
6300
6500
6250
6500
5400
6100
6550
6950
7150
7150
6700
6950
7050
7050
7100
7250


Summary of computational transaction
Raw Input view raw input (R code)
Raw Outputview raw output of R engine
Computing time1 seconds
R ServerBig Analytics Cloud Computing Center

\begin{tabular}{lllllllll}
\hline
Summary of computational transaction \tabularnewline
Raw Input view raw input (R code)  \tabularnewline
Raw Outputview raw output of R engine  \tabularnewline
Computing time1 seconds \tabularnewline
R ServerBig Analytics Cloud Computing Center \tabularnewline
\hline
\end{tabular}
%Source: https://freestatistics.org/blog/index.php?pk=300649&T=0

[TABLE]
[ROW]
Summary of computational transaction[/C][/ROW] [ROW]Raw Input[/C] view raw input (R code) [/C][/ROW] [ROW]Raw Output[/C]view raw output of R engine [/C][/ROW] [ROW]Computing time[/C]1 seconds[/C][/ROW] [ROW]R Server[/C]Big Analytics Cloud Computing Center[/C][/ROW] [/TABLE] Source: https://freestatistics.org/blog/index.php?pk=300649&T=0

Globally Unique Identifier (entire table): ba.freestatistics.org/blog/index.php?pk=300649&T=0

As an alternative you can also use a QR Code:  

The GUIDs for individual cells are displayed in the table below:

Summary of computational transaction
Raw Input view raw input (R code)
Raw Outputview raw output of R engine
Computing time1 seconds
R ServerBig Analytics Cloud Computing Center


Autocorrelation Function
Time lag kACF(k)T-STATP-value
10.9207469.83090
20.8379318.94670
30.7788.30680
40.7652938.17110
50.7697618.21880
60.7707088.22890
70.709747.57790
80.6410546.84460
90.5933226.33490
100.6009836.41670
110.6380166.81210
120.6730537.18620
130.6104996.51830
140.5436315.80440
150.4972165.30880
160.4946585.28150
170.5057175.39960
180.510945.45530
190.4604094.91581e-06
200.3980574.25012.2e-05
210.3558183.79910.000117
220.3630693.87658.9e-05
230.3996934.26762.1e-05
240.4282844.57286e-06
250.3746063.99975.7e-05
260.3115733.32670.000592
270.2716192.90010.002238
280.2645662.82480.002793
290.2699822.88260.002357
300.2685242.86710.002468
310.2226312.3770.009559
320.163271.74330.041993
330.1235411.31910.094897
340.1276881.36330.087732
350.159871.70690.045278
360.178161.90220.029832
370.1312491.40140.081912
380.0770910.82310.206082
390.0439680.46950.319821
400.0380860.40660.342516
410.0416880.44510.328545
420.0383450.40940.341502
43-0.003394-0.03620.485579
44-0.056443-0.60260.273971
45-0.091627-0.97830.164996
46-0.087871-0.93820.17506
47-0.061975-0.66170.254747
48-0.050809-0.54250.294271

\begin{tabular}{lllllllll}
\hline
Autocorrelation Function \tabularnewline
Time lag k & ACF(k) & T-STAT & P-value \tabularnewline
1 & 0.920746 & 9.8309 & 0 \tabularnewline
2 & 0.837931 & 8.9467 & 0 \tabularnewline
3 & 0.778 & 8.3068 & 0 \tabularnewline
4 & 0.765293 & 8.1711 & 0 \tabularnewline
5 & 0.769761 & 8.2188 & 0 \tabularnewline
6 & 0.770708 & 8.2289 & 0 \tabularnewline
7 & 0.70974 & 7.5779 & 0 \tabularnewline
8 & 0.641054 & 6.8446 & 0 \tabularnewline
9 & 0.593322 & 6.3349 & 0 \tabularnewline
10 & 0.600983 & 6.4167 & 0 \tabularnewline
11 & 0.638016 & 6.8121 & 0 \tabularnewline
12 & 0.673053 & 7.1862 & 0 \tabularnewline
13 & 0.610499 & 6.5183 & 0 \tabularnewline
14 & 0.543631 & 5.8044 & 0 \tabularnewline
15 & 0.497216 & 5.3088 & 0 \tabularnewline
16 & 0.494658 & 5.2815 & 0 \tabularnewline
17 & 0.505717 & 5.3996 & 0 \tabularnewline
18 & 0.51094 & 5.4553 & 0 \tabularnewline
19 & 0.460409 & 4.9158 & 1e-06 \tabularnewline
20 & 0.398057 & 4.2501 & 2.2e-05 \tabularnewline
21 & 0.355818 & 3.7991 & 0.000117 \tabularnewline
22 & 0.363069 & 3.8765 & 8.9e-05 \tabularnewline
23 & 0.399693 & 4.2676 & 2.1e-05 \tabularnewline
24 & 0.428284 & 4.5728 & 6e-06 \tabularnewline
25 & 0.374606 & 3.9997 & 5.7e-05 \tabularnewline
26 & 0.311573 & 3.3267 & 0.000592 \tabularnewline
27 & 0.271619 & 2.9001 & 0.002238 \tabularnewline
28 & 0.264566 & 2.8248 & 0.002793 \tabularnewline
29 & 0.269982 & 2.8826 & 0.002357 \tabularnewline
30 & 0.268524 & 2.8671 & 0.002468 \tabularnewline
31 & 0.222631 & 2.377 & 0.009559 \tabularnewline
32 & 0.16327 & 1.7433 & 0.041993 \tabularnewline
33 & 0.123541 & 1.3191 & 0.094897 \tabularnewline
34 & 0.127688 & 1.3633 & 0.087732 \tabularnewline
35 & 0.15987 & 1.7069 & 0.045278 \tabularnewline
36 & 0.17816 & 1.9022 & 0.029832 \tabularnewline
37 & 0.131249 & 1.4014 & 0.081912 \tabularnewline
38 & 0.077091 & 0.8231 & 0.206082 \tabularnewline
39 & 0.043968 & 0.4695 & 0.319821 \tabularnewline
40 & 0.038086 & 0.4066 & 0.342516 \tabularnewline
41 & 0.041688 & 0.4451 & 0.328545 \tabularnewline
42 & 0.038345 & 0.4094 & 0.341502 \tabularnewline
43 & -0.003394 & -0.0362 & 0.485579 \tabularnewline
44 & -0.056443 & -0.6026 & 0.273971 \tabularnewline
45 & -0.091627 & -0.9783 & 0.164996 \tabularnewline
46 & -0.087871 & -0.9382 & 0.17506 \tabularnewline
47 & -0.061975 & -0.6617 & 0.254747 \tabularnewline
48 & -0.050809 & -0.5425 & 0.294271 \tabularnewline
\hline
\end{tabular}
%Source: https://freestatistics.org/blog/index.php?pk=300649&T=1

[TABLE]
[ROW][C]Autocorrelation Function[/C][/ROW]
[ROW][C]Time lag k[/C][C]ACF(k)[/C][C]T-STAT[/C][C]P-value[/C][/ROW]
[ROW][C]1[/C][C]0.920746[/C][C]9.8309[/C][C]0[/C][/ROW]
[ROW][C]2[/C][C]0.837931[/C][C]8.9467[/C][C]0[/C][/ROW]
[ROW][C]3[/C][C]0.778[/C][C]8.3068[/C][C]0[/C][/ROW]
[ROW][C]4[/C][C]0.765293[/C][C]8.1711[/C][C]0[/C][/ROW]
[ROW][C]5[/C][C]0.769761[/C][C]8.2188[/C][C]0[/C][/ROW]
[ROW][C]6[/C][C]0.770708[/C][C]8.2289[/C][C]0[/C][/ROW]
[ROW][C]7[/C][C]0.70974[/C][C]7.5779[/C][C]0[/C][/ROW]
[ROW][C]8[/C][C]0.641054[/C][C]6.8446[/C][C]0[/C][/ROW]
[ROW][C]9[/C][C]0.593322[/C][C]6.3349[/C][C]0[/C][/ROW]
[ROW][C]10[/C][C]0.600983[/C][C]6.4167[/C][C]0[/C][/ROW]
[ROW][C]11[/C][C]0.638016[/C][C]6.8121[/C][C]0[/C][/ROW]
[ROW][C]12[/C][C]0.673053[/C][C]7.1862[/C][C]0[/C][/ROW]
[ROW][C]13[/C][C]0.610499[/C][C]6.5183[/C][C]0[/C][/ROW]
[ROW][C]14[/C][C]0.543631[/C][C]5.8044[/C][C]0[/C][/ROW]
[ROW][C]15[/C][C]0.497216[/C][C]5.3088[/C][C]0[/C][/ROW]
[ROW][C]16[/C][C]0.494658[/C][C]5.2815[/C][C]0[/C][/ROW]
[ROW][C]17[/C][C]0.505717[/C][C]5.3996[/C][C]0[/C][/ROW]
[ROW][C]18[/C][C]0.51094[/C][C]5.4553[/C][C]0[/C][/ROW]
[ROW][C]19[/C][C]0.460409[/C][C]4.9158[/C][C]1e-06[/C][/ROW]
[ROW][C]20[/C][C]0.398057[/C][C]4.2501[/C][C]2.2e-05[/C][/ROW]
[ROW][C]21[/C][C]0.355818[/C][C]3.7991[/C][C]0.000117[/C][/ROW]
[ROW][C]22[/C][C]0.363069[/C][C]3.8765[/C][C]8.9e-05[/C][/ROW]
[ROW][C]23[/C][C]0.399693[/C][C]4.2676[/C][C]2.1e-05[/C][/ROW]
[ROW][C]24[/C][C]0.428284[/C][C]4.5728[/C][C]6e-06[/C][/ROW]
[ROW][C]25[/C][C]0.374606[/C][C]3.9997[/C][C]5.7e-05[/C][/ROW]
[ROW][C]26[/C][C]0.311573[/C][C]3.3267[/C][C]0.000592[/C][/ROW]
[ROW][C]27[/C][C]0.271619[/C][C]2.9001[/C][C]0.002238[/C][/ROW]
[ROW][C]28[/C][C]0.264566[/C][C]2.8248[/C][C]0.002793[/C][/ROW]
[ROW][C]29[/C][C]0.269982[/C][C]2.8826[/C][C]0.002357[/C][/ROW]
[ROW][C]30[/C][C]0.268524[/C][C]2.8671[/C][C]0.002468[/C][/ROW]
[ROW][C]31[/C][C]0.222631[/C][C]2.377[/C][C]0.009559[/C][/ROW]
[ROW][C]32[/C][C]0.16327[/C][C]1.7433[/C][C]0.041993[/C][/ROW]
[ROW][C]33[/C][C]0.123541[/C][C]1.3191[/C][C]0.094897[/C][/ROW]
[ROW][C]34[/C][C]0.127688[/C][C]1.3633[/C][C]0.087732[/C][/ROW]
[ROW][C]35[/C][C]0.15987[/C][C]1.7069[/C][C]0.045278[/C][/ROW]
[ROW][C]36[/C][C]0.17816[/C][C]1.9022[/C][C]0.029832[/C][/ROW]
[ROW][C]37[/C][C]0.131249[/C][C]1.4014[/C][C]0.081912[/C][/ROW]
[ROW][C]38[/C][C]0.077091[/C][C]0.8231[/C][C]0.206082[/C][/ROW]
[ROW][C]39[/C][C]0.043968[/C][C]0.4695[/C][C]0.319821[/C][/ROW]
[ROW][C]40[/C][C]0.038086[/C][C]0.4066[/C][C]0.342516[/C][/ROW]
[ROW][C]41[/C][C]0.041688[/C][C]0.4451[/C][C]0.328545[/C][/ROW]
[ROW][C]42[/C][C]0.038345[/C][C]0.4094[/C][C]0.341502[/C][/ROW]
[ROW][C]43[/C][C]-0.003394[/C][C]-0.0362[/C][C]0.485579[/C][/ROW]
[ROW][C]44[/C][C]-0.056443[/C][C]-0.6026[/C][C]0.273971[/C][/ROW]
[ROW][C]45[/C][C]-0.091627[/C][C]-0.9783[/C][C]0.164996[/C][/ROW]
[ROW][C]46[/C][C]-0.087871[/C][C]-0.9382[/C][C]0.17506[/C][/ROW]
[ROW][C]47[/C][C]-0.061975[/C][C]-0.6617[/C][C]0.254747[/C][/ROW]
[ROW][C]48[/C][C]-0.050809[/C][C]-0.5425[/C][C]0.294271[/C][/ROW]
[/TABLE]
Source: https://freestatistics.org/blog/index.php?pk=300649&T=1

Globally Unique Identifier (entire table): ba.freestatistics.org/blog/index.php?pk=300649&T=1

As an alternative you can also use a QR Code:  

The GUIDs for individual cells are displayed in the table below:

Autocorrelation Function
Time lag kACF(k)T-STATP-value
10.9207469.83090
20.8379318.94670
30.7788.30680
40.7652938.17110
50.7697618.21880
60.7707088.22890
70.709747.57790
80.6410546.84460
90.5933226.33490
100.6009836.41670
110.6380166.81210
120.6730537.18620
130.6104996.51830
140.5436315.80440
150.4972165.30880
160.4946585.28150
170.5057175.39960
180.510945.45530
190.4604094.91581e-06
200.3980574.25012.2e-05
210.3558183.79910.000117
220.3630693.87658.9e-05
230.3996934.26762.1e-05
240.4282844.57286e-06
250.3746063.99975.7e-05
260.3115733.32670.000592
270.2716192.90010.002238
280.2645662.82480.002793
290.2699822.88260.002357
300.2685242.86710.002468
310.2226312.3770.009559
320.163271.74330.041993
330.1235411.31910.094897
340.1276881.36330.087732
350.159871.70690.045278
360.178161.90220.029832
370.1312491.40140.081912
380.0770910.82310.206082
390.0439680.46950.319821
400.0380860.40660.342516
410.0416880.44510.328545
420.0383450.40940.341502
43-0.003394-0.03620.485579
44-0.056443-0.60260.273971
45-0.091627-0.97830.164996
46-0.087871-0.93820.17506
47-0.061975-0.66170.254747
48-0.050809-0.54250.294271


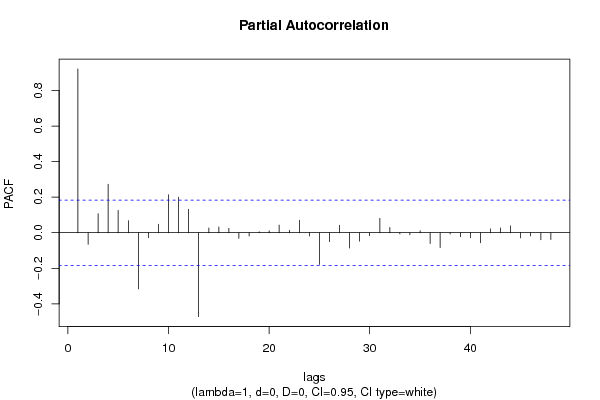
Partial Autocorrelation Function
Time lag kPACF(k)T-STATP-value
10.9207469.83090
2-0.06465-0.69030.245714
30.106381.13580.129205
40.2728552.91330.002152
50.1255071.340.091448
60.0678280.72420.235211
7-0.315946-3.37340.000508
8-0.028271-0.30190.381656
90.0477870.51020.305439
100.2132052.27640.012344
110.1992592.12750.017767
120.1324391.41410.080034
13-0.471837-5.03781e-06
140.0265440.28340.388689
150.031810.33960.367376
160.0246340.2630.396505
17-0.031063-0.33170.370375
18-0.01888-0.20160.420301
190.0054030.05770.47705
200.011290.12050.452133
210.0428670.45770.324022
220.0142330.1520.439742
230.0697330.74450.22904
24-0.018445-0.19690.422114
25-0.17851-1.9060.029586
26-0.050297-0.5370.296148
270.0418210.44650.328033
28-0.085553-0.91350.181464
29-0.047296-0.5050.307273
30-0.016895-0.18040.428582
310.0806130.86070.195602
320.0293710.31360.3772
33-0.006692-0.07150.471581
34-0.011432-0.12210.451534
350.0110290.11780.453232
36-0.060867-0.64990.258538
37-0.083505-0.89160.187246
38-0.007701-0.08220.467307
39-0.023156-0.24720.402586
40-0.028754-0.3070.379698
41-0.056117-0.59920.275126
420.0218140.23290.408126
430.026510.2830.388826
440.0387340.41360.339984
45-0.02899-0.30950.378744
46-0.017605-0.1880.425619
47-0.040009-0.42720.335026
48-0.038195-0.40780.342089

\begin{tabular}{lllllllll}
\hline
Partial Autocorrelation Function \tabularnewline
Time lag k & PACF(k) & T-STAT & P-value \tabularnewline
1 & 0.920746 & 9.8309 & 0 \tabularnewline
2 & -0.06465 & -0.6903 & 0.245714 \tabularnewline
3 & 0.10638 & 1.1358 & 0.129205 \tabularnewline
4 & 0.272855 & 2.9133 & 0.002152 \tabularnewline
5 & 0.125507 & 1.34 & 0.091448 \tabularnewline
6 & 0.067828 & 0.7242 & 0.235211 \tabularnewline
7 & -0.315946 & -3.3734 & 0.000508 \tabularnewline
8 & -0.028271 & -0.3019 & 0.381656 \tabularnewline
9 & 0.047787 & 0.5102 & 0.305439 \tabularnewline
10 & 0.213205 & 2.2764 & 0.012344 \tabularnewline
11 & 0.199259 & 2.1275 & 0.017767 \tabularnewline
12 & 0.132439 & 1.4141 & 0.080034 \tabularnewline
13 & -0.471837 & -5.0378 & 1e-06 \tabularnewline
14 & 0.026544 & 0.2834 & 0.388689 \tabularnewline
15 & 0.03181 & 0.3396 & 0.367376 \tabularnewline
16 & 0.024634 & 0.263 & 0.396505 \tabularnewline
17 & -0.031063 & -0.3317 & 0.370375 \tabularnewline
18 & -0.01888 & -0.2016 & 0.420301 \tabularnewline
19 & 0.005403 & 0.0577 & 0.47705 \tabularnewline
20 & 0.01129 & 0.1205 & 0.452133 \tabularnewline
21 & 0.042867 & 0.4577 & 0.324022 \tabularnewline
22 & 0.014233 & 0.152 & 0.439742 \tabularnewline
23 & 0.069733 & 0.7445 & 0.22904 \tabularnewline
24 & -0.018445 & -0.1969 & 0.422114 \tabularnewline
25 & -0.17851 & -1.906 & 0.029586 \tabularnewline
26 & -0.050297 & -0.537 & 0.296148 \tabularnewline
27 & 0.041821 & 0.4465 & 0.328033 \tabularnewline
28 & -0.085553 & -0.9135 & 0.181464 \tabularnewline
29 & -0.047296 & -0.505 & 0.307273 \tabularnewline
30 & -0.016895 & -0.1804 & 0.428582 \tabularnewline
31 & 0.080613 & 0.8607 & 0.195602 \tabularnewline
32 & 0.029371 & 0.3136 & 0.3772 \tabularnewline
33 & -0.006692 & -0.0715 & 0.471581 \tabularnewline
34 & -0.011432 & -0.1221 & 0.451534 \tabularnewline
35 & 0.011029 & 0.1178 & 0.453232 \tabularnewline
36 & -0.060867 & -0.6499 & 0.258538 \tabularnewline
37 & -0.083505 & -0.8916 & 0.187246 \tabularnewline
38 & -0.007701 & -0.0822 & 0.467307 \tabularnewline
39 & -0.023156 & -0.2472 & 0.402586 \tabularnewline
40 & -0.028754 & -0.307 & 0.379698 \tabularnewline
41 & -0.056117 & -0.5992 & 0.275126 \tabularnewline
42 & 0.021814 & 0.2329 & 0.408126 \tabularnewline
43 & 0.02651 & 0.283 & 0.388826 \tabularnewline
44 & 0.038734 & 0.4136 & 0.339984 \tabularnewline
45 & -0.02899 & -0.3095 & 0.378744 \tabularnewline
46 & -0.017605 & -0.188 & 0.425619 \tabularnewline
47 & -0.040009 & -0.4272 & 0.335026 \tabularnewline
48 & -0.038195 & -0.4078 & 0.342089 \tabularnewline
\hline
\end{tabular}
%Source: https://freestatistics.org/blog/index.php?pk=300649&T=2

[TABLE]
[ROW][C]Partial Autocorrelation Function[/C][/ROW]
[ROW][C]Time lag k[/C][C]PACF(k)[/C][C]T-STAT[/C][C]P-value[/C][/ROW]
[ROW][C]1[/C][C]0.920746[/C][C]9.8309[/C][C]0[/C][/ROW]
[ROW][C]2[/C][C]-0.06465[/C][C]-0.6903[/C][C]0.245714[/C][/ROW]
[ROW][C]3[/C][C]0.10638[/C][C]1.1358[/C][C]0.129205[/C][/ROW]
[ROW][C]4[/C][C]0.272855[/C][C]2.9133[/C][C]0.002152[/C][/ROW]
[ROW][C]5[/C][C]0.125507[/C][C]1.34[/C][C]0.091448[/C][/ROW]
[ROW][C]6[/C][C]0.067828[/C][C]0.7242[/C][C]0.235211[/C][/ROW]
[ROW][C]7[/C][C]-0.315946[/C][C]-3.3734[/C][C]0.000508[/C][/ROW]
[ROW][C]8[/C][C]-0.028271[/C][C]-0.3019[/C][C]0.381656[/C][/ROW]
[ROW][C]9[/C][C]0.047787[/C][C]0.5102[/C][C]0.305439[/C][/ROW]
[ROW][C]10[/C][C]0.213205[/C][C]2.2764[/C][C]0.012344[/C][/ROW]
[ROW][C]11[/C][C]0.199259[/C][C]2.1275[/C][C]0.017767[/C][/ROW]
[ROW][C]12[/C][C]0.132439[/C][C]1.4141[/C][C]0.080034[/C][/ROW]
[ROW][C]13[/C][C]-0.471837[/C][C]-5.0378[/C][C]1e-06[/C][/ROW]
[ROW][C]14[/C][C]0.026544[/C][C]0.2834[/C][C]0.388689[/C][/ROW]
[ROW][C]15[/C][C]0.03181[/C][C]0.3396[/C][C]0.367376[/C][/ROW]
[ROW][C]16[/C][C]0.024634[/C][C]0.263[/C][C]0.396505[/C][/ROW]
[ROW][C]17[/C][C]-0.031063[/C][C]-0.3317[/C][C]0.370375[/C][/ROW]
[ROW][C]18[/C][C]-0.01888[/C][C]-0.2016[/C][C]0.420301[/C][/ROW]
[ROW][C]19[/C][C]0.005403[/C][C]0.0577[/C][C]0.47705[/C][/ROW]
[ROW][C]20[/C][C]0.01129[/C][C]0.1205[/C][C]0.452133[/C][/ROW]
[ROW][C]21[/C][C]0.042867[/C][C]0.4577[/C][C]0.324022[/C][/ROW]
[ROW][C]22[/C][C]0.014233[/C][C]0.152[/C][C]0.439742[/C][/ROW]
[ROW][C]23[/C][C]0.069733[/C][C]0.7445[/C][C]0.22904[/C][/ROW]
[ROW][C]24[/C][C]-0.018445[/C][C]-0.1969[/C][C]0.422114[/C][/ROW]
[ROW][C]25[/C][C]-0.17851[/C][C]-1.906[/C][C]0.029586[/C][/ROW]
[ROW][C]26[/C][C]-0.050297[/C][C]-0.537[/C][C]0.296148[/C][/ROW]
[ROW][C]27[/C][C]0.041821[/C][C]0.4465[/C][C]0.328033[/C][/ROW]
[ROW][C]28[/C][C]-0.085553[/C][C]-0.9135[/C][C]0.181464[/C][/ROW]
[ROW][C]29[/C][C]-0.047296[/C][C]-0.505[/C][C]0.307273[/C][/ROW]
[ROW][C]30[/C][C]-0.016895[/C][C]-0.1804[/C][C]0.428582[/C][/ROW]
[ROW][C]31[/C][C]0.080613[/C][C]0.8607[/C][C]0.195602[/C][/ROW]
[ROW][C]32[/C][C]0.029371[/C][C]0.3136[/C][C]0.3772[/C][/ROW]
[ROW][C]33[/C][C]-0.006692[/C][C]-0.0715[/C][C]0.471581[/C][/ROW]
[ROW][C]34[/C][C]-0.011432[/C][C]-0.1221[/C][C]0.451534[/C][/ROW]
[ROW][C]35[/C][C]0.011029[/C][C]0.1178[/C][C]0.453232[/C][/ROW]
[ROW][C]36[/C][C]-0.060867[/C][C]-0.6499[/C][C]0.258538[/C][/ROW]
[ROW][C]37[/C][C]-0.083505[/C][C]-0.8916[/C][C]0.187246[/C][/ROW]
[ROW][C]38[/C][C]-0.007701[/C][C]-0.0822[/C][C]0.467307[/C][/ROW]
[ROW][C]39[/C][C]-0.023156[/C][C]-0.2472[/C][C]0.402586[/C][/ROW]
[ROW][C]40[/C][C]-0.028754[/C][C]-0.307[/C][C]0.379698[/C][/ROW]
[ROW][C]41[/C][C]-0.056117[/C][C]-0.5992[/C][C]0.275126[/C][/ROW]
[ROW][C]42[/C][C]0.021814[/C][C]0.2329[/C][C]0.408126[/C][/ROW]
[ROW][C]43[/C][C]0.02651[/C][C]0.283[/C][C]0.388826[/C][/ROW]
[ROW][C]44[/C][C]0.038734[/C][C]0.4136[/C][C]0.339984[/C][/ROW]
[ROW][C]45[/C][C]-0.02899[/C][C]-0.3095[/C][C]0.378744[/C][/ROW]
[ROW][C]46[/C][C]-0.017605[/C][C]-0.188[/C][C]0.425619[/C][/ROW]
[ROW][C]47[/C][C]-0.040009[/C][C]-0.4272[/C][C]0.335026[/C][/ROW]
[ROW][C]48[/C][C]-0.038195[/C][C]-0.4078[/C][C]0.342089[/C][/ROW]
[/TABLE]
Source: https://freestatistics.org/blog/index.php?pk=300649&T=2

Globally Unique Identifier (entire table): ba.freestatistics.org/blog/index.php?pk=300649&T=2

As an alternative you can also use a QR Code:  

The GUIDs for individual cells are displayed in the table below:

Partial Autocorrelation Function
Time lag kPACF(k)T-STATP-value
10.9207469.83090
2-0.06465-0.69030.245714
30.106381.13580.129205
40.2728552.91330.002152
50.1255071.340.091448
60.0678280.72420.235211
7-0.315946-3.37340.000508
8-0.028271-0.30190.381656
90.0477870.51020.305439
100.2132052.27640.012344
110.1992592.12750.017767
120.1324391.41410.080034
13-0.471837-5.03781e-06
140.0265440.28340.388689
150.031810.33960.367376
160.0246340.2630.396505
17-0.031063-0.33170.370375
18-0.01888-0.20160.420301
190.0054030.05770.47705
200.011290.12050.452133
210.0428670.45770.324022
220.0142330.1520.439742
230.0697330.74450.22904
24-0.018445-0.19690.422114
25-0.17851-1.9060.029586
26-0.050297-0.5370.296148
270.0418210.44650.328033
28-0.085553-0.91350.181464
29-0.047296-0.5050.307273
30-0.016895-0.18040.428582
310.0806130.86070.195602
320.0293710.31360.3772
33-0.006692-0.07150.471581
34-0.011432-0.12210.451534
350.0110290.11780.453232
36-0.060867-0.64990.258538
37-0.083505-0.89160.187246
38-0.007701-0.08220.467307
39-0.023156-0.24720.402586
40-0.028754-0.3070.379698
41-0.056117-0.59920.275126
420.0218140.23290.408126
430.026510.2830.388826
440.0387340.41360.339984
45-0.02899-0.30950.378744
46-0.017605-0.1880.425619
47-0.040009-0.42720.335026
48-0.038195-0.40780.342089


Parameters (Session):
par1 = 1 ; par2 = 0 ; par3 = 0 ; par4 = 1 ;
Parameters (R input):
par1 = 48 ; par2 = 1 ; par3 = 0 ; par4 = 0 ; par5 = 12 ; par6 = White Noise ; par7 = 0.95 ; par8 = ;
R code (references can be found in the software module):
if (par1 == 'Default') {
par1 = 10*log10(length(x))
} else {
par1 <- as.numeric(par1)
}
par2 <- as.numeric(par2)
par3 <- as.numeric(par3)
par4 <- as.numeric(par4)
par5 <- as.numeric(par5)
if (par6 == 'White Noise') par6 <- 'white' else par6 <- 'ma'
par7 <- as.numeric(par7)
if (par8 != '') par8 <- as.numeric(par8)
x <- na.omit(x)
ox <- x
if (par8 == '') {
if (par2 == 0) {
x <- log(x)
} else {
x <- (x ^ par2 - 1) / par2
}
} else {
x <- log(x,base=par8)
}
if (par3 > 0) x <- diff(x,lag=1,difference=par3)
if (par4 > 0) x <- diff(x,lag=par5,difference=par4)
bitmap(file='picts.png')
op <- par(mfrow=c(2,1))
plot(ox,type='l',main='Original Time Series',xlab='time',ylab='value')
if (par8=='') {
mytitle <- paste('Working Time Series (lambda=',par2,', d=',par3,', D=',par4,')',sep='')
mysub <- paste('(lambda=',par2,', d=',par3,', D=',par4,', CI=', par7, ', CI type=',par6,')',sep='')
} else {
mytitle <- paste('Working Time Series (base=',par8,', d=',par3,', D=',par4,')',sep='')
mysub <- paste('(base=',par8,', d=',par3,', D=',par4,', CI=', par7, ', CI type=',par6,')',sep='')
}
plot(x,type='l', main=mytitle,xlab='time',ylab='value')
par(op)
dev.off()
bitmap(file='pic1.png')
racf <- acf(x, par1, main='Autocorrelation', xlab='time lag', ylab='ACF', ci.type=par6, ci=par7, sub=mysub)
dev.off()
bitmap(file='pic2.png')
rpacf <- pacf(x,par1,main='Partial Autocorrelation',xlab='lags',ylab='PACF',sub=mysub)
dev.off()
(myacf <- c(racf$acf))
(mypacf <- c(rpacf$acf))
lengthx <- length(x)
sqrtn <- sqrt(lengthx)
load(file='createtable')
a<-table.start()
a<-table.row.start(a)
a<-table.element(a,'Autocorrelation Function',4,TRUE)
a<-table.row.end(a)
a<-table.row.start(a)
a<-table.element(a,'Time lag k',header=TRUE)
a<-table.element(a,'ACF(k)',header=TRUE)
a<-table.element(a,'T-STAT',header=TRUE)
a<-table.element(a,'P-value',header=TRUE)
a<-table.row.end(a)
for (i in 2:(par1+1)) {
a<-table.row.start(a)
a<-table.element(a,i-1,header=TRUE)
a<-table.element(a,round(myacf[i],6))
mytstat <- myacf[i]*sqrtn
a<-table.element(a,round(mytstat,4))
a<-table.element(a,round(1-pt(abs(mytstat),lengthx),6))
a<-table.row.end(a)
}
a<-table.end(a)
table.save(a,file='mytable.tab')
a<-table.start()
a<-table.row.start(a)
a<-table.element(a,'Partial Autocorrelation Function',4,TRUE)
a<-table.row.end(a)
a<-table.row.start(a)
a<-table.element(a,'Time lag k',header=TRUE)
a<-table.element(a,'PACF(k)',header=TRUE)
a<-table.element(a,'T-STAT',header=TRUE)
a<-table.element(a,'P-value',header=TRUE)
a<-table.row.end(a)
for (i in 1:par1) {
a<-table.row.start(a)
a<-table.element(a,i,header=TRUE)
a<-table.element(a,round(mypacf[i],6))
mytstat <- mypacf[i]*sqrtn
a<-table.element(a,round(mytstat,4))
a<-table.element(a,round(1-pt(abs(mytstat),lengthx),6))
a<-table.row.end(a)
}
a<-table.end(a)
table.save(a,file='mytable1.tab')