Free Statistics

of Irreproducible Research!

Author's title

Author*The author of this computation has been verified*
R Software Modulerwasp_autocorrelation.wasp
Title produced by software(Partial) Autocorrelation Function
Date of computationFri, 16 Dec 2016 21:14:08 +0100
Cite this page as followsStatistical Computations at FreeStatistics.org, Office for Research Development and Education, URL https://freestatistics.org/blog/index.php?v=date/2016/Dec/16/t1481919278yo9yuuo1707w2qt.htm/, Retrieved Fri, 01 Nov 2024 03:27:52 +0000
Statistical Computations at FreeStatistics.org, Office for Research Development and Education, URL https://freestatistics.org/blog/index.php?pk=300535, Retrieved Fri, 01 Nov 2024 03:27:52 +0000
QR Codes:

Original text written by user:
IsPrivate?No (this computation is public)
User-defined keywords
Estimated Impact75
Family? (F = Feedback message, R = changed R code, M = changed R Module, P = changed Parameters, D = changed Data)
-       [(Partial) Autocorrelation Function] [] [2016-12-16 20:14:08] [404ac5ee4f7301873f6a96ef36861981] [Current]
Feedback Forum

Post a new message
Dataseries X:
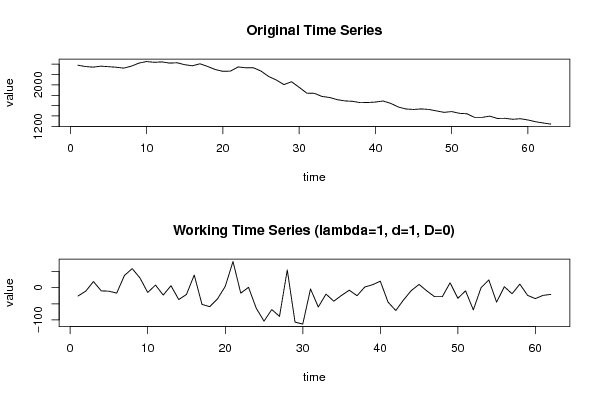
2380
2354
2343
2362
2352
2341
2324
2362
2421
2451
2436
2444
2421
2427
2390
2369
2408
2356
2297
2262
2266
2347
2330
2331
2267
2163
2095
2006
2061
1954
1841
1837
1777
1757
1715
1691
1683
1658
1660
1669
1689
1644
1573
1535
1526
1536
1526
1498
1470
1485
1452
1442
1373
1373
1397
1352
1355
1336
1347
1323
1289
1265
1244


Summary of computational transaction
Raw Input view raw input (R code)
Raw Outputview raw output of R engine
Computing time2 seconds
R ServerBig Analytics Cloud Computing Center

\begin{tabular}{lllllllll}
\hline
Summary of computational transaction \tabularnewline
Raw Input view raw input (R code)  \tabularnewline
Raw Outputview raw output of R engine  \tabularnewline
Computing time2 seconds \tabularnewline
R ServerBig Analytics Cloud Computing Center \tabularnewline
\hline
\end{tabular}
%Source: https://freestatistics.org/blog/index.php?pk=300535&T=0

[TABLE]
[ROW]
Summary of computational transaction[/C][/ROW] [ROW]Raw Input[/C] view raw input (R code) [/C][/ROW] [ROW]Raw Output[/C]view raw output of R engine [/C][/ROW] [ROW]Computing time[/C]2 seconds[/C][/ROW] [ROW]R Server[/C]Big Analytics Cloud Computing Center[/C][/ROW] [/TABLE] Source: https://freestatistics.org/blog/index.php?pk=300535&T=0

Globally Unique Identifier (entire table): ba.freestatistics.org/blog/index.php?pk=300535&T=0

As an alternative you can also use a QR Code:  

The GUIDs for individual cells are displayed in the table below:

Summary of computational transaction
Raw Input view raw input (R code)
Raw Outputview raw output of R engine
Computing time2 seconds
R ServerBig Analytics Cloud Computing Center


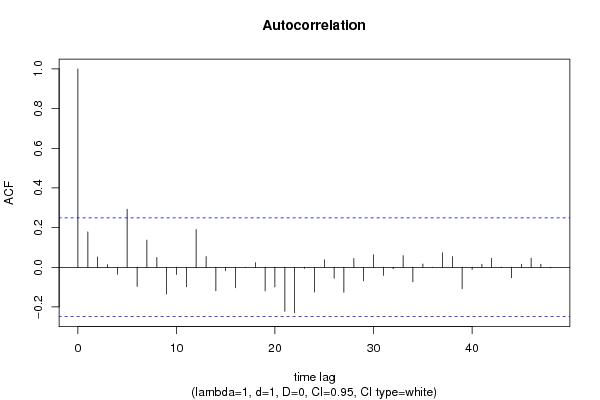
Autocorrelation Function
Time lag kACF(k)T-STATP-value
10.1784151.40480.082529
20.0514740.40530.343324
30.0135460.10670.457701
4-0.035746-0.28150.389645
50.2931092.30790.012176
6-0.096293-0.75820.225598
70.1370561.07920.142344
80.0495730.39030.348813
9-0.135051-1.06340.145865
10-0.036794-0.28970.386501
11-0.098535-0.77590.220388
120.1902921.49840.069558
130.053950.42480.336224
14-0.118778-0.93530.176641
15-0.017658-0.1390.444935
16-0.103448-0.81450.209224
17-0.001612-0.01270.494956
180.0236270.1860.426512
19-0.118971-0.93680.176253
20-0.099023-0.77970.219264
21-0.221781-1.74630.042856
22-0.229511-1.80720.037794
23-0.005382-0.04240.483166
24-0.124965-0.9840.164477
250.037530.29550.384295
26-0.055195-0.43460.332678
27-0.125811-0.99060.162857
280.0439170.34580.365332
29-0.068085-0.53610.296903
300.0634220.49940.309638
31-0.04094-0.32240.37413
32-0.006979-0.05490.478178
330.0589650.46430.322031
34-0.073182-0.57620.283271
350.0167090.13160.447878
360.0001129e-040.499648
370.0731890.57630.283253
380.0539370.42470.336264
39-0.108255-0.85240.198636
40-0.010462-0.08240.467306
410.0152250.11990.452482
420.0448090.35280.362707
43-0.000694-0.00550.497828
44-0.052892-0.41650.339251
450.0155360.12230.451518
460.0453120.35680.361232
470.0152910.12040.452278
48-0.002648-0.02080.491716

\begin{tabular}{lllllllll}
\hline
Autocorrelation Function \tabularnewline
Time lag k & ACF(k) & T-STAT & P-value \tabularnewline
1 & 0.178415 & 1.4048 & 0.082529 \tabularnewline
2 & 0.051474 & 0.4053 & 0.343324 \tabularnewline
3 & 0.013546 & 0.1067 & 0.457701 \tabularnewline
4 & -0.035746 & -0.2815 & 0.389645 \tabularnewline
5 & 0.293109 & 2.3079 & 0.012176 \tabularnewline
6 & -0.096293 & -0.7582 & 0.225598 \tabularnewline
7 & 0.137056 & 1.0792 & 0.142344 \tabularnewline
8 & 0.049573 & 0.3903 & 0.348813 \tabularnewline
9 & -0.135051 & -1.0634 & 0.145865 \tabularnewline
10 & -0.036794 & -0.2897 & 0.386501 \tabularnewline
11 & -0.098535 & -0.7759 & 0.220388 \tabularnewline
12 & 0.190292 & 1.4984 & 0.069558 \tabularnewline
13 & 0.05395 & 0.4248 & 0.336224 \tabularnewline
14 & -0.118778 & -0.9353 & 0.176641 \tabularnewline
15 & -0.017658 & -0.139 & 0.444935 \tabularnewline
16 & -0.103448 & -0.8145 & 0.209224 \tabularnewline
17 & -0.001612 & -0.0127 & 0.494956 \tabularnewline
18 & 0.023627 & 0.186 & 0.426512 \tabularnewline
19 & -0.118971 & -0.9368 & 0.176253 \tabularnewline
20 & -0.099023 & -0.7797 & 0.219264 \tabularnewline
21 & -0.221781 & -1.7463 & 0.042856 \tabularnewline
22 & -0.229511 & -1.8072 & 0.037794 \tabularnewline
23 & -0.005382 & -0.0424 & 0.483166 \tabularnewline
24 & -0.124965 & -0.984 & 0.164477 \tabularnewline
25 & 0.03753 & 0.2955 & 0.384295 \tabularnewline
26 & -0.055195 & -0.4346 & 0.332678 \tabularnewline
27 & -0.125811 & -0.9906 & 0.162857 \tabularnewline
28 & 0.043917 & 0.3458 & 0.365332 \tabularnewline
29 & -0.068085 & -0.5361 & 0.296903 \tabularnewline
30 & 0.063422 & 0.4994 & 0.309638 \tabularnewline
31 & -0.04094 & -0.3224 & 0.37413 \tabularnewline
32 & -0.006979 & -0.0549 & 0.478178 \tabularnewline
33 & 0.058965 & 0.4643 & 0.322031 \tabularnewline
34 & -0.073182 & -0.5762 & 0.283271 \tabularnewline
35 & 0.016709 & 0.1316 & 0.447878 \tabularnewline
36 & 0.000112 & 9e-04 & 0.499648 \tabularnewline
37 & 0.073189 & 0.5763 & 0.283253 \tabularnewline
38 & 0.053937 & 0.4247 & 0.336264 \tabularnewline
39 & -0.108255 & -0.8524 & 0.198636 \tabularnewline
40 & -0.010462 & -0.0824 & 0.467306 \tabularnewline
41 & 0.015225 & 0.1199 & 0.452482 \tabularnewline
42 & 0.044809 & 0.3528 & 0.362707 \tabularnewline
43 & -0.000694 & -0.0055 & 0.497828 \tabularnewline
44 & -0.052892 & -0.4165 & 0.339251 \tabularnewline
45 & 0.015536 & 0.1223 & 0.451518 \tabularnewline
46 & 0.045312 & 0.3568 & 0.361232 \tabularnewline
47 & 0.015291 & 0.1204 & 0.452278 \tabularnewline
48 & -0.002648 & -0.0208 & 0.491716 \tabularnewline
\hline
\end{tabular}
%Source: https://freestatistics.org/blog/index.php?pk=300535&T=1

[TABLE]
[ROW][C]Autocorrelation Function[/C][/ROW]
[ROW][C]Time lag k[/C][C]ACF(k)[/C][C]T-STAT[/C][C]P-value[/C][/ROW]
[ROW][C]1[/C][C]0.178415[/C][C]1.4048[/C][C]0.082529[/C][/ROW]
[ROW][C]2[/C][C]0.051474[/C][C]0.4053[/C][C]0.343324[/C][/ROW]
[ROW][C]3[/C][C]0.013546[/C][C]0.1067[/C][C]0.457701[/C][/ROW]
[ROW][C]4[/C][C]-0.035746[/C][C]-0.2815[/C][C]0.389645[/C][/ROW]
[ROW][C]5[/C][C]0.293109[/C][C]2.3079[/C][C]0.012176[/C][/ROW]
[ROW][C]6[/C][C]-0.096293[/C][C]-0.7582[/C][C]0.225598[/C][/ROW]
[ROW][C]7[/C][C]0.137056[/C][C]1.0792[/C][C]0.142344[/C][/ROW]
[ROW][C]8[/C][C]0.049573[/C][C]0.3903[/C][C]0.348813[/C][/ROW]
[ROW][C]9[/C][C]-0.135051[/C][C]-1.0634[/C][C]0.145865[/C][/ROW]
[ROW][C]10[/C][C]-0.036794[/C][C]-0.2897[/C][C]0.386501[/C][/ROW]
[ROW][C]11[/C][C]-0.098535[/C][C]-0.7759[/C][C]0.220388[/C][/ROW]
[ROW][C]12[/C][C]0.190292[/C][C]1.4984[/C][C]0.069558[/C][/ROW]
[ROW][C]13[/C][C]0.05395[/C][C]0.4248[/C][C]0.336224[/C][/ROW]
[ROW][C]14[/C][C]-0.118778[/C][C]-0.9353[/C][C]0.176641[/C][/ROW]
[ROW][C]15[/C][C]-0.017658[/C][C]-0.139[/C][C]0.444935[/C][/ROW]
[ROW][C]16[/C][C]-0.103448[/C][C]-0.8145[/C][C]0.209224[/C][/ROW]
[ROW][C]17[/C][C]-0.001612[/C][C]-0.0127[/C][C]0.494956[/C][/ROW]
[ROW][C]18[/C][C]0.023627[/C][C]0.186[/C][C]0.426512[/C][/ROW]
[ROW][C]19[/C][C]-0.118971[/C][C]-0.9368[/C][C]0.176253[/C][/ROW]
[ROW][C]20[/C][C]-0.099023[/C][C]-0.7797[/C][C]0.219264[/C][/ROW]
[ROW][C]21[/C][C]-0.221781[/C][C]-1.7463[/C][C]0.042856[/C][/ROW]
[ROW][C]22[/C][C]-0.229511[/C][C]-1.8072[/C][C]0.037794[/C][/ROW]
[ROW][C]23[/C][C]-0.005382[/C][C]-0.0424[/C][C]0.483166[/C][/ROW]
[ROW][C]24[/C][C]-0.124965[/C][C]-0.984[/C][C]0.164477[/C][/ROW]
[ROW][C]25[/C][C]0.03753[/C][C]0.2955[/C][C]0.384295[/C][/ROW]
[ROW][C]26[/C][C]-0.055195[/C][C]-0.4346[/C][C]0.332678[/C][/ROW]
[ROW][C]27[/C][C]-0.125811[/C][C]-0.9906[/C][C]0.162857[/C][/ROW]
[ROW][C]28[/C][C]0.043917[/C][C]0.3458[/C][C]0.365332[/C][/ROW]
[ROW][C]29[/C][C]-0.068085[/C][C]-0.5361[/C][C]0.296903[/C][/ROW]
[ROW][C]30[/C][C]0.063422[/C][C]0.4994[/C][C]0.309638[/C][/ROW]
[ROW][C]31[/C][C]-0.04094[/C][C]-0.3224[/C][C]0.37413[/C][/ROW]
[ROW][C]32[/C][C]-0.006979[/C][C]-0.0549[/C][C]0.478178[/C][/ROW]
[ROW][C]33[/C][C]0.058965[/C][C]0.4643[/C][C]0.322031[/C][/ROW]
[ROW][C]34[/C][C]-0.073182[/C][C]-0.5762[/C][C]0.283271[/C][/ROW]
[ROW][C]35[/C][C]0.016709[/C][C]0.1316[/C][C]0.447878[/C][/ROW]
[ROW][C]36[/C][C]0.000112[/C][C]9e-04[/C][C]0.499648[/C][/ROW]
[ROW][C]37[/C][C]0.073189[/C][C]0.5763[/C][C]0.283253[/C][/ROW]
[ROW][C]38[/C][C]0.053937[/C][C]0.4247[/C][C]0.336264[/C][/ROW]
[ROW][C]39[/C][C]-0.108255[/C][C]-0.8524[/C][C]0.198636[/C][/ROW]
[ROW][C]40[/C][C]-0.010462[/C][C]-0.0824[/C][C]0.467306[/C][/ROW]
[ROW][C]41[/C][C]0.015225[/C][C]0.1199[/C][C]0.452482[/C][/ROW]
[ROW][C]42[/C][C]0.044809[/C][C]0.3528[/C][C]0.362707[/C][/ROW]
[ROW][C]43[/C][C]-0.000694[/C][C]-0.0055[/C][C]0.497828[/C][/ROW]
[ROW][C]44[/C][C]-0.052892[/C][C]-0.4165[/C][C]0.339251[/C][/ROW]
[ROW][C]45[/C][C]0.015536[/C][C]0.1223[/C][C]0.451518[/C][/ROW]
[ROW][C]46[/C][C]0.045312[/C][C]0.3568[/C][C]0.361232[/C][/ROW]
[ROW][C]47[/C][C]0.015291[/C][C]0.1204[/C][C]0.452278[/C][/ROW]
[ROW][C]48[/C][C]-0.002648[/C][C]-0.0208[/C][C]0.491716[/C][/ROW]
[/TABLE]
Source: https://freestatistics.org/blog/index.php?pk=300535&T=1

Globally Unique Identifier (entire table): ba.freestatistics.org/blog/index.php?pk=300535&T=1

As an alternative you can also use a QR Code:  

The GUIDs for individual cells are displayed in the table below:

Autocorrelation Function
Time lag kACF(k)T-STATP-value
10.1784151.40480.082529
20.0514740.40530.343324
30.0135460.10670.457701
4-0.035746-0.28150.389645
50.2931092.30790.012176
6-0.096293-0.75820.225598
70.1370561.07920.142344
80.0495730.39030.348813
9-0.135051-1.06340.145865
10-0.036794-0.28970.386501
11-0.098535-0.77590.220388
120.1902921.49840.069558
130.053950.42480.336224
14-0.118778-0.93530.176641
15-0.017658-0.1390.444935
16-0.103448-0.81450.209224
17-0.001612-0.01270.494956
180.0236270.1860.426512
19-0.118971-0.93680.176253
20-0.099023-0.77970.219264
21-0.221781-1.74630.042856
22-0.229511-1.80720.037794
23-0.005382-0.04240.483166
24-0.124965-0.9840.164477
250.037530.29550.384295
26-0.055195-0.43460.332678
27-0.125811-0.99060.162857
280.0439170.34580.365332
29-0.068085-0.53610.296903
300.0634220.49940.309638
31-0.04094-0.32240.37413
32-0.006979-0.05490.478178
330.0589650.46430.322031
34-0.073182-0.57620.283271
350.0167090.13160.447878
360.0001129e-040.499648
370.0731890.57630.283253
380.0539370.42470.336264
39-0.108255-0.85240.198636
40-0.010462-0.08240.467306
410.0152250.11990.452482
420.0448090.35280.362707
43-0.000694-0.00550.497828
44-0.052892-0.41650.339251
450.0155360.12230.451518
460.0453120.35680.361232
470.0152910.12040.452278
48-0.002648-0.02080.491716


Partial Autocorrelation Function
Time lag kPACF(k)T-STATP-value
10.1784151.40480.082529
20.0202880.15970.4368
30.000960.00760.496997
4-0.04063-0.31990.375051
50.3166192.49310.007674
6-0.232615-1.83160.035907
70.2281931.79680.03862
8-0.054295-0.42750.33524
9-0.116698-0.91890.18086
10-0.118778-0.93530.176642
110.0957340.75380.226909
120.0787710.62020.268684
130.008190.06450.474394
14-0.101786-0.80150.212962
150.0377820.29750.38354
16-0.075476-0.59430.277238
17-0.04603-0.36240.359127
180.0834540.65710.256768
19-0.171357-1.34930.091079
20-0.138571-1.09110.139724
21-0.090809-0.7150.238638
22-0.151766-1.1950.118318
230.0633020.49840.309969
24-0.128962-1.01540.156919
250.1053630.82960.204965
26-0.032584-0.25660.399181
27-0.004212-0.03320.486823
280.0232010.18270.42782
290.0679670.53520.297224
30-0.146597-1.15430.126402
31-0.00251-0.01980.492148
320.0626790.49350.31169
33-0.014404-0.11340.455033
340.0060040.04730.481223
35-0.048608-0.38270.351611
360.0530.41730.338941
370.0140160.11040.45624
38-0.019598-0.15430.438931
39-0.08151-0.64180.261682
40-0.054386-0.42820.334981
41-0.084774-0.66750.253462
420.018380.14470.442699
43-0.111622-0.87890.19142
44-0.061517-0.48440.314909
45-0.004818-0.03790.48493
460.0519360.40890.341993
470.0320570.25240.400776
48-0.038795-0.30550.380514

\begin{tabular}{lllllllll}
\hline
Partial Autocorrelation Function \tabularnewline
Time lag k & PACF(k) & T-STAT & P-value \tabularnewline
1 & 0.178415 & 1.4048 & 0.082529 \tabularnewline
2 & 0.020288 & 0.1597 & 0.4368 \tabularnewline
3 & 0.00096 & 0.0076 & 0.496997 \tabularnewline
4 & -0.04063 & -0.3199 & 0.375051 \tabularnewline
5 & 0.316619 & 2.4931 & 0.007674 \tabularnewline
6 & -0.232615 & -1.8316 & 0.035907 \tabularnewline
7 & 0.228193 & 1.7968 & 0.03862 \tabularnewline
8 & -0.054295 & -0.4275 & 0.33524 \tabularnewline
9 & -0.116698 & -0.9189 & 0.18086 \tabularnewline
10 & -0.118778 & -0.9353 & 0.176642 \tabularnewline
11 & 0.095734 & 0.7538 & 0.226909 \tabularnewline
12 & 0.078771 & 0.6202 & 0.268684 \tabularnewline
13 & 0.00819 & 0.0645 & 0.474394 \tabularnewline
14 & -0.101786 & -0.8015 & 0.212962 \tabularnewline
15 & 0.037782 & 0.2975 & 0.38354 \tabularnewline
16 & -0.075476 & -0.5943 & 0.277238 \tabularnewline
17 & -0.04603 & -0.3624 & 0.359127 \tabularnewline
18 & 0.083454 & 0.6571 & 0.256768 \tabularnewline
19 & -0.171357 & -1.3493 & 0.091079 \tabularnewline
20 & -0.138571 & -1.0911 & 0.139724 \tabularnewline
21 & -0.090809 & -0.715 & 0.238638 \tabularnewline
22 & -0.151766 & -1.195 & 0.118318 \tabularnewline
23 & 0.063302 & 0.4984 & 0.309969 \tabularnewline
24 & -0.128962 & -1.0154 & 0.156919 \tabularnewline
25 & 0.105363 & 0.8296 & 0.204965 \tabularnewline
26 & -0.032584 & -0.2566 & 0.399181 \tabularnewline
27 & -0.004212 & -0.0332 & 0.486823 \tabularnewline
28 & 0.023201 & 0.1827 & 0.42782 \tabularnewline
29 & 0.067967 & 0.5352 & 0.297224 \tabularnewline
30 & -0.146597 & -1.1543 & 0.126402 \tabularnewline
31 & -0.00251 & -0.0198 & 0.492148 \tabularnewline
32 & 0.062679 & 0.4935 & 0.31169 \tabularnewline
33 & -0.014404 & -0.1134 & 0.455033 \tabularnewline
34 & 0.006004 & 0.0473 & 0.481223 \tabularnewline
35 & -0.048608 & -0.3827 & 0.351611 \tabularnewline
36 & 0.053 & 0.4173 & 0.338941 \tabularnewline
37 & 0.014016 & 0.1104 & 0.45624 \tabularnewline
38 & -0.019598 & -0.1543 & 0.438931 \tabularnewline
39 & -0.08151 & -0.6418 & 0.261682 \tabularnewline
40 & -0.054386 & -0.4282 & 0.334981 \tabularnewline
41 & -0.084774 & -0.6675 & 0.253462 \tabularnewline
42 & 0.01838 & 0.1447 & 0.442699 \tabularnewline
43 & -0.111622 & -0.8789 & 0.19142 \tabularnewline
44 & -0.061517 & -0.4844 & 0.314909 \tabularnewline
45 & -0.004818 & -0.0379 & 0.48493 \tabularnewline
46 & 0.051936 & 0.4089 & 0.341993 \tabularnewline
47 & 0.032057 & 0.2524 & 0.400776 \tabularnewline
48 & -0.038795 & -0.3055 & 0.380514 \tabularnewline
\hline
\end{tabular}
%Source: https://freestatistics.org/blog/index.php?pk=300535&T=2

[TABLE]
[ROW][C]Partial Autocorrelation Function[/C][/ROW]
[ROW][C]Time lag k[/C][C]PACF(k)[/C][C]T-STAT[/C][C]P-value[/C][/ROW]
[ROW][C]1[/C][C]0.178415[/C][C]1.4048[/C][C]0.082529[/C][/ROW]
[ROW][C]2[/C][C]0.020288[/C][C]0.1597[/C][C]0.4368[/C][/ROW]
[ROW][C]3[/C][C]0.00096[/C][C]0.0076[/C][C]0.496997[/C][/ROW]
[ROW][C]4[/C][C]-0.04063[/C][C]-0.3199[/C][C]0.375051[/C][/ROW]
[ROW][C]5[/C][C]0.316619[/C][C]2.4931[/C][C]0.007674[/C][/ROW]
[ROW][C]6[/C][C]-0.232615[/C][C]-1.8316[/C][C]0.035907[/C][/ROW]
[ROW][C]7[/C][C]0.228193[/C][C]1.7968[/C][C]0.03862[/C][/ROW]
[ROW][C]8[/C][C]-0.054295[/C][C]-0.4275[/C][C]0.33524[/C][/ROW]
[ROW][C]9[/C][C]-0.116698[/C][C]-0.9189[/C][C]0.18086[/C][/ROW]
[ROW][C]10[/C][C]-0.118778[/C][C]-0.9353[/C][C]0.176642[/C][/ROW]
[ROW][C]11[/C][C]0.095734[/C][C]0.7538[/C][C]0.226909[/C][/ROW]
[ROW][C]12[/C][C]0.078771[/C][C]0.6202[/C][C]0.268684[/C][/ROW]
[ROW][C]13[/C][C]0.00819[/C][C]0.0645[/C][C]0.474394[/C][/ROW]
[ROW][C]14[/C][C]-0.101786[/C][C]-0.8015[/C][C]0.212962[/C][/ROW]
[ROW][C]15[/C][C]0.037782[/C][C]0.2975[/C][C]0.38354[/C][/ROW]
[ROW][C]16[/C][C]-0.075476[/C][C]-0.5943[/C][C]0.277238[/C][/ROW]
[ROW][C]17[/C][C]-0.04603[/C][C]-0.3624[/C][C]0.359127[/C][/ROW]
[ROW][C]18[/C][C]0.083454[/C][C]0.6571[/C][C]0.256768[/C][/ROW]
[ROW][C]19[/C][C]-0.171357[/C][C]-1.3493[/C][C]0.091079[/C][/ROW]
[ROW][C]20[/C][C]-0.138571[/C][C]-1.0911[/C][C]0.139724[/C][/ROW]
[ROW][C]21[/C][C]-0.090809[/C][C]-0.715[/C][C]0.238638[/C][/ROW]
[ROW][C]22[/C][C]-0.151766[/C][C]-1.195[/C][C]0.118318[/C][/ROW]
[ROW][C]23[/C][C]0.063302[/C][C]0.4984[/C][C]0.309969[/C][/ROW]
[ROW][C]24[/C][C]-0.128962[/C][C]-1.0154[/C][C]0.156919[/C][/ROW]
[ROW][C]25[/C][C]0.105363[/C][C]0.8296[/C][C]0.204965[/C][/ROW]
[ROW][C]26[/C][C]-0.032584[/C][C]-0.2566[/C][C]0.399181[/C][/ROW]
[ROW][C]27[/C][C]-0.004212[/C][C]-0.0332[/C][C]0.486823[/C][/ROW]
[ROW][C]28[/C][C]0.023201[/C][C]0.1827[/C][C]0.42782[/C][/ROW]
[ROW][C]29[/C][C]0.067967[/C][C]0.5352[/C][C]0.297224[/C][/ROW]
[ROW][C]30[/C][C]-0.146597[/C][C]-1.1543[/C][C]0.126402[/C][/ROW]
[ROW][C]31[/C][C]-0.00251[/C][C]-0.0198[/C][C]0.492148[/C][/ROW]
[ROW][C]32[/C][C]0.062679[/C][C]0.4935[/C][C]0.31169[/C][/ROW]
[ROW][C]33[/C][C]-0.014404[/C][C]-0.1134[/C][C]0.455033[/C][/ROW]
[ROW][C]34[/C][C]0.006004[/C][C]0.0473[/C][C]0.481223[/C][/ROW]
[ROW][C]35[/C][C]-0.048608[/C][C]-0.3827[/C][C]0.351611[/C][/ROW]
[ROW][C]36[/C][C]0.053[/C][C]0.4173[/C][C]0.338941[/C][/ROW]
[ROW][C]37[/C][C]0.014016[/C][C]0.1104[/C][C]0.45624[/C][/ROW]
[ROW][C]38[/C][C]-0.019598[/C][C]-0.1543[/C][C]0.438931[/C][/ROW]
[ROW][C]39[/C][C]-0.08151[/C][C]-0.6418[/C][C]0.261682[/C][/ROW]
[ROW][C]40[/C][C]-0.054386[/C][C]-0.4282[/C][C]0.334981[/C][/ROW]
[ROW][C]41[/C][C]-0.084774[/C][C]-0.6675[/C][C]0.253462[/C][/ROW]
[ROW][C]42[/C][C]0.01838[/C][C]0.1447[/C][C]0.442699[/C][/ROW]
[ROW][C]43[/C][C]-0.111622[/C][C]-0.8789[/C][C]0.19142[/C][/ROW]
[ROW][C]44[/C][C]-0.061517[/C][C]-0.4844[/C][C]0.314909[/C][/ROW]
[ROW][C]45[/C][C]-0.004818[/C][C]-0.0379[/C][C]0.48493[/C][/ROW]
[ROW][C]46[/C][C]0.051936[/C][C]0.4089[/C][C]0.341993[/C][/ROW]
[ROW][C]47[/C][C]0.032057[/C][C]0.2524[/C][C]0.400776[/C][/ROW]
[ROW][C]48[/C][C]-0.038795[/C][C]-0.3055[/C][C]0.380514[/C][/ROW]
[/TABLE]
Source: https://freestatistics.org/blog/index.php?pk=300535&T=2

Globally Unique Identifier (entire table): ba.freestatistics.org/blog/index.php?pk=300535&T=2

As an alternative you can also use a QR Code:  

The GUIDs for individual cells are displayed in the table below:

Partial Autocorrelation Function
Time lag kPACF(k)T-STATP-value
10.1784151.40480.082529
20.0202880.15970.4368
30.000960.00760.496997
4-0.04063-0.31990.375051
50.3166192.49310.007674
6-0.232615-1.83160.035907
70.2281931.79680.03862
8-0.054295-0.42750.33524
9-0.116698-0.91890.18086
10-0.118778-0.93530.176642
110.0957340.75380.226909
120.0787710.62020.268684
130.008190.06450.474394
14-0.101786-0.80150.212962
150.0377820.29750.38354
16-0.075476-0.59430.277238
17-0.04603-0.36240.359127
180.0834540.65710.256768
19-0.171357-1.34930.091079
20-0.138571-1.09110.139724
21-0.090809-0.7150.238638
22-0.151766-1.1950.118318
230.0633020.49840.309969
24-0.128962-1.01540.156919
250.1053630.82960.204965
26-0.032584-0.25660.399181
27-0.004212-0.03320.486823
280.0232010.18270.42782
290.0679670.53520.297224
30-0.146597-1.15430.126402
31-0.00251-0.01980.492148
320.0626790.49350.31169
33-0.014404-0.11340.455033
340.0060040.04730.481223
35-0.048608-0.38270.351611
360.0530.41730.338941
370.0140160.11040.45624
38-0.019598-0.15430.438931
39-0.08151-0.64180.261682
40-0.054386-0.42820.334981
41-0.084774-0.66750.253462
420.018380.14470.442699
43-0.111622-0.87890.19142
44-0.061517-0.48440.314909
45-0.004818-0.03790.48493
460.0519360.40890.341993
470.0320570.25240.400776
48-0.038795-0.30550.380514


Parameters (Session):
par1 = 12 ; par2 = Double ; par3 = additive ; par4 = 12 ;
Parameters (R input):
par1 = 48 ; par2 = 1 ; par3 = 1 ; par4 = 0 ; par5 = 12 ; par6 = White Noise ; par7 = 0.95 ; par8 = ;
R code (references can be found in the software module):
par8 <- ''
par7 <- '0.95'
par6 <- 'White Noise'
par5 <- '12'
par4 <- '0'
par3 <- '1'
par2 <- '1'
par1 <- 'Default'
if (par1 == 'Default') {
par1 = 10*log10(length(x))
} else {
par1 <- as.numeric(par1)
}
par2 <- as.numeric(par2)
par3 <- as.numeric(par3)
par4 <- as.numeric(par4)
par5 <- as.numeric(par5)
if (par6 == 'White Noise') par6 <- 'white' else par6 <- 'ma'
par7 <- as.numeric(par7)
if (par8 != '') par8 <- as.numeric(par8)
x <- na.omit(x)
ox <- x
if (par8 == '') {
if (par2 == 0) {
x <- log(x)
} else {
x <- (x ^ par2 - 1) / par2
}
} else {
x <- log(x,base=par8)
}
if (par3 > 0) x <- diff(x,lag=1,difference=par3)
if (par4 > 0) x <- diff(x,lag=par5,difference=par4)
bitmap(file='picts.png')
op <- par(mfrow=c(2,1))
plot(ox,type='l',main='Original Time Series',xlab='time',ylab='value')
if (par8=='') {
mytitle <- paste('Working Time Series (lambda=',par2,', d=',par3,', D=',par4,')',sep='')
mysub <- paste('(lambda=',par2,', d=',par3,', D=',par4,', CI=', par7, ', CI type=',par6,')',sep='')
} else {
mytitle <- paste('Working Time Series (base=',par8,', d=',par3,', D=',par4,')',sep='')
mysub <- paste('(base=',par8,', d=',par3,', D=',par4,', CI=', par7, ', CI type=',par6,')',sep='')
}
plot(x,type='l', main=mytitle,xlab='time',ylab='value')
par(op)
dev.off()
bitmap(file='pic1.png')
racf <- acf(x, par1, main='Autocorrelation', xlab='time lag', ylab='ACF', ci.type=par6, ci=par7, sub=mysub)
dev.off()
bitmap(file='pic2.png')
rpacf <- pacf(x,par1,main='Partial Autocorrelation',xlab='lags',ylab='PACF',sub=mysub)
dev.off()
(myacf <- c(racf$acf))
(mypacf <- c(rpacf$acf))
lengthx <- length(x)
sqrtn <- sqrt(lengthx)
load(file='createtable')
a<-table.start()
a<-table.row.start(a)
a<-table.element(a,'Autocorrelation Function',4,TRUE)
a<-table.row.end(a)
a<-table.row.start(a)
a<-table.element(a,'Time lag k',header=TRUE)
a<-table.element(a,'ACF(k)',header=TRUE)
a<-table.element(a,'T-STAT',header=TRUE)
a<-table.element(a,'P-value',header=TRUE)
a<-table.row.end(a)
for (i in 2:(par1+1)) {
a<-table.row.start(a)
a<-table.element(a,i-1,header=TRUE)
a<-table.element(a,round(myacf[i],6))
mytstat <- myacf[i]*sqrtn
a<-table.element(a,round(mytstat,4))
a<-table.element(a,round(1-pt(abs(mytstat),lengthx),6))
a<-table.row.end(a)
}
a<-table.end(a)
table.save(a,file='mytable.tab')
a<-table.start()
a<-table.row.start(a)
a<-table.element(a,'Partial Autocorrelation Function',4,TRUE)
a<-table.row.end(a)
a<-table.row.start(a)
a<-table.element(a,'Time lag k',header=TRUE)
a<-table.element(a,'PACF(k)',header=TRUE)
a<-table.element(a,'T-STAT',header=TRUE)
a<-table.element(a,'P-value',header=TRUE)
a<-table.row.end(a)
for (i in 1:par1) {
a<-table.row.start(a)
a<-table.element(a,i,header=TRUE)
a<-table.element(a,round(mypacf[i],6))
mytstat <- mypacf[i]*sqrtn
a<-table.element(a,round(mytstat,4))
a<-table.element(a,round(1-pt(abs(mytstat),lengthx),6))
a<-table.row.end(a)
}
a<-table.end(a)
table.save(a,file='mytable1.tab')