Free Statistics

of Irreproducible Research!

Author's title

Author*The author of this computation has been verified*
R Software Modulerwasp_arimabackwardselection.wasp
Title produced by softwareARIMA Backward Selection
Date of computationFri, 16 Dec 2016 21:04:52 +0100
Cite this page as followsStatistical Computations at FreeStatistics.org, Office for Research Development and Education, URL https://freestatistics.org/blog/index.php?v=date/2016/Dec/16/t148191873054glz4ajz84lczj.htm/, Retrieved Fri, 01 Nov 2024 03:41:07 +0000
Statistical Computations at FreeStatistics.org, Office for Research Development and Education, URL https://freestatistics.org/blog/index.php?pk=300525, Retrieved Fri, 01 Nov 2024 03:41:07 +0000
QR Codes:

Original text written by user:
IsPrivate?No (this computation is public)
User-defined keywords
Estimated Impact97
Family? (F = Feedback message, R = changed R code, M = changed R Module, P = changed Parameters, D = changed Data)
-       [ARIMA Backward Selection] [] [2016-12-16 20:04:52] [404ac5ee4f7301873f6a96ef36861981] [Current]
Feedback Forum

Post a new message
Dataseries X:
4210
4220
3850
4000
4060
3940
4210
3910
3960
4030
3870
3730
3880
3900
3780
3900
3870
3980
4200
4340
4280
4330
4410
4260
4120
4330
4540
4520
4070
4290
4380
4520
4450
4180
4080
3820
3700
3820
3670
3610
3700


Summary of computational transaction
Raw Input view raw input (R code)
Raw Outputview raw output of R engine
Computing time4 seconds
R ServerBig Analytics Cloud Computing Center

\begin{tabular}{lllllllll}
\hline
Summary of computational transaction \tabularnewline
Raw Input view raw input (R code)  \tabularnewline
Raw Outputview raw output of R engine  \tabularnewline
Computing time4 seconds \tabularnewline
R ServerBig Analytics Cloud Computing Center \tabularnewline
\hline
\end{tabular}
%Source: https://freestatistics.org/blog/index.php?pk=300525&T=0

[TABLE]
[ROW]
Summary of computational transaction[/C][/ROW] [ROW]Raw Input[/C] view raw input (R code) [/C][/ROW] [ROW]Raw Output[/C]view raw output of R engine [/C][/ROW] [ROW]Computing time[/C]4 seconds[/C][/ROW] [ROW]R Server[/C]Big Analytics Cloud Computing Center[/C][/ROW] [/TABLE] Source: https://freestatistics.org/blog/index.php?pk=300525&T=0

Globally Unique Identifier (entire table): ba.freestatistics.org/blog/index.php?pk=300525&T=0

As an alternative you can also use a QR Code:  

The GUIDs for individual cells are displayed in the table below:

Summary of computational transaction
Raw Input view raw input (R code)
Raw Outputview raw output of R engine
Computing time4 seconds
R ServerBig Analytics Cloud Computing Center


ARIMA Parameter Estimation and Backward Selection
Iterationar1ar2ar3ma1
Estimates ( 1 )-0.8895-0.3133-0.07950.7819
(p-val)(0.087 )(0.1634 )(0.7442 )(0.1093 )
Estimates ( 2 )-0.7659-0.265100.6685
(p-val)(0.055 )(0.1098 )(NA )(0.097 )
Estimates ( 3 )0.82600-1
(p-val)(0 )(NA )(NA )(0 )
Estimates ( 4 )NANANANA
(p-val)(NA )(NA )(NA )(NA )
Estimates ( 5 )NANANANA
(p-val)(NA )(NA )(NA )(NA )
Estimates ( 6 )NANANANA
(p-val)(NA )(NA )(NA )(NA )
Estimates ( 7 )NANANANA
(p-val)(NA )(NA )(NA )(NA )

\begin{tabular}{lllllllll}
\hline
ARIMA Parameter Estimation and Backward Selection \tabularnewline
Iteration & ar1 & ar2 & ar3 & ma1 \tabularnewline
Estimates ( 1 ) & -0.8895 & -0.3133 & -0.0795 & 0.7819 \tabularnewline
(p-val) & (0.087 ) & (0.1634 ) & (0.7442 ) & (0.1093 ) \tabularnewline
Estimates ( 2 ) & -0.7659 & -0.2651 & 0 & 0.6685 \tabularnewline
(p-val) & (0.055 ) & (0.1098 ) & (NA ) & (0.097 ) \tabularnewline
Estimates ( 3 ) & 0.826 & 0 & 0 & -1 \tabularnewline
(p-val) & (0 ) & (NA ) & (NA ) & (0 ) \tabularnewline
Estimates ( 4 ) & NA & NA & NA & NA \tabularnewline
(p-val) & (NA ) & (NA ) & (NA ) & (NA ) \tabularnewline
Estimates ( 5 ) & NA & NA & NA & NA \tabularnewline
(p-val) & (NA ) & (NA ) & (NA ) & (NA ) \tabularnewline
Estimates ( 6 ) & NA & NA & NA & NA \tabularnewline
(p-val) & (NA ) & (NA ) & (NA ) & (NA ) \tabularnewline
Estimates ( 7 ) & NA & NA & NA & NA \tabularnewline
(p-val) & (NA ) & (NA ) & (NA ) & (NA ) \tabularnewline
\hline
\end{tabular}
%Source: https://freestatistics.org/blog/index.php?pk=300525&T=1

[TABLE]
[ROW][C]ARIMA Parameter Estimation and Backward Selection[/C][/ROW]
[ROW][C]Iteration[/C][C]ar1[/C][C]ar2[/C][C]ar3[/C][C]ma1[/C][/ROW]
[ROW][C]Estimates ( 1 )[/C][C]-0.8895[/C][C]-0.3133[/C][C]-0.0795[/C][C]0.7819[/C][/ROW]
[ROW][C](p-val)[/C][C](0.087 )[/C][C](0.1634 )[/C][C](0.7442 )[/C][C](0.1093 )[/C][/ROW]
[ROW][C]Estimates ( 2 )[/C][C]-0.7659[/C][C]-0.2651[/C][C]0[/C][C]0.6685[/C][/ROW]
[ROW][C](p-val)[/C][C](0.055 )[/C][C](0.1098 )[/C][C](NA )[/C][C](0.097 )[/C][/ROW]
[ROW][C]Estimates ( 3 )[/C][C]0.826[/C][C]0[/C][C]0[/C][C]-1[/C][/ROW]
[ROW][C](p-val)[/C][C](0 )[/C][C](NA )[/C][C](NA )[/C][C](0 )[/C][/ROW]
[ROW][C]Estimates ( 4 )[/C][C]NA[/C][C]NA[/C][C]NA[/C][C]NA[/C][/ROW]
[ROW][C](p-val)[/C][C](NA )[/C][C](NA )[/C][C](NA )[/C][C](NA )[/C][/ROW]
[ROW][C]Estimates ( 5 )[/C][C]NA[/C][C]NA[/C][C]NA[/C][C]NA[/C][/ROW]
[ROW][C](p-val)[/C][C](NA )[/C][C](NA )[/C][C](NA )[/C][C](NA )[/C][/ROW]
[ROW][C]Estimates ( 6 )[/C][C]NA[/C][C]NA[/C][C]NA[/C][C]NA[/C][/ROW]
[ROW][C](p-val)[/C][C](NA )[/C][C](NA )[/C][C](NA )[/C][C](NA )[/C][/ROW]
[ROW][C]Estimates ( 7 )[/C][C]NA[/C][C]NA[/C][C]NA[/C][C]NA[/C][/ROW]
[ROW][C](p-val)[/C][C](NA )[/C][C](NA )[/C][C](NA )[/C][C](NA )[/C][/ROW]
[/TABLE]
Source: https://freestatistics.org/blog/index.php?pk=300525&T=1

Globally Unique Identifier (entire table): ba.freestatistics.org/blog/index.php?pk=300525&T=1

As an alternative you can also use a QR Code:  

The GUIDs for individual cells are displayed in the table below:

ARIMA Parameter Estimation and Backward Selection
Iterationar1ar2ar3ma1
Estimates ( 1 )-0.8895-0.3133-0.07950.7819
(p-val)(0.087 )(0.1634 )(0.7442 )(0.1093 )
Estimates ( 2 )-0.7659-0.265100.6685
(p-val)(0.055 )(0.1098 )(NA )(0.097 )
Estimates ( 3 )0.82600-1
(p-val)(0 )(NA )(NA )(0 )
Estimates ( 4 )NANANANA
(p-val)(NA )(NA )(NA )(NA )
Estimates ( 5 )NANANANA
(p-val)(NA )(NA )(NA )(NA )
Estimates ( 6 )NANANANA
(p-val)(NA )(NA )(NA )(NA )
Estimates ( 7 )NANANANA
(p-val)(NA )(NA )(NA )(NA )


Estimated ARIMA Residuals
Value
4.2099977216406
9.61253538860425
-356.977355140417
98.855992547372
11.5555928579039
-41.8432376668746
221.62550956067
-272.85187033583
74.0958676305757
-20.7570370534668
-79.2498393183474
-191.00872416165
128.046510315663
12.1714764802391
-73.0526020510725
82.2286466503395
-24.8738371562109
135.463763477508
205.735973598966
200.123368380627
-28.2377549282172
60.0367251240938
62.2531697525368
-117.089018549457
-155.402588172226
166.897135582172
222.153430430916
47.9986199855059
-441.736095468979
165.347844405478
28.6661290732129
248.092657543763
-104.77109548988
-216.456494122391
-180.648834931376
-287.399652575938
-153.513762811046
61.7915872349702
-131.210755995366
-55.3573549815049
41.2871084268858

\begin{tabular}{lllllllll}
\hline
Estimated ARIMA Residuals \tabularnewline
Value \tabularnewline
4.2099977216406 \tabularnewline
9.61253538860425 \tabularnewline
-356.977355140417 \tabularnewline
98.855992547372 \tabularnewline
11.5555928579039 \tabularnewline
-41.8432376668746 \tabularnewline
221.62550956067 \tabularnewline
-272.85187033583 \tabularnewline
74.0958676305757 \tabularnewline
-20.7570370534668 \tabularnewline
-79.2498393183474 \tabularnewline
-191.00872416165 \tabularnewline
128.046510315663 \tabularnewline
12.1714764802391 \tabularnewline
-73.0526020510725 \tabularnewline
82.2286466503395 \tabularnewline
-24.8738371562109 \tabularnewline
135.463763477508 \tabularnewline
205.735973598966 \tabularnewline
200.123368380627 \tabularnewline
-28.2377549282172 \tabularnewline
60.0367251240938 \tabularnewline
62.2531697525368 \tabularnewline
-117.089018549457 \tabularnewline
-155.402588172226 \tabularnewline
166.897135582172 \tabularnewline
222.153430430916 \tabularnewline
47.9986199855059 \tabularnewline
-441.736095468979 \tabularnewline
165.347844405478 \tabularnewline
28.6661290732129 \tabularnewline
248.092657543763 \tabularnewline
-104.77109548988 \tabularnewline
-216.456494122391 \tabularnewline
-180.648834931376 \tabularnewline
-287.399652575938 \tabularnewline
-153.513762811046 \tabularnewline
61.7915872349702 \tabularnewline
-131.210755995366 \tabularnewline
-55.3573549815049 \tabularnewline
41.2871084268858 \tabularnewline
\hline
\end{tabular}
%Source: https://freestatistics.org/blog/index.php?pk=300525&T=2

[TABLE]
[ROW][C]Estimated ARIMA Residuals[/C][/ROW]
[ROW][C]Value[/C][/ROW]
[ROW][C]4.2099977216406[/C][/ROW]
[ROW][C]9.61253538860425[/C][/ROW]
[ROW][C]-356.977355140417[/C][/ROW]
[ROW][C]98.855992547372[/C][/ROW]
[ROW][C]11.5555928579039[/C][/ROW]
[ROW][C]-41.8432376668746[/C][/ROW]
[ROW][C]221.62550956067[/C][/ROW]
[ROW][C]-272.85187033583[/C][/ROW]
[ROW][C]74.0958676305757[/C][/ROW]
[ROW][C]-20.7570370534668[/C][/ROW]
[ROW][C]-79.2498393183474[/C][/ROW]
[ROW][C]-191.00872416165[/C][/ROW]
[ROW][C]128.046510315663[/C][/ROW]
[ROW][C]12.1714764802391[/C][/ROW]
[ROW][C]-73.0526020510725[/C][/ROW]
[ROW][C]82.2286466503395[/C][/ROW]
[ROW][C]-24.8738371562109[/C][/ROW]
[ROW][C]135.463763477508[/C][/ROW]
[ROW][C]205.735973598966[/C][/ROW]
[ROW][C]200.123368380627[/C][/ROW]
[ROW][C]-28.2377549282172[/C][/ROW]
[ROW][C]60.0367251240938[/C][/ROW]
[ROW][C]62.2531697525368[/C][/ROW]
[ROW][C]-117.089018549457[/C][/ROW]
[ROW][C]-155.402588172226[/C][/ROW]
[ROW][C]166.897135582172[/C][/ROW]
[ROW][C]222.153430430916[/C][/ROW]
[ROW][C]47.9986199855059[/C][/ROW]
[ROW][C]-441.736095468979[/C][/ROW]
[ROW][C]165.347844405478[/C][/ROW]
[ROW][C]28.6661290732129[/C][/ROW]
[ROW][C]248.092657543763[/C][/ROW]
[ROW][C]-104.77109548988[/C][/ROW]
[ROW][C]-216.456494122391[/C][/ROW]
[ROW][C]-180.648834931376[/C][/ROW]
[ROW][C]-287.399652575938[/C][/ROW]
[ROW][C]-153.513762811046[/C][/ROW]
[ROW][C]61.7915872349702[/C][/ROW]
[ROW][C]-131.210755995366[/C][/ROW]
[ROW][C]-55.3573549815049[/C][/ROW]
[ROW][C]41.2871084268858[/C][/ROW]
[/TABLE]
Source: https://freestatistics.org/blog/index.php?pk=300525&T=2

Globally Unique Identifier (entire table): ba.freestatistics.org/blog/index.php?pk=300525&T=2

As an alternative you can also use a QR Code:  

The GUIDs for individual cells are displayed in the table below:

Estimated ARIMA Residuals
Value
4.2099977216406
9.61253538860425
-356.977355140417
98.855992547372
11.5555928579039
-41.8432376668746
221.62550956067
-272.85187033583
74.0958676305757
-20.7570370534668
-79.2498393183474
-191.00872416165
128.046510315663
12.1714764802391
-73.0526020510725
82.2286466503395
-24.8738371562109
135.463763477508
205.735973598966
200.123368380627
-28.2377549282172
60.0367251240938
62.2531697525368
-117.089018549457
-155.402588172226
166.897135582172
222.153430430916
47.9986199855059
-441.736095468979
165.347844405478
28.6661290732129
248.092657543763
-104.77109548988
-216.456494122391
-180.648834931376
-287.399652575938
-153.513762811046
61.7915872349702
-131.210755995366
-55.3573549815049
41.2871084268858


Parameters (Session):
par1 = 12 ; par2 = Double ; par3 = additive ; par4 = 12 ;
Parameters (R input):
par1 = FALSE ; par2 = 1 ; par3 = 1 ; par4 = 0 ; par5 = 1 ; par6 = 3 ; par7 = 1 ; par8 = 0 ; par9 = 0 ;
R code (references can be found in the software module):
par9 <- '0'
par8 <- '1'
par7 <- '1'
par6 <- '3'
par5 <- '1'
par4 <- '0'
par3 <- '1'
par2 <- '1'
par1 <- 'FALSE'
library(lattice)
if (par1 == 'TRUE') par1 <- TRUE
if (par1 == 'FALSE') par1 <- FALSE
par2 <- as.numeric(par2) #Box-Cox lambda transformation parameter
par3 <- as.numeric(par3) #degree of non-seasonal differencing
par4 <- as.numeric(par4) #degree of seasonal differencing
par5 <- as.numeric(par5) #seasonal period
par6 <- as.numeric(par6) #degree (p) of the non-seasonal AR(p) polynomial
par7 <- as.numeric(par7) #degree (q) of the non-seasonal MA(q) polynomial
par8 <- as.numeric(par8) #degree (P) of the seasonal AR(P) polynomial
par9 <- as.numeric(par9) #degree (Q) of the seasonal MA(Q) polynomial
armaGR <- function(arima.out, names, n){
try1 <- arima.out$coef
try2 <- sqrt(diag(arima.out$var.coef))
try.data.frame <- data.frame(matrix(NA,ncol=4,nrow=length(names)))
dimnames(try.data.frame) <- list(names,c('coef','std','tstat','pv'))
try.data.frame[,1] <- try1
for(i in 1:length(try2)) try.data.frame[which(rownames(try.data.frame)==names(try2)[i]),2] <- try2[i]
try.data.frame[,3] <- try.data.frame[,1] / try.data.frame[,2]
try.data.frame[,4] <- round((1-pt(abs(try.data.frame[,3]),df=n-(length(try2)+1)))*2,5)
vector <- rep(NA,length(names))
vector[is.na(try.data.frame[,4])] <- 0
maxi <- which.max(try.data.frame[,4])
continue <- max(try.data.frame[,4],na.rm=TRUE) > .05
vector[maxi] <- 0
list(summary=try.data.frame,next.vector=vector,continue=continue)
}
arimaSelect <- function(series, order=c(13,0,0), seasonal=list(order=c(2,0,0),period=12), include.mean=F){
nrc <- order[1]+order[3]+seasonal$order[1]+seasonal$order[3]
coeff <- matrix(NA, nrow=nrc*2, ncol=nrc)
pval <- matrix(NA, nrow=nrc*2, ncol=nrc)
mylist <- rep(list(NULL), nrc)
names <- NULL
if(order[1] > 0) names <- paste('ar',1:order[1],sep='')
if(order[3] > 0) names <- c( names , paste('ma',1:order[3],sep='') )
if(seasonal$order[1] > 0) names <- c(names, paste('sar',1:seasonal$order[1],sep=''))
if(seasonal$order[3] > 0) names <- c(names, paste('sma',1:seasonal$order[3],sep=''))
arima.out <- arima(series, order=order, seasonal=seasonal, include.mean=include.mean, method='ML')
mylist[[1]] <- arima.out
last.arma <- armaGR(arima.out, names, length(series))
mystop <- FALSE
i <- 1
coeff[i,] <- last.arma[[1]][,1]
pval [i,] <- last.arma[[1]][,4]
i <- 2
aic <- arima.out$aic
while(!mystop){
mylist[[i]] <- arima.out
arima.out <- arima(series, order=order, seasonal=seasonal, include.mean=include.mean, method='ML', fixed=last.arma$next.vector)
aic <- c(aic, arima.out$aic)
last.arma <- armaGR(arima.out, names, length(series))
mystop <- !last.arma$continue
coeff[i,] <- last.arma[[1]][,1]
pval [i,] <- last.arma[[1]][,4]
i <- i+1
}
list(coeff, pval, mylist, aic=aic)
}
arimaSelectplot <- function(arimaSelect.out,noms,choix){
noms <- names(arimaSelect.out[[3]][[1]]$coef)
coeff <- arimaSelect.out[[1]]
k <- min(which(is.na(coeff[,1])))-1
coeff <- coeff[1:k,]
pval <- arimaSelect.out[[2]][1:k,]
aic <- arimaSelect.out$aic[1:k]
coeff[coeff==0] <- NA
n <- ncol(coeff)
if(missing(choix)) choix <- k
layout(matrix(c(1,1,1,2,
3,3,3,2,
3,3,3,4,
5,6,7,7),nr=4),
widths=c(10,35,45,15),
heights=c(30,30,15,15))
couleurs <- rainbow(75)[1:50]#(50)
ticks <- pretty(coeff)
par(mar=c(1,1,3,1))
plot(aic,k:1-.5,type='o',pch=21,bg='blue',cex=2,axes=F,lty=2,xpd=NA)
points(aic[choix],k-choix+.5,pch=21,cex=4,bg=2,xpd=NA)
title('aic',line=2)
par(mar=c(3,0,0,0))
plot(0,axes=F,xlab='',ylab='',xlim=range(ticks),ylim=c(.1,1))
rect(xleft = min(ticks) + (0:49)/50*(max(ticks)-min(ticks)),
xright = min(ticks) + (1:50)/50*(max(ticks)-min(ticks)),
ytop = rep(1,50),
ybottom= rep(0,50),col=couleurs,border=NA)
axis(1,ticks)
rect(xleft=min(ticks),xright=max(ticks),ytop=1,ybottom=0)
text(mean(coeff,na.rm=T),.5,'coefficients',cex=2,font=2)
par(mar=c(1,1,3,1))
image(1:n,1:k,t(coeff[k:1,]),axes=F,col=couleurs,zlim=range(ticks))
for(i in 1:n) for(j in 1:k) if(!is.na(coeff[j,i])) {
if(pval[j,i]<.01) symb = 'green'
else if( (pval[j,i]<.05) & (pval[j,i]>=.01)) symb = 'orange'
else if( (pval[j,i]<.1) & (pval[j,i]>=.05)) symb = 'red'
else symb = 'black'
polygon(c(i+.5 ,i+.2 ,i+.5 ,i+.5),
c(k-j+0.5,k-j+0.5,k-j+0.8,k-j+0.5),
col=symb)
if(j==choix) {
rect(xleft=i-.5,
xright=i+.5,
ybottom=k-j+1.5,
ytop=k-j+.5,
lwd=4)
text(i,
k-j+1,
round(coeff[j,i],2),
cex=1.2,
font=2)
}
else{
rect(xleft=i-.5,xright=i+.5,ybottom=k-j+1.5,ytop=k-j+.5)
text(i,k-j+1,round(coeff[j,i],2),cex=1.2,font=1)
}
}
axis(3,1:n,noms)
par(mar=c(0.5,0,0,0.5))
plot(0,axes=F,xlab='',ylab='',type='n',xlim=c(0,8),ylim=c(-.2,.8))
cols <- c('green','orange','red','black')
niv <- c('0','0.01','0.05','0.1')
for(i in 0:3){
polygon(c(1+2*i ,1+2*i ,1+2*i-.5 ,1+2*i),
c(.4 ,.7 , .4 , .4),
col=cols[i+1])
text(2*i,0.5,niv[i+1],cex=1.5)
}
text(8,.5,1,cex=1.5)
text(4,0,'p-value',cex=2)
box()
residus <- arimaSelect.out[[3]][[choix]]$res
par(mar=c(1,2,4,1))
acf(residus,main='')
title('acf',line=.5)
par(mar=c(1,2,4,1))
pacf(residus,main='')
title('pacf',line=.5)
par(mar=c(2,2,4,1))
qqnorm(residus,main='')
title('qq-norm',line=.5)
qqline(residus)
residus
}
if (par2 == 0) x <- log(x)
if (par2 != 0) x <- x^par2
(selection <- arimaSelect(x, order=c(par6,par3,par7), seasonal=list(order=c(par8,par4,par9), period=par5)))
bitmap(file='test1.png')
resid <- arimaSelectplot(selection)
dev.off()
resid
bitmap(file='test2.png')
acf(resid,length(resid)/2, main='Residual Autocorrelation Function')
dev.off()
bitmap(file='test3.png')
pacf(resid,length(resid)/2, main='Residual Partial Autocorrelation Function')
dev.off()
bitmap(file='test4.png')
cpgram(resid, main='Residual Cumulative Periodogram')
dev.off()
bitmap(file='test5.png')
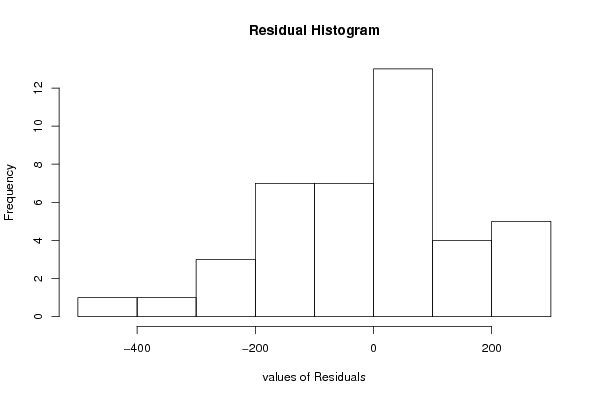
hist(resid, main='Residual Histogram', xlab='values of Residuals')
dev.off()
bitmap(file='test6.png')
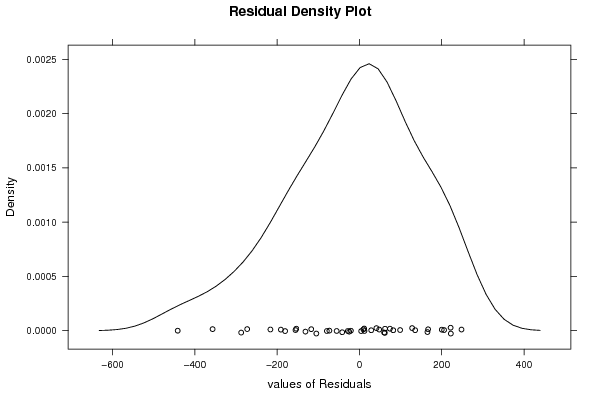
densityplot(~resid,col='black',main='Residual Density Plot', xlab='values of Residuals')
dev.off()
bitmap(file='test7.png')
qqnorm(resid, main='Residual Normal Q-Q Plot')
qqline(resid)
dev.off()
ncols <- length(selection[[1]][1,])
nrows <- length(selection[[2]][,1])-1
load(file='createtable')
a<-table.start()
a<-table.row.start(a)
a<-table.element(a,'ARIMA Parameter Estimation and Backward Selection', ncols+1,TRUE)
a<-table.row.end(a)
a<-table.row.start(a)
a<-table.element(a,'Iteration', header=TRUE)
for (i in 1:ncols) {
a<-table.element(a,names(selection[[3]][[1]]$coef)[i],header=TRUE)
}
a<-table.row.end(a)
for (j in 1:nrows) {
a<-table.row.start(a)
mydum <- 'Estimates ('
mydum <- paste(mydum,j)
mydum <- paste(mydum,')')
a<-table.element(a,mydum, header=TRUE)
for (i in 1:ncols) {
a<-table.element(a,round(selection[[1]][j,i],4))
}
a<-table.row.end(a)
a<-table.row.start(a)
a<-table.element(a,'(p-val)', header=TRUE)
for (i in 1:ncols) {
mydum <- '('
mydum <- paste(mydum,round(selection[[2]][j,i],4),sep='')
mydum <- paste(mydum,')')
a<-table.element(a,mydum)
}
a<-table.row.end(a)
}
a<-table.end(a)
table.save(a,file='mytable.tab')
a<-table.start()
a<-table.row.start(a)
a<-table.element(a,'Estimated ARIMA Residuals', 1,TRUE)
a<-table.row.end(a)
a<-table.row.start(a)
a<-table.element(a,'Value', 1,TRUE)
a<-table.row.end(a)
for (i in (par4*par5+par3):length(resid)) {
a<-table.row.start(a)
a<-table.element(a,resid[i])
a<-table.row.end(a)
}
a<-table.end(a)
table.save(a,file='mytable1.tab')