Free Statistics

of Irreproducible Research!

Author's title

Author*The author of this computation has been verified*
R Software Modulerwasp_decompose.wasp
Title produced by softwareClassical Decomposition
Date of computationFri, 16 Dec 2016 12:34:05 +0100
Cite this page as followsStatistical Computations at FreeStatistics.org, Office for Research Development and Education, URL https://freestatistics.org/blog/index.php?v=date/2016/Dec/16/t14818890642mop3my0zmftahk.htm/, Retrieved Fri, 01 Nov 2024 03:41:34 +0000
Statistical Computations at FreeStatistics.org, Office for Research Development and Education, URL https://freestatistics.org/blog/index.php?pk=300191, Retrieved Fri, 01 Nov 2024 03:41:34 +0000
QR Codes:

Original text written by user:
IsPrivate?No (this computation is public)
User-defined keywords
Estimated Impact83
Family? (F = Feedback message, R = changed R code, M = changed R Module, P = changed Parameters, D = changed Data)
-       [Classical Decomposition] [] [2016-12-16 11:34:05] [edf5d828a362f128b5245bc1504a7130] [Current]
Feedback Forum

Post a new message
Dataseries X:
3860
4300
6500
4830
2690
3700
4830
3270
2650
4070
5020
3350
2720
3010
5680
1950
2510
2580
4350
2830
1630
2720
4490
2360


Summary of computational transaction
Raw Input view raw input (R code)
Raw Outputview raw output of R engine
Computing time2 seconds
R ServerBig Analytics Cloud Computing Center

\begin{tabular}{lllllllll}
\hline
Summary of computational transaction \tabularnewline
Raw Input view raw input (R code)  \tabularnewline
Raw Outputview raw output of R engine  \tabularnewline
Computing time2 seconds \tabularnewline
R ServerBig Analytics Cloud Computing Center \tabularnewline
\hline
\end{tabular}
%Source: https://freestatistics.org/blog/index.php?pk=300191&T=0

[TABLE]
[ROW]
Summary of computational transaction[/C][/ROW] [ROW]Raw Input[/C] view raw input (R code) [/C][/ROW] [ROW]Raw Output[/C]view raw output of R engine [/C][/ROW] [ROW]Computing time[/C]2 seconds[/C][/ROW] [ROW]R Server[/C]Big Analytics Cloud Computing Center[/C][/ROW] [/TABLE] Source: https://freestatistics.org/blog/index.php?pk=300191&T=0

Globally Unique Identifier (entire table): ba.freestatistics.org/blog/index.php?pk=300191&T=0

As an alternative you can also use a QR Code:  

The GUIDs for individual cells are displayed in the table below:

Summary of computational transaction
Raw Input view raw input (R code)
Raw Outputview raw output of R engine
Computing time2 seconds
R ServerBig Analytics Cloud Computing Center


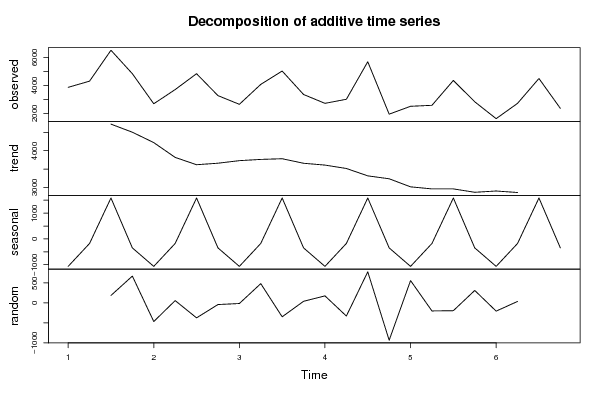
Classical Decomposition by Moving Averages
tObservationsFitTrendSeasonalRandom
13860NANA-1063.81NA
24300NANA-175.812NA
365006313.444726.251587.19186.562
448304157.444505-347.562672.562
526903157.444221.25-1063.81-467.438
637003641.693817.5-175.81258.3125
748305204.693617.51587.19-374.688
832703311.193658.75-347.562-41.1875
926502664.943728.75-1063.81-14.9375
1040703586.693762.5-175.812483.312
1150205368.443781.251587.19-348.438
1233503309.943657.5-347.56240.0625
1327202543.693607.5-1063.81176.312
1430103339.193515-175.812-329.188
1556804900.943313.751587.19779.062
1619502886.193233.75-347.562-936.188
1725101949.943013.75-1063.81560.062
1825802781.692957.5-175.812-201.688
1943504544.692957.51587.19-194.688
2028302517.442865-347.562312.562
2116301836.192900-1063.81-206.188
2227202682.942858.75-175.81237.0625
234490NANA1587.19NA
242360NANA-347.562NA

\begin{tabular}{lllllllll}
\hline
Classical Decomposition by Moving Averages \tabularnewline
t & Observations & Fit & Trend & Seasonal & Random \tabularnewline
1 & 3860 & NA & NA & -1063.81 & NA \tabularnewline
2 & 4300 & NA & NA & -175.812 & NA \tabularnewline
3 & 6500 & 6313.44 & 4726.25 & 1587.19 & 186.562 \tabularnewline
4 & 4830 & 4157.44 & 4505 & -347.562 & 672.562 \tabularnewline
5 & 2690 & 3157.44 & 4221.25 & -1063.81 & -467.438 \tabularnewline
6 & 3700 & 3641.69 & 3817.5 & -175.812 & 58.3125 \tabularnewline
7 & 4830 & 5204.69 & 3617.5 & 1587.19 & -374.688 \tabularnewline
8 & 3270 & 3311.19 & 3658.75 & -347.562 & -41.1875 \tabularnewline
9 & 2650 & 2664.94 & 3728.75 & -1063.81 & -14.9375 \tabularnewline
10 & 4070 & 3586.69 & 3762.5 & -175.812 & 483.312 \tabularnewline
11 & 5020 & 5368.44 & 3781.25 & 1587.19 & -348.438 \tabularnewline
12 & 3350 & 3309.94 & 3657.5 & -347.562 & 40.0625 \tabularnewline
13 & 2720 & 2543.69 & 3607.5 & -1063.81 & 176.312 \tabularnewline
14 & 3010 & 3339.19 & 3515 & -175.812 & -329.188 \tabularnewline
15 & 5680 & 4900.94 & 3313.75 & 1587.19 & 779.062 \tabularnewline
16 & 1950 & 2886.19 & 3233.75 & -347.562 & -936.188 \tabularnewline
17 & 2510 & 1949.94 & 3013.75 & -1063.81 & 560.062 \tabularnewline
18 & 2580 & 2781.69 & 2957.5 & -175.812 & -201.688 \tabularnewline
19 & 4350 & 4544.69 & 2957.5 & 1587.19 & -194.688 \tabularnewline
20 & 2830 & 2517.44 & 2865 & -347.562 & 312.562 \tabularnewline
21 & 1630 & 1836.19 & 2900 & -1063.81 & -206.188 \tabularnewline
22 & 2720 & 2682.94 & 2858.75 & -175.812 & 37.0625 \tabularnewline
23 & 4490 & NA & NA & 1587.19 & NA \tabularnewline
24 & 2360 & NA & NA & -347.562 & NA \tabularnewline
\hline
\end{tabular}
%Source: https://freestatistics.org/blog/index.php?pk=300191&T=1

[TABLE]
[ROW][C]Classical Decomposition by Moving Averages[/C][/ROW]
[ROW][C]t[/C][C]Observations[/C][C]Fit[/C][C]Trend[/C][C]Seasonal[/C][C]Random[/C][/ROW]
[ROW][C]1[/C][C]3860[/C][C]NA[/C][C]NA[/C][C]-1063.81[/C][C]NA[/C][/ROW]
[ROW][C]2[/C][C]4300[/C][C]NA[/C][C]NA[/C][C]-175.812[/C][C]NA[/C][/ROW]
[ROW][C]3[/C][C]6500[/C][C]6313.44[/C][C]4726.25[/C][C]1587.19[/C][C]186.562[/C][/ROW]
[ROW][C]4[/C][C]4830[/C][C]4157.44[/C][C]4505[/C][C]-347.562[/C][C]672.562[/C][/ROW]
[ROW][C]5[/C][C]2690[/C][C]3157.44[/C][C]4221.25[/C][C]-1063.81[/C][C]-467.438[/C][/ROW]
[ROW][C]6[/C][C]3700[/C][C]3641.69[/C][C]3817.5[/C][C]-175.812[/C][C]58.3125[/C][/ROW]
[ROW][C]7[/C][C]4830[/C][C]5204.69[/C][C]3617.5[/C][C]1587.19[/C][C]-374.688[/C][/ROW]
[ROW][C]8[/C][C]3270[/C][C]3311.19[/C][C]3658.75[/C][C]-347.562[/C][C]-41.1875[/C][/ROW]
[ROW][C]9[/C][C]2650[/C][C]2664.94[/C][C]3728.75[/C][C]-1063.81[/C][C]-14.9375[/C][/ROW]
[ROW][C]10[/C][C]4070[/C][C]3586.69[/C][C]3762.5[/C][C]-175.812[/C][C]483.312[/C][/ROW]
[ROW][C]11[/C][C]5020[/C][C]5368.44[/C][C]3781.25[/C][C]1587.19[/C][C]-348.438[/C][/ROW]
[ROW][C]12[/C][C]3350[/C][C]3309.94[/C][C]3657.5[/C][C]-347.562[/C][C]40.0625[/C][/ROW]
[ROW][C]13[/C][C]2720[/C][C]2543.69[/C][C]3607.5[/C][C]-1063.81[/C][C]176.312[/C][/ROW]
[ROW][C]14[/C][C]3010[/C][C]3339.19[/C][C]3515[/C][C]-175.812[/C][C]-329.188[/C][/ROW]
[ROW][C]15[/C][C]5680[/C][C]4900.94[/C][C]3313.75[/C][C]1587.19[/C][C]779.062[/C][/ROW]
[ROW][C]16[/C][C]1950[/C][C]2886.19[/C][C]3233.75[/C][C]-347.562[/C][C]-936.188[/C][/ROW]
[ROW][C]17[/C][C]2510[/C][C]1949.94[/C][C]3013.75[/C][C]-1063.81[/C][C]560.062[/C][/ROW]
[ROW][C]18[/C][C]2580[/C][C]2781.69[/C][C]2957.5[/C][C]-175.812[/C][C]-201.688[/C][/ROW]
[ROW][C]19[/C][C]4350[/C][C]4544.69[/C][C]2957.5[/C][C]1587.19[/C][C]-194.688[/C][/ROW]
[ROW][C]20[/C][C]2830[/C][C]2517.44[/C][C]2865[/C][C]-347.562[/C][C]312.562[/C][/ROW]
[ROW][C]21[/C][C]1630[/C][C]1836.19[/C][C]2900[/C][C]-1063.81[/C][C]-206.188[/C][/ROW]
[ROW][C]22[/C][C]2720[/C][C]2682.94[/C][C]2858.75[/C][C]-175.812[/C][C]37.0625[/C][/ROW]
[ROW][C]23[/C][C]4490[/C][C]NA[/C][C]NA[/C][C]1587.19[/C][C]NA[/C][/ROW]
[ROW][C]24[/C][C]2360[/C][C]NA[/C][C]NA[/C][C]-347.562[/C][C]NA[/C][/ROW]
[/TABLE]
Source: https://freestatistics.org/blog/index.php?pk=300191&T=1

Globally Unique Identifier (entire table): ba.freestatistics.org/blog/index.php?pk=300191&T=1

As an alternative you can also use a QR Code:  

The GUIDs for individual cells are displayed in the table below:

Classical Decomposition by Moving Averages
tObservationsFitTrendSeasonalRandom
13860NANA-1063.81NA
24300NANA-175.812NA
365006313.444726.251587.19186.562
448304157.444505-347.562672.562
526903157.444221.25-1063.81-467.438
637003641.693817.5-175.81258.3125
748305204.693617.51587.19-374.688
832703311.193658.75-347.562-41.1875
926502664.943728.75-1063.81-14.9375
1040703586.693762.5-175.812483.312
1150205368.443781.251587.19-348.438
1233503309.943657.5-347.56240.0625
1327202543.693607.5-1063.81176.312
1430103339.193515-175.812-329.188
1556804900.943313.751587.19779.062
1619502886.193233.75-347.562-936.188
1725101949.943013.75-1063.81560.062
1825802781.692957.5-175.812-201.688
1943504544.692957.51587.19-194.688
2028302517.442865-347.562312.562
2116301836.192900-1063.81-206.188
2227202682.942858.75-175.81237.0625
234490NANA1587.19NA
242360NANA-347.562NA


Parameters (Session):
par1 = 4 ; par2 = Double ; par3 = additive ; par4 = 12 ;
Parameters (R input):
par1 = additive ; par2 = 4 ;
R code (references can be found in the software module):
par2 <- as.numeric(par2)
x <- ts(x,freq=par2)
m <- decompose(x,type=par1)
m$figure
bitmap(file='test1.png')
plot(m)
dev.off()
mylagmax <- length(x)/2
bitmap(file='test2.png')
op <- par(mfrow = c(2,2))
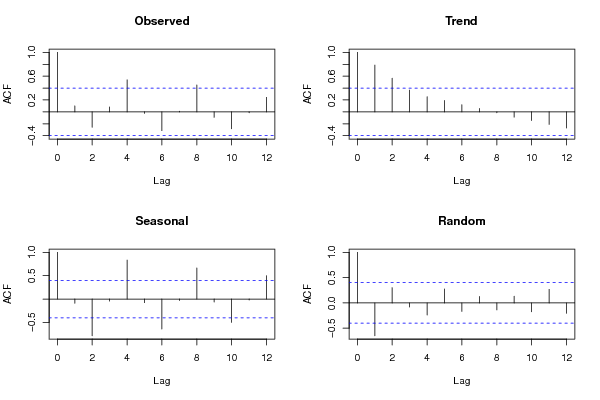
acf(as.numeric(x),lag.max = mylagmax,main='Observed')
acf(as.numeric(m$trend),na.action=na.pass,lag.max = mylagmax,main='Trend')
acf(as.numeric(m$seasonal),na.action=na.pass,lag.max = mylagmax,main='Seasonal')
acf(as.numeric(m$random),na.action=na.pass,lag.max = mylagmax,main='Random')
par(op)
dev.off()
bitmap(file='test3.png')
op <- par(mfrow = c(2,2))
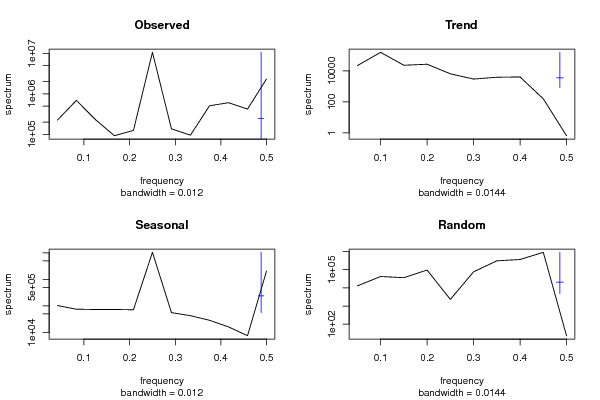
spectrum(as.numeric(x),main='Observed')
spectrum(as.numeric(m$trend[!is.na(m$trend)]),main='Trend')
spectrum(as.numeric(m$seasonal[!is.na(m$seasonal)]),main='Seasonal')
spectrum(as.numeric(m$random[!is.na(m$random)]),main='Random')
par(op)
dev.off()
bitmap(file='test4.png')
op <- par(mfrow = c(2,2))
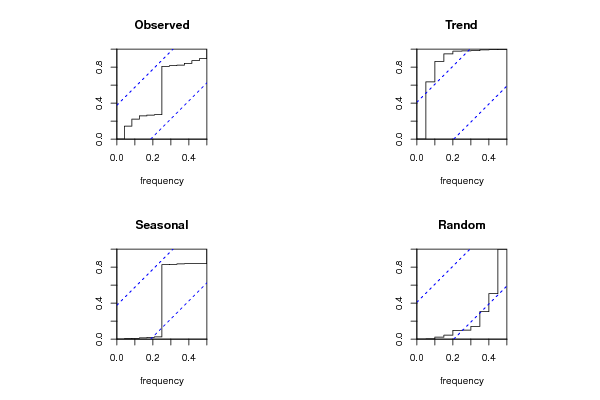
cpgram(as.numeric(x),main='Observed')
cpgram(as.numeric(m$trend[!is.na(m$trend)]),main='Trend')
cpgram(as.numeric(m$seasonal[!is.na(m$seasonal)]),main='Seasonal')
cpgram(as.numeric(m$random[!is.na(m$random)]),main='Random')
par(op)
dev.off()
load(file='createtable')
a<-table.start()
a<-table.row.start(a)
a<-table.element(a,'Classical Decomposition by Moving Averages',6,TRUE)
a<-table.row.end(a)
a<-table.row.start(a)
a<-table.element(a,'t',header=TRUE)
a<-table.element(a,'Observations',header=TRUE)
a<-table.element(a,'Fit',header=TRUE)
a<-table.element(a,'Trend',header=TRUE)
a<-table.element(a,'Seasonal',header=TRUE)
a<-table.element(a,'Random',header=TRUE)
a<-table.row.end(a)
for (i in 1:length(m$trend)) {
a<-table.row.start(a)
a<-table.element(a,i,header=TRUE)
a<-table.element(a,x[i])
if (par1 == 'additive') a<-table.element(a,signif(m$trend[i]+m$seasonal[i],6)) else a<-table.element(a,signif(m$trend[i]*m$seasonal[i],6))
a<-table.element(a,signif(m$trend[i],6))
a<-table.element(a,signif(m$seasonal[i],6))
a<-table.element(a,signif(m$random[i],6))
a<-table.row.end(a)
}
a<-table.end(a)
table.save(a,file='mytable.tab')