Free Statistics

of Irreproducible Research!

Author's title

Author*The author of this computation has been verified*
R Software Modulerwasp_arimabackwardselection.wasp
Title produced by softwareARIMA Backward Selection
Date of computationFri, 16 Dec 2016 12:34:03 +0100
Cite this page as followsStatistical Computations at FreeStatistics.org, Office for Research Development and Education, URL https://freestatistics.org/blog/index.php?v=date/2016/Dec/16/t1481888312y4hlxp98ofwqox2.htm/, Retrieved Fri, 01 Nov 2024 03:31:55 +0000
Statistical Computations at FreeStatistics.org, Office for Research Development and Education, URL https://freestatistics.org/blog/index.php?pk=300182, Retrieved Fri, 01 Nov 2024 03:31:55 +0000
QR Codes:

Original text written by user:
IsPrivate?No (this computation is public)
User-defined keywords
Estimated Impact82
Family? (F = Feedback message, R = changed R code, M = changed R Module, P = changed Parameters, D = changed Data)
-       [ARIMA Backward Selection] [] [2016-12-16 11:34:03] [df90c754990be6fd2b18fcd529010a59] [Current]
Feedback Forum

Post a new message
Dataseries X:
2160
2660
3680
3380
3600
3940
3080
2680
2920
2660
2360
2440
2660
3000
4140
3580
3960
4280
3000
3620
4280
4500
4360
3840
4620
4700
5280
4700
5340
5200
3880
4920
4600
5360
4960
4060
4880
4980
5440
5320
5960
5460
3780
5220
5920
6060
5100
4400
5480
5240
5160
5620
5440
5460
4680
4940
5900
5580
4480
4600
5540
5800
6460
6100
6080
6080
4860
5740
5980
6660
5520
5360
5900
6360
7280
6220
6660
6860
4460
6360
6480
6800
6460
6060
6760
6860
7320
6680
7220
7160
4100
6560
5780
5500
5800
5300
4240
5620
7100
5960
7360
7420
4760
6040
5940
6720
4700
3100
3880
3540
4160
5260
6040
5800
4180
5120
5980
6940
5440
4360
4640
5540
6840
6340
6620
6680


Summary of computational transaction
Raw Input view raw input (R code)
Raw Outputview raw output of R engine
Computing time3 seconds
R ServerBig Analytics Cloud Computing Center

\begin{tabular}{lllllllll}
\hline
Summary of computational transaction \tabularnewline
Raw Input view raw input (R code)  \tabularnewline
Raw Outputview raw output of R engine  \tabularnewline
Computing time3 seconds \tabularnewline
R ServerBig Analytics Cloud Computing Center \tabularnewline
\hline
\end{tabular}
%Source: https://freestatistics.org/blog/index.php?pk=300182&T=0

[TABLE]
[ROW]
Summary of computational transaction[/C][/ROW] [ROW]Raw Input[/C] view raw input (R code) [/C][/ROW] [ROW]Raw Output[/C]view raw output of R engine [/C][/ROW] [ROW]Computing time[/C]3 seconds[/C][/ROW] [ROW]R Server[/C]Big Analytics Cloud Computing Center[/C][/ROW] [/TABLE] Source: https://freestatistics.org/blog/index.php?pk=300182&T=0

Globally Unique Identifier (entire table): ba.freestatistics.org/blog/index.php?pk=300182&T=0

As an alternative you can also use a QR Code:  

The GUIDs for individual cells are displayed in the table below:

Summary of computational transaction
Raw Input view raw input (R code)
Raw Outputview raw output of R engine
Computing time3 seconds
R ServerBig Analytics Cloud Computing Center


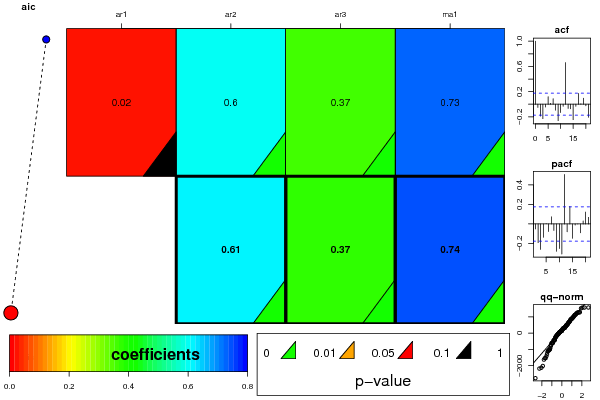
ARIMA Parameter Estimation and Backward Selection
Iterationar1ar2ar3ma1
Estimates ( 1 )0.01820.59710.36780.7301
(p-val)(0.8783 )(0 )(0 )(0 )
Estimates ( 2 )00.60910.37380.7407
(p-val)(NA )(0 )(0 )(0 )
Estimates ( 3 )NANANANA
(p-val)(NA )(NA )(NA )(NA )
Estimates ( 4 )NANANANA
(p-val)(NA )(NA )(NA )(NA )
Estimates ( 5 )NANANANA
(p-val)(NA )(NA )(NA )(NA )
Estimates ( 6 )NANANANA
(p-val)(NA )(NA )(NA )(NA )
Estimates ( 7 )NANANANA
(p-val)(NA )(NA )(NA )(NA )

\begin{tabular}{lllllllll}
\hline
ARIMA Parameter Estimation and Backward Selection \tabularnewline
Iteration & ar1 & ar2 & ar3 & ma1 \tabularnewline
Estimates ( 1 ) & 0.0182 & 0.5971 & 0.3678 & 0.7301 \tabularnewline
(p-val) & (0.8783 ) & (0 ) & (0 ) & (0 ) \tabularnewline
Estimates ( 2 ) & 0 & 0.6091 & 0.3738 & 0.7407 \tabularnewline
(p-val) & (NA ) & (0 ) & (0 ) & (0 ) \tabularnewline
Estimates ( 3 ) & NA & NA & NA & NA \tabularnewline
(p-val) & (NA ) & (NA ) & (NA ) & (NA ) \tabularnewline
Estimates ( 4 ) & NA & NA & NA & NA \tabularnewline
(p-val) & (NA ) & (NA ) & (NA ) & (NA ) \tabularnewline
Estimates ( 5 ) & NA & NA & NA & NA \tabularnewline
(p-val) & (NA ) & (NA ) & (NA ) & (NA ) \tabularnewline
Estimates ( 6 ) & NA & NA & NA & NA \tabularnewline
(p-val) & (NA ) & (NA ) & (NA ) & (NA ) \tabularnewline
Estimates ( 7 ) & NA & NA & NA & NA \tabularnewline
(p-val) & (NA ) & (NA ) & (NA ) & (NA ) \tabularnewline
\hline
\end{tabular}
%Source: https://freestatistics.org/blog/index.php?pk=300182&T=1

[TABLE]
[ROW][C]ARIMA Parameter Estimation and Backward Selection[/C][/ROW]
[ROW][C]Iteration[/C][C]ar1[/C][C]ar2[/C][C]ar3[/C][C]ma1[/C][/ROW]
[ROW][C]Estimates ( 1 )[/C][C]0.0182[/C][C]0.5971[/C][C]0.3678[/C][C]0.7301[/C][/ROW]
[ROW][C](p-val)[/C][C](0.8783 )[/C][C](0 )[/C][C](0 )[/C][C](0 )[/C][/ROW]
[ROW][C]Estimates ( 2 )[/C][C]0[/C][C]0.6091[/C][C]0.3738[/C][C]0.7407[/C][/ROW]
[ROW][C](p-val)[/C][C](NA )[/C][C](0 )[/C][C](0 )[/C][C](0 )[/C][/ROW]
[ROW][C]Estimates ( 3 )[/C][C]NA[/C][C]NA[/C][C]NA[/C][C]NA[/C][/ROW]
[ROW][C](p-val)[/C][C](NA )[/C][C](NA )[/C][C](NA )[/C][C](NA )[/C][/ROW]
[ROW][C]Estimates ( 4 )[/C][C]NA[/C][C]NA[/C][C]NA[/C][C]NA[/C][/ROW]
[ROW][C](p-val)[/C][C](NA )[/C][C](NA )[/C][C](NA )[/C][C](NA )[/C][/ROW]
[ROW][C]Estimates ( 5 )[/C][C]NA[/C][C]NA[/C][C]NA[/C][C]NA[/C][/ROW]
[ROW][C](p-val)[/C][C](NA )[/C][C](NA )[/C][C](NA )[/C][C](NA )[/C][/ROW]
[ROW][C]Estimates ( 6 )[/C][C]NA[/C][C]NA[/C][C]NA[/C][C]NA[/C][/ROW]
[ROW][C](p-val)[/C][C](NA )[/C][C](NA )[/C][C](NA )[/C][C](NA )[/C][/ROW]
[ROW][C]Estimates ( 7 )[/C][C]NA[/C][C]NA[/C][C]NA[/C][C]NA[/C][/ROW]
[ROW][C](p-val)[/C][C](NA )[/C][C](NA )[/C][C](NA )[/C][C](NA )[/C][/ROW]
[/TABLE]
Source: https://freestatistics.org/blog/index.php?pk=300182&T=1

Globally Unique Identifier (entire table): ba.freestatistics.org/blog/index.php?pk=300182&T=1

As an alternative you can also use a QR Code:  

The GUIDs for individual cells are displayed in the table below:

ARIMA Parameter Estimation and Backward Selection
Iterationar1ar2ar3ma1
Estimates ( 1 )0.01820.59710.36780.7301
(p-val)(0.8783 )(0 )(0 )(0 )
Estimates ( 2 )00.60910.37380.7407
(p-val)(NA )(0 )(0 )(0 )
Estimates ( 3 )NANANANA
(p-val)(NA )(NA )(NA )(NA )
Estimates ( 4 )NANANANA
(p-val)(NA )(NA )(NA )(NA )
Estimates ( 5 )NANANANA
(p-val)(NA )(NA )(NA )(NA )
Estimates ( 6 )NANANANA
(p-val)(NA )(NA )(NA )(NA )
Estimates ( 7 )NANANANA
(p-val)(NA )(NA )(NA )(NA )


Estimated ARIMA Residuals
Value
349.663005062285
495.436654901503
1127.14657246739
137.785325027147
261.458135094129
312.177478892113
-609.257278755914
-608.248098476695
26.4035471792763
-145.376105590401
-311.477370011608
-37.844018416022
255.709543758053
439.967911880284
1278.45684762859
-198.36405077625
464.268085426776
208.676207978756
-911.47564609457
218.790842627726
688.922344515609
654.230530100554
-86.5715913155765
-437.26828533546
610.917364601702
273.43777063689
823.876306089072
-503.197196684089
740.504193557379
-186.15943912993
-995.887386989479
507.516561460853
-89.3528100737575
976.723311364037
-406.871990413374
-625.542286864551
329.804453754165
401.911669675171
648.819200266017
-21.1155671869341
798.73693841244
-409.011847668882
-1536.15437088814
820.506885905879
960.761399600098
743.664800555911
-1007.98053193432
-752.682215003829
675.397210744394
144.168679070564
68.9499738354842
331.417720961649
87.4623372494524
43.5969262412964
-766.442119720974
153.418333420592
895.491017858399
147.865310571908
-1069.32968032245
-202.642196942631
876.926073016398
664.545577089501
869.449469029109
-153.129277892673
90.2851835904457
-114.84835067069
-1040.73144965132
544.804843292074
339.676587179402
1088.31611399182
-1077.60264637984
-129.828264579355
151.723513656823
911.161328837049
1004.72515968261
-613.599173650945
308.69381263517
121.899618667532
-2018.2324275826
1206.68739895646
297.127712063631
1027.19020585284
-622.110872383074
-46.9725944305201
325.715893389025
504.78103186825
561.356840694012
-445.480164847308
529.803562566844
-39.1053466033063
-2769.70835148828
1576.79378388892
-572.100632191014
387.531008410488
-447.023389202996
110.907594204347
-1423.50554571995
1284.28207766495
1579.05190868321
-237.24453675599
1118.28892211385
299.531850662173
-2180.46599406458
407.83871130761
-38.9060074075887
1283.09263936893
-2127.35414138859
-1629.59981350935
-264.611014314271
82.9462773964933
578.084803405505
1221.44993383437
1266.55402446933
94.575429029841
-1535.71288160598
480.466224518795
906.949120152326
1574.4584030132
-1289.60082433562
-1140.78576209239
-407.194709370841
1148.68956746737
1526.37867692887
86.5940345755098
319.616252315027
24.8257793763814

\begin{tabular}{lllllllll}
\hline
Estimated ARIMA Residuals \tabularnewline
Value \tabularnewline
 \tabularnewline
349.663005062285 \tabularnewline
495.436654901503 \tabularnewline
1127.14657246739 \tabularnewline
137.785325027147 \tabularnewline
261.458135094129 \tabularnewline
312.177478892113 \tabularnewline
-609.257278755914 \tabularnewline
-608.248098476695 \tabularnewline
26.4035471792763 \tabularnewline
-145.376105590401 \tabularnewline
-311.477370011608 \tabularnewline
-37.844018416022 \tabularnewline
255.709543758053 \tabularnewline
439.967911880284 \tabularnewline
1278.45684762859 \tabularnewline
-198.36405077625 \tabularnewline
464.268085426776 \tabularnewline
208.676207978756 \tabularnewline
-911.47564609457 \tabularnewline
218.790842627726 \tabularnewline
688.922344515609 \tabularnewline
654.230530100554 \tabularnewline
-86.5715913155765 \tabularnewline
-437.26828533546 \tabularnewline
610.917364601702 \tabularnewline
273.43777063689 \tabularnewline
823.876306089072 \tabularnewline
-503.197196684089 \tabularnewline
740.504193557379 \tabularnewline
-186.15943912993 \tabularnewline
-995.887386989479 \tabularnewline
507.516561460853 \tabularnewline
-89.3528100737575 \tabularnewline
976.723311364037 \tabularnewline
-406.871990413374 \tabularnewline
-625.542286864551 \tabularnewline
329.804453754165 \tabularnewline
401.911669675171 \tabularnewline
648.819200266017 \tabularnewline
-21.1155671869341 \tabularnewline
798.73693841244 \tabularnewline
-409.011847668882 \tabularnewline
-1536.15437088814 \tabularnewline
820.506885905879 \tabularnewline
960.761399600098 \tabularnewline
743.664800555911 \tabularnewline
-1007.98053193432 \tabularnewline
-752.682215003829 \tabularnewline
675.397210744394 \tabularnewline
144.168679070564 \tabularnewline
68.9499738354842 \tabularnewline
331.417720961649 \tabularnewline
87.4623372494524 \tabularnewline
43.5969262412964 \tabularnewline
-766.442119720974 \tabularnewline
153.418333420592 \tabularnewline
895.491017858399 \tabularnewline
147.865310571908 \tabularnewline
-1069.32968032245 \tabularnewline
-202.642196942631 \tabularnewline
876.926073016398 \tabularnewline
664.545577089501 \tabularnewline
869.449469029109 \tabularnewline
-153.129277892673 \tabularnewline
90.2851835904457 \tabularnewline
-114.84835067069 \tabularnewline
-1040.73144965132 \tabularnewline
544.804843292074 \tabularnewline
339.676587179402 \tabularnewline
1088.31611399182 \tabularnewline
-1077.60264637984 \tabularnewline
-129.828264579355 \tabularnewline
151.723513656823 \tabularnewline
911.161328837049 \tabularnewline
1004.72515968261 \tabularnewline
-613.599173650945 \tabularnewline
308.69381263517 \tabularnewline
121.899618667532 \tabularnewline
-2018.2324275826 \tabularnewline
1206.68739895646 \tabularnewline
297.127712063631 \tabularnewline
1027.19020585284 \tabularnewline
-622.110872383074 \tabularnewline
-46.9725944305201 \tabularnewline
325.715893389025 \tabularnewline
504.78103186825 \tabularnewline
561.356840694012 \tabularnewline
-445.480164847308 \tabularnewline
529.803562566844 \tabularnewline
-39.1053466033063 \tabularnewline
-2769.70835148828 \tabularnewline
1576.79378388892 \tabularnewline
-572.100632191014 \tabularnewline
387.531008410488 \tabularnewline
-447.023389202996 \tabularnewline
110.907594204347 \tabularnewline
-1423.50554571995 \tabularnewline
1284.28207766495 \tabularnewline
1579.05190868321 \tabularnewline
-237.24453675599 \tabularnewline
1118.28892211385 \tabularnewline
299.531850662173 \tabularnewline
-2180.46599406458 \tabularnewline
407.83871130761 \tabularnewline
-38.9060074075887 \tabularnewline
1283.09263936893 \tabularnewline
-2127.35414138859 \tabularnewline
-1629.59981350935 \tabularnewline
-264.611014314271 \tabularnewline
82.9462773964933 \tabularnewline
578.084803405505 \tabularnewline
1221.44993383437 \tabularnewline
1266.55402446933 \tabularnewline
94.575429029841 \tabularnewline
-1535.71288160598 \tabularnewline
480.466224518795 \tabularnewline
906.949120152326 \tabularnewline
1574.4584030132 \tabularnewline
-1289.60082433562 \tabularnewline
-1140.78576209239 \tabularnewline
-407.194709370841 \tabularnewline
1148.68956746737 \tabularnewline
1526.37867692887 \tabularnewline
86.5940345755098 \tabularnewline
319.616252315027 \tabularnewline
24.8257793763814 \tabularnewline
\hline
\end{tabular}
%Source: https://freestatistics.org/blog/index.php?pk=300182&T=2

[TABLE]
[ROW][C]Estimated ARIMA Residuals[/C][/ROW]
[ROW][C]Value[/C][/ROW]
[ROW][C][/C][/ROW]
[ROW][C]349.663005062285[/C][/ROW]
[ROW][C]495.436654901503[/C][/ROW]
[ROW][C]1127.14657246739[/C][/ROW]
[ROW][C]137.785325027147[/C][/ROW]
[ROW][C]261.458135094129[/C][/ROW]
[ROW][C]312.177478892113[/C][/ROW]
[ROW][C]-609.257278755914[/C][/ROW]
[ROW][C]-608.248098476695[/C][/ROW]
[ROW][C]26.4035471792763[/C][/ROW]
[ROW][C]-145.376105590401[/C][/ROW]
[ROW][C]-311.477370011608[/C][/ROW]
[ROW][C]-37.844018416022[/C][/ROW]
[ROW][C]255.709543758053[/C][/ROW]
[ROW][C]439.967911880284[/C][/ROW]
[ROW][C]1278.45684762859[/C][/ROW]
[ROW][C]-198.36405077625[/C][/ROW]
[ROW][C]464.268085426776[/C][/ROW]
[ROW][C]208.676207978756[/C][/ROW]
[ROW][C]-911.47564609457[/C][/ROW]
[ROW][C]218.790842627726[/C][/ROW]
[ROW][C]688.922344515609[/C][/ROW]
[ROW][C]654.230530100554[/C][/ROW]
[ROW][C]-86.5715913155765[/C][/ROW]
[ROW][C]-437.26828533546[/C][/ROW]
[ROW][C]610.917364601702[/C][/ROW]
[ROW][C]273.43777063689[/C][/ROW]
[ROW][C]823.876306089072[/C][/ROW]
[ROW][C]-503.197196684089[/C][/ROW]
[ROW][C]740.504193557379[/C][/ROW]
[ROW][C]-186.15943912993[/C][/ROW]
[ROW][C]-995.887386989479[/C][/ROW]
[ROW][C]507.516561460853[/C][/ROW]
[ROW][C]-89.3528100737575[/C][/ROW]
[ROW][C]976.723311364037[/C][/ROW]
[ROW][C]-406.871990413374[/C][/ROW]
[ROW][C]-625.542286864551[/C][/ROW]
[ROW][C]329.804453754165[/C][/ROW]
[ROW][C]401.911669675171[/C][/ROW]
[ROW][C]648.819200266017[/C][/ROW]
[ROW][C]-21.1155671869341[/C][/ROW]
[ROW][C]798.73693841244[/C][/ROW]
[ROW][C]-409.011847668882[/C][/ROW]
[ROW][C]-1536.15437088814[/C][/ROW]
[ROW][C]820.506885905879[/C][/ROW]
[ROW][C]960.761399600098[/C][/ROW]
[ROW][C]743.664800555911[/C][/ROW]
[ROW][C]-1007.98053193432[/C][/ROW]
[ROW][C]-752.682215003829[/C][/ROW]
[ROW][C]675.397210744394[/C][/ROW]
[ROW][C]144.168679070564[/C][/ROW]
[ROW][C]68.9499738354842[/C][/ROW]
[ROW][C]331.417720961649[/C][/ROW]
[ROW][C]87.4623372494524[/C][/ROW]
[ROW][C]43.5969262412964[/C][/ROW]
[ROW][C]-766.442119720974[/C][/ROW]
[ROW][C]153.418333420592[/C][/ROW]
[ROW][C]895.491017858399[/C][/ROW]
[ROW][C]147.865310571908[/C][/ROW]
[ROW][C]-1069.32968032245[/C][/ROW]
[ROW][C]-202.642196942631[/C][/ROW]
[ROW][C]876.926073016398[/C][/ROW]
[ROW][C]664.545577089501[/C][/ROW]
[ROW][C]869.449469029109[/C][/ROW]
[ROW][C]-153.129277892673[/C][/ROW]
[ROW][C]90.2851835904457[/C][/ROW]
[ROW][C]-114.84835067069[/C][/ROW]
[ROW][C]-1040.73144965132[/C][/ROW]
[ROW][C]544.804843292074[/C][/ROW]
[ROW][C]339.676587179402[/C][/ROW]
[ROW][C]1088.31611399182[/C][/ROW]
[ROW][C]-1077.60264637984[/C][/ROW]
[ROW][C]-129.828264579355[/C][/ROW]
[ROW][C]151.723513656823[/C][/ROW]
[ROW][C]911.161328837049[/C][/ROW]
[ROW][C]1004.72515968261[/C][/ROW]
[ROW][C]-613.599173650945[/C][/ROW]
[ROW][C]308.69381263517[/C][/ROW]
[ROW][C]121.899618667532[/C][/ROW]
[ROW][C]-2018.2324275826[/C][/ROW]
[ROW][C]1206.68739895646[/C][/ROW]
[ROW][C]297.127712063631[/C][/ROW]
[ROW][C]1027.19020585284[/C][/ROW]
[ROW][C]-622.110872383074[/C][/ROW]
[ROW][C]-46.9725944305201[/C][/ROW]
[ROW][C]325.715893389025[/C][/ROW]
[ROW][C]504.78103186825[/C][/ROW]
[ROW][C]561.356840694012[/C][/ROW]
[ROW][C]-445.480164847308[/C][/ROW]
[ROW][C]529.803562566844[/C][/ROW]
[ROW][C]-39.1053466033063[/C][/ROW]
[ROW][C]-2769.70835148828[/C][/ROW]
[ROW][C]1576.79378388892[/C][/ROW]
[ROW][C]-572.100632191014[/C][/ROW]
[ROW][C]387.531008410488[/C][/ROW]
[ROW][C]-447.023389202996[/C][/ROW]
[ROW][C]110.907594204347[/C][/ROW]
[ROW][C]-1423.50554571995[/C][/ROW]
[ROW][C]1284.28207766495[/C][/ROW]
[ROW][C]1579.05190868321[/C][/ROW]
[ROW][C]-237.24453675599[/C][/ROW]
[ROW][C]1118.28892211385[/C][/ROW]
[ROW][C]299.531850662173[/C][/ROW]
[ROW][C]-2180.46599406458[/C][/ROW]
[ROW][C]407.83871130761[/C][/ROW]
[ROW][C]-38.9060074075887[/C][/ROW]
[ROW][C]1283.09263936893[/C][/ROW]
[ROW][C]-2127.35414138859[/C][/ROW]
[ROW][C]-1629.59981350935[/C][/ROW]
[ROW][C]-264.611014314271[/C][/ROW]
[ROW][C]82.9462773964933[/C][/ROW]
[ROW][C]578.084803405505[/C][/ROW]
[ROW][C]1221.44993383437[/C][/ROW]
[ROW][C]1266.55402446933[/C][/ROW]
[ROW][C]94.575429029841[/C][/ROW]
[ROW][C]-1535.71288160598[/C][/ROW]
[ROW][C]480.466224518795[/C][/ROW]
[ROW][C]906.949120152326[/C][/ROW]
[ROW][C]1574.4584030132[/C][/ROW]
[ROW][C]-1289.60082433562[/C][/ROW]
[ROW][C]-1140.78576209239[/C][/ROW]
[ROW][C]-407.194709370841[/C][/ROW]
[ROW][C]1148.68956746737[/C][/ROW]
[ROW][C]1526.37867692887[/C][/ROW]
[ROW][C]86.5940345755098[/C][/ROW]
[ROW][C]319.616252315027[/C][/ROW]
[ROW][C]24.8257793763814[/C][/ROW]
[/TABLE]
Source: https://freestatistics.org/blog/index.php?pk=300182&T=2

Globally Unique Identifier (entire table): ba.freestatistics.org/blog/index.php?pk=300182&T=2

As an alternative you can also use a QR Code:  

The GUIDs for individual cells are displayed in the table below:

Estimated ARIMA Residuals
Value
349.663005062285
495.436654901503
1127.14657246739
137.785325027147
261.458135094129
312.177478892113
-609.257278755914
-608.248098476695
26.4035471792763
-145.376105590401
-311.477370011608
-37.844018416022
255.709543758053
439.967911880284
1278.45684762859
-198.36405077625
464.268085426776
208.676207978756
-911.47564609457
218.790842627726
688.922344515609
654.230530100554
-86.5715913155765
-437.26828533546
610.917364601702
273.43777063689
823.876306089072
-503.197196684089
740.504193557379
-186.15943912993
-995.887386989479
507.516561460853
-89.3528100737575
976.723311364037
-406.871990413374
-625.542286864551
329.804453754165
401.911669675171
648.819200266017
-21.1155671869341
798.73693841244
-409.011847668882
-1536.15437088814
820.506885905879
960.761399600098
743.664800555911
-1007.98053193432
-752.682215003829
675.397210744394
144.168679070564
68.9499738354842
331.417720961649
87.4623372494524
43.5969262412964
-766.442119720974
153.418333420592
895.491017858399
147.865310571908
-1069.32968032245
-202.642196942631
876.926073016398
664.545577089501
869.449469029109
-153.129277892673
90.2851835904457
-114.84835067069
-1040.73144965132
544.804843292074
339.676587179402
1088.31611399182
-1077.60264637984
-129.828264579355
151.723513656823
911.161328837049
1004.72515968261
-613.599173650945
308.69381263517
121.899618667532
-2018.2324275826
1206.68739895646
297.127712063631
1027.19020585284
-622.110872383074
-46.9725944305201
325.715893389025
504.78103186825
561.356840694012
-445.480164847308
529.803562566844
-39.1053466033063
-2769.70835148828
1576.79378388892
-572.100632191014
387.531008410488
-447.023389202996
110.907594204347
-1423.50554571995
1284.28207766495
1579.05190868321
-237.24453675599
1118.28892211385
299.531850662173
-2180.46599406458
407.83871130761
-38.9060074075887
1283.09263936893
-2127.35414138859
-1629.59981350935
-264.611014314271
82.9462773964933
578.084803405505
1221.44993383437
1266.55402446933
94.575429029841
-1535.71288160598
480.466224518795
906.949120152326
1574.4584030132
-1289.60082433562
-1140.78576209239
-407.194709370841
1148.68956746737
1526.37867692887
86.5940345755098
319.616252315027
24.8257793763814


Parameters (Session):
par1 = FALSE ; par2 = 1 ; par3 = 0 ; par4 = 0 ; par5 = 1 ; par6 = 3 ; par7 = 1 ; par8 = 0 ; par9 = 0 ;
Parameters (R input):
par1 = FALSE ; par2 = 1 ; par3 = 0 ; par4 = 0 ; par5 = 1 ; par6 = 3 ; par7 = 1 ; par8 = 0 ; par9 = 0 ;
R code (references can be found in the software module):
library(lattice)
if (par1 == 'TRUE') par1 <- TRUE
if (par1 == 'FALSE') par1 <- FALSE
par2 <- as.numeric(par2) #Box-Cox lambda transformation parameter
par3 <- as.numeric(par3) #degree of non-seasonal differencing
par4 <- as.numeric(par4) #degree of seasonal differencing
par5 <- as.numeric(par5) #seasonal period
par6 <- as.numeric(par6) #degree (p) of the non-seasonal AR(p) polynomial
par7 <- as.numeric(par7) #degree (q) of the non-seasonal MA(q) polynomial
par8 <- as.numeric(par8) #degree (P) of the seasonal AR(P) polynomial
par9 <- as.numeric(par9) #degree (Q) of the seasonal MA(Q) polynomial
armaGR <- function(arima.out, names, n){
try1 <- arima.out$coef
try2 <- sqrt(diag(arima.out$var.coef))
try.data.frame <- data.frame(matrix(NA,ncol=4,nrow=length(names)))
dimnames(try.data.frame) <- list(names,c('coef','std','tstat','pv'))
try.data.frame[,1] <- try1
for(i in 1:length(try2)) try.data.frame[which(rownames(try.data.frame)==names(try2)[i]),2] <- try2[i]
try.data.frame[,3] <- try.data.frame[,1] / try.data.frame[,2]
try.data.frame[,4] <- round((1-pt(abs(try.data.frame[,3]),df=n-(length(try2)+1)))*2,5)
vector <- rep(NA,length(names))
vector[is.na(try.data.frame[,4])] <- 0
maxi <- which.max(try.data.frame[,4])
continue <- max(try.data.frame[,4],na.rm=TRUE) > .05
vector[maxi] <- 0
list(summary=try.data.frame,next.vector=vector,continue=continue)
}
arimaSelect <- function(series, order=c(13,0,0), seasonal=list(order=c(2,0,0),period=12), include.mean=F){
nrc <- order[1]+order[3]+seasonal$order[1]+seasonal$order[3]
coeff <- matrix(NA, nrow=nrc*2, ncol=nrc)
pval <- matrix(NA, nrow=nrc*2, ncol=nrc)
mylist <- rep(list(NULL), nrc)
names <- NULL
if(order[1] > 0) names <- paste('ar',1:order[1],sep='')
if(order[3] > 0) names <- c( names , paste('ma',1:order[3],sep='') )
if(seasonal$order[1] > 0) names <- c(names, paste('sar',1:seasonal$order[1],sep=''))
if(seasonal$order[3] > 0) names <- c(names, paste('sma',1:seasonal$order[3],sep=''))
arima.out <- arima(series, order=order, seasonal=seasonal, include.mean=include.mean, method='ML')
mylist[[1]] <- arima.out
last.arma <- armaGR(arima.out, names, length(series))
mystop <- FALSE
i <- 1
coeff[i,] <- last.arma[[1]][,1]
pval [i,] <- last.arma[[1]][,4]
i <- 2
aic <- arima.out$aic
while(!mystop){
mylist[[i]] <- arima.out
arima.out <- arima(series, order=order, seasonal=seasonal, include.mean=include.mean, method='ML', fixed=last.arma$next.vector)
aic <- c(aic, arima.out$aic)
last.arma <- armaGR(arima.out, names, length(series))
mystop <- !last.arma$continue
coeff[i,] <- last.arma[[1]][,1]
pval [i,] <- last.arma[[1]][,4]
i <- i+1
}
list(coeff, pval, mylist, aic=aic)
}
arimaSelectplot <- function(arimaSelect.out,noms,choix){
noms <- names(arimaSelect.out[[3]][[1]]$coef)
coeff <- arimaSelect.out[[1]]
k <- min(which(is.na(coeff[,1])))-1
coeff <- coeff[1:k,]
pval <- arimaSelect.out[[2]][1:k,]
aic <- arimaSelect.out$aic[1:k]
coeff[coeff==0] <- NA
n <- ncol(coeff)
if(missing(choix)) choix <- k
layout(matrix(c(1,1,1,2,
3,3,3,2,
3,3,3,4,
5,6,7,7),nr=4),
widths=c(10,35,45,15),
heights=c(30,30,15,15))
couleurs <- rainbow(75)[1:50]#(50)
ticks <- pretty(coeff)
par(mar=c(1,1,3,1))
plot(aic,k:1-.5,type='o',pch=21,bg='blue',cex=2,axes=F,lty=2,xpd=NA)
points(aic[choix],k-choix+.5,pch=21,cex=4,bg=2,xpd=NA)
title('aic',line=2)
par(mar=c(3,0,0,0))
plot(0,axes=F,xlab='',ylab='',xlim=range(ticks),ylim=c(.1,1))
rect(xleft = min(ticks) + (0:49)/50*(max(ticks)-min(ticks)),
xright = min(ticks) + (1:50)/50*(max(ticks)-min(ticks)),
ytop = rep(1,50),
ybottom= rep(0,50),col=couleurs,border=NA)
axis(1,ticks)
rect(xleft=min(ticks),xright=max(ticks),ytop=1,ybottom=0)
text(mean(coeff,na.rm=T),.5,'coefficients',cex=2,font=2)
par(mar=c(1,1,3,1))
image(1:n,1:k,t(coeff[k:1,]),axes=F,col=couleurs,zlim=range(ticks))
for(i in 1:n) for(j in 1:k) if(!is.na(coeff[j,i])) {
if(pval[j,i]<.01) symb = 'green'
else if( (pval[j,i]<.05) & (pval[j,i]>=.01)) symb = 'orange'
else if( (pval[j,i]<.1) & (pval[j,i]>=.05)) symb = 'red'
else symb = 'black'
polygon(c(i+.5 ,i+.2 ,i+.5 ,i+.5),
c(k-j+0.5,k-j+0.5,k-j+0.8,k-j+0.5),
col=symb)
if(j==choix) {
rect(xleft=i-.5,
xright=i+.5,
ybottom=k-j+1.5,
ytop=k-j+.5,
lwd=4)
text(i,
k-j+1,
round(coeff[j,i],2),
cex=1.2,
font=2)
}
else{
rect(xleft=i-.5,xright=i+.5,ybottom=k-j+1.5,ytop=k-j+.5)
text(i,k-j+1,round(coeff[j,i],2),cex=1.2,font=1)
}
}
axis(3,1:n,noms)
par(mar=c(0.5,0,0,0.5))
plot(0,axes=F,xlab='',ylab='',type='n',xlim=c(0,8),ylim=c(-.2,.8))
cols <- c('green','orange','red','black')
niv <- c('0','0.01','0.05','0.1')
for(i in 0:3){
polygon(c(1+2*i ,1+2*i ,1+2*i-.5 ,1+2*i),
c(.4 ,.7 , .4 , .4),
col=cols[i+1])
text(2*i,0.5,niv[i+1],cex=1.5)
}
text(8,.5,1,cex=1.5)
text(4,0,'p-value',cex=2)
box()
residus <- arimaSelect.out[[3]][[choix]]$res
par(mar=c(1,2,4,1))
acf(residus,main='')
title('acf',line=.5)
par(mar=c(1,2,4,1))
pacf(residus,main='')
title('pacf',line=.5)
par(mar=c(2,2,4,1))
qqnorm(residus,main='')
title('qq-norm',line=.5)
qqline(residus)
residus
}
if (par2 == 0) x <- log(x)
if (par2 != 0) x <- x^par2
(selection <- arimaSelect(x, order=c(par6,par3,par7), seasonal=list(order=c(par8,par4,par9), period=par5)))
bitmap(file='test1.png')
resid <- arimaSelectplot(selection)
dev.off()
resid
bitmap(file='test2.png')
acf(resid,length(resid)/2, main='Residual Autocorrelation Function')
dev.off()
bitmap(file='test3.png')
pacf(resid,length(resid)/2, main='Residual Partial Autocorrelation Function')
dev.off()
bitmap(file='test4.png')
cpgram(resid, main='Residual Cumulative Periodogram')
dev.off()
bitmap(file='test5.png')
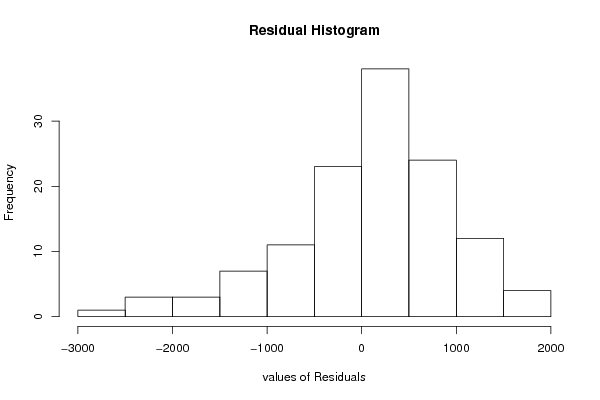
hist(resid, main='Residual Histogram', xlab='values of Residuals')
dev.off()
bitmap(file='test6.png')
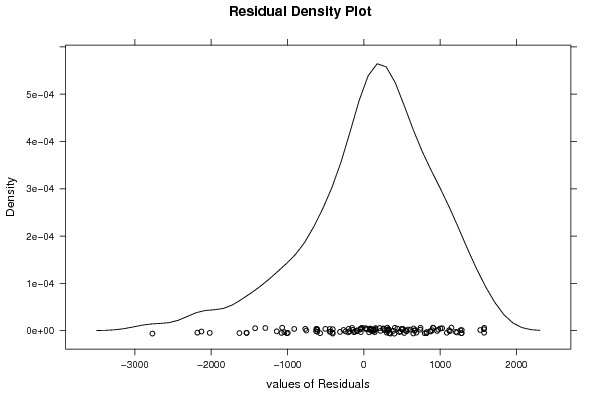
densityplot(~resid,col='black',main='Residual Density Plot', xlab='values of Residuals')
dev.off()
bitmap(file='test7.png')
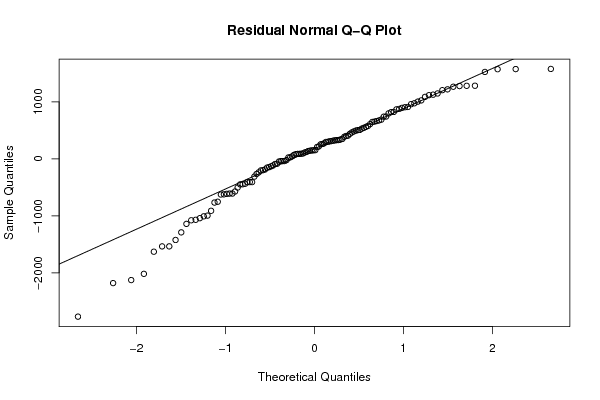
qqnorm(resid, main='Residual Normal Q-Q Plot')
qqline(resid)
dev.off()
ncols <- length(selection[[1]][1,])
nrows <- length(selection[[2]][,1])-1
load(file='createtable')
a<-table.start()
a<-table.row.start(a)
a<-table.element(a,'ARIMA Parameter Estimation and Backward Selection', ncols+1,TRUE)
a<-table.row.end(a)
a<-table.row.start(a)
a<-table.element(a,'Iteration', header=TRUE)
for (i in 1:ncols) {
a<-table.element(a,names(selection[[3]][[1]]$coef)[i],header=TRUE)
}
a<-table.row.end(a)
for (j in 1:nrows) {
a<-table.row.start(a)
mydum <- 'Estimates ('
mydum <- paste(mydum,j)
mydum <- paste(mydum,')')
a<-table.element(a,mydum, header=TRUE)
for (i in 1:ncols) {
a<-table.element(a,round(selection[[1]][j,i],4))
}
a<-table.row.end(a)
a<-table.row.start(a)
a<-table.element(a,'(p-val)', header=TRUE)
for (i in 1:ncols) {
mydum <- '('
mydum <- paste(mydum,round(selection[[2]][j,i],4),sep='')
mydum <- paste(mydum,')')
a<-table.element(a,mydum)
}
a<-table.row.end(a)
}
a<-table.end(a)
table.save(a,file='mytable.tab')
a<-table.start()
a<-table.row.start(a)
a<-table.element(a,'Estimated ARIMA Residuals', 1,TRUE)
a<-table.row.end(a)
a<-table.row.start(a)
a<-table.element(a,'Value', 1,TRUE)
a<-table.row.end(a)
for (i in (par4*par5+par3):length(resid)) {
a<-table.row.start(a)
a<-table.element(a,resid[i])
a<-table.row.end(a)
}
a<-table.end(a)
table.save(a,file='mytable1.tab')