Free Statistics

of Irreproducible Research!

Author's title

Author*The author of this computation has been verified*
R Software Modulerwasp_autocorrelation.wasp
Title produced by software(Partial) Autocorrelation Function
Date of computationThu, 15 Dec 2016 23:39:00 +0100
Cite this page as followsStatistical Computations at FreeStatistics.org, Office for Research Development and Education, URL https://freestatistics.org/blog/index.php?v=date/2016/Dec/15/t1481841604ktlmpq31636jsyi.htm/, Retrieved Fri, 01 Nov 2024 03:43:18 +0000
Statistical Computations at FreeStatistics.org, Office for Research Development and Education, URL https://freestatistics.org/blog/index.php?pk=300040, Retrieved Fri, 01 Nov 2024 03:43:18 +0000
QR Codes:

Original text written by user:
IsPrivate?No (this computation is public)
User-defined keywords
Estimated Impact85
Family? (F = Feedback message, R = changed R code, M = changed R Module, P = changed Parameters, D = changed Data)
-       [(Partial) Autocorrelation Function] [autocorrelation m...] [2016-12-15 22:39:00] [9b0b4f5f4290a2ed9efd388f9ce31ae7] [Current]
Feedback Forum

Post a new message
Dataseries X:
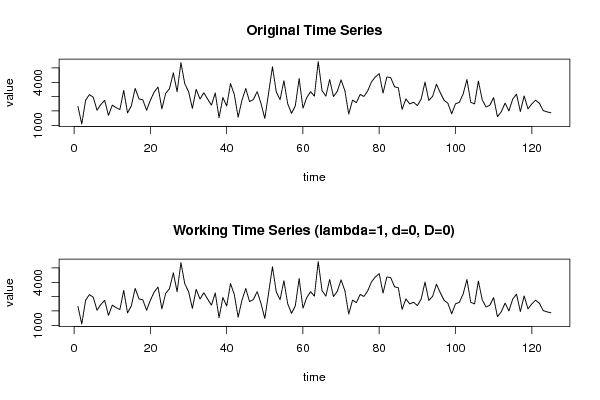
2312
1089
2742
3145
2966
2055
2450
2742
1697
2409
2233
2100
3434
1867
2365
3578
2845
2778
2056
2757
3325
3671
2147
3225
3556
4661
3344
5375
3907
3356
2184
3510
2834
3271
2834
2408
3261
1526
2938
2352
3915
3145
1566
2746
3572
2651
2805
3354
2523
1480
3278
5081
3332
2789
4111
2508
1833
2371
4268
2194
2935
3347
3034
5448
3427
3036
4196
3009
3369
4168
3403
1779
2761
2582
3153
3011
3419
4042
4379
4602
3249
4372
4328
3695
3614
2114
2839
2490
2610
2372
2833
4018
2734
3027
3862
3281
2746
2538
1805
2500
2601
3178
4193
2606
2491
4090
2786
2280
2403
2934
1601
1946
2554
2006
2830
3173
1960
3052
2151
2493
2752
2542
2027
1940
1877


Summary of computational transaction
Raw Input view raw input (R code)
Raw Outputview raw output of R engine
Computing time1 seconds
R ServerBig Analytics Cloud Computing Center

\begin{tabular}{lllllllll}
\hline
Summary of computational transaction \tabularnewline
Raw Input view raw input (R code)  \tabularnewline
Raw Outputview raw output of R engine  \tabularnewline
Computing time1 seconds \tabularnewline
R ServerBig Analytics Cloud Computing Center \tabularnewline
\hline
\end{tabular}
%Source: https://freestatistics.org/blog/index.php?pk=300040&T=0

[TABLE]
[ROW]
Summary of computational transaction[/C][/ROW] [ROW]Raw Input[/C] view raw input (R code) [/C][/ROW] [ROW]Raw Output[/C]view raw output of R engine [/C][/ROW] [ROW]Computing time[/C]1 seconds[/C][/ROW] [ROW]R Server[/C]Big Analytics Cloud Computing Center[/C][/ROW] [/TABLE] Source: https://freestatistics.org/blog/index.php?pk=300040&T=0

Globally Unique Identifier (entire table): ba.freestatistics.org/blog/index.php?pk=300040&T=0

As an alternative you can also use a QR Code:  

The GUIDs for individual cells are displayed in the table below:

Summary of computational transaction
Raw Input view raw input (R code)
Raw Outputview raw output of R engine
Computing time1 seconds
R ServerBig Analytics Cloud Computing Center


Autocorrelation Function
Time lag kACF(k)T-STATP-value
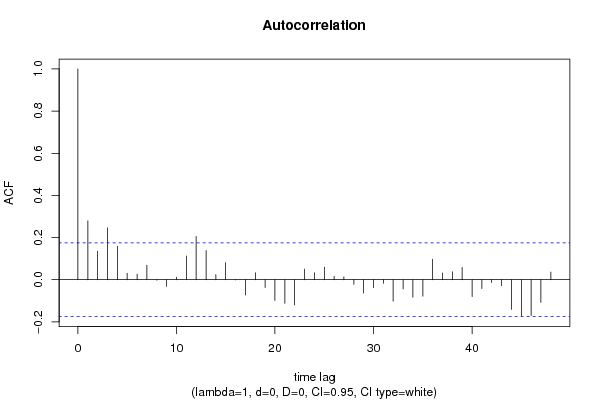
10.2793593.12330.001111
20.1351451.5110.066661
30.2461362.75190.003404
40.1589071.77660.03903
50.0308390.34480.365415
60.026350.29460.384392
70.0687420.76860.221804
8-0.002114-0.02360.49059
9-0.031845-0.3560.361206
100.0116330.13010.448365
110.1121881.25430.106037
120.2053222.29560.011683
130.1380391.54330.06264
140.0240060.26840.394417
150.0801910.89660.185838
16-0.001014-0.01130.495488
17-0.072938-0.81550.208175
180.0331880.3710.355615
19-0.036853-0.4120.340513
20-0.098119-1.0970.137373
21-0.112112-1.25350.106191
22-0.119848-1.33990.091347
230.0503740.56320.287153
240.0326830.36540.357714
250.0592550.66250.254439
260.0159010.17780.429591
270.0133670.14940.440722
28-0.021762-0.24330.404084
29-0.063352-0.70830.240038
30-0.037511-0.41940.337827
31-0.01662-0.18580.426445
32-0.10165-1.13650.128964
33-0.043719-0.48880.312923
34-0.083217-0.93040.176981
35-0.077973-0.87180.192503
360.0971831.08650.139666
370.0314820.3520.362723
380.0373610.41770.338438
390.0580410.64890.258792
40-0.079813-0.89230.186963
41-0.042144-0.47120.319163
42-0.013319-0.14890.440932
43-0.028142-0.31460.376783
44-0.140694-1.5730.059123
45-0.172658-1.93040.027913
46-0.169796-1.89840.029976
47-0.107439-1.20120.11597
480.0360620.40320.343752

\begin{tabular}{lllllllll}
\hline
Autocorrelation Function \tabularnewline
Time lag k & ACF(k) & T-STAT & P-value \tabularnewline
1 & 0.279359 & 3.1233 & 0.001111 \tabularnewline
2 & 0.135145 & 1.511 & 0.066661 \tabularnewline
3 & 0.246136 & 2.7519 & 0.003404 \tabularnewline
4 & 0.158907 & 1.7766 & 0.03903 \tabularnewline
5 & 0.030839 & 0.3448 & 0.365415 \tabularnewline
6 & 0.02635 & 0.2946 & 0.384392 \tabularnewline
7 & 0.068742 & 0.7686 & 0.221804 \tabularnewline
8 & -0.002114 & -0.0236 & 0.49059 \tabularnewline
9 & -0.031845 & -0.356 & 0.361206 \tabularnewline
10 & 0.011633 & 0.1301 & 0.448365 \tabularnewline
11 & 0.112188 & 1.2543 & 0.106037 \tabularnewline
12 & 0.205322 & 2.2956 & 0.011683 \tabularnewline
13 & 0.138039 & 1.5433 & 0.06264 \tabularnewline
14 & 0.024006 & 0.2684 & 0.394417 \tabularnewline
15 & 0.080191 & 0.8966 & 0.185838 \tabularnewline
16 & -0.001014 & -0.0113 & 0.495488 \tabularnewline
17 & -0.072938 & -0.8155 & 0.208175 \tabularnewline
18 & 0.033188 & 0.371 & 0.355615 \tabularnewline
19 & -0.036853 & -0.412 & 0.340513 \tabularnewline
20 & -0.098119 & -1.097 & 0.137373 \tabularnewline
21 & -0.112112 & -1.2535 & 0.106191 \tabularnewline
22 & -0.119848 & -1.3399 & 0.091347 \tabularnewline
23 & 0.050374 & 0.5632 & 0.287153 \tabularnewline
24 & 0.032683 & 0.3654 & 0.357714 \tabularnewline
25 & 0.059255 & 0.6625 & 0.254439 \tabularnewline
26 & 0.015901 & 0.1778 & 0.429591 \tabularnewline
27 & 0.013367 & 0.1494 & 0.440722 \tabularnewline
28 & -0.021762 & -0.2433 & 0.404084 \tabularnewline
29 & -0.063352 & -0.7083 & 0.240038 \tabularnewline
30 & -0.037511 & -0.4194 & 0.337827 \tabularnewline
31 & -0.01662 & -0.1858 & 0.426445 \tabularnewline
32 & -0.10165 & -1.1365 & 0.128964 \tabularnewline
33 & -0.043719 & -0.4888 & 0.312923 \tabularnewline
34 & -0.083217 & -0.9304 & 0.176981 \tabularnewline
35 & -0.077973 & -0.8718 & 0.192503 \tabularnewline
36 & 0.097183 & 1.0865 & 0.139666 \tabularnewline
37 & 0.031482 & 0.352 & 0.362723 \tabularnewline
38 & 0.037361 & 0.4177 & 0.338438 \tabularnewline
39 & 0.058041 & 0.6489 & 0.258792 \tabularnewline
40 & -0.079813 & -0.8923 & 0.186963 \tabularnewline
41 & -0.042144 & -0.4712 & 0.319163 \tabularnewline
42 & -0.013319 & -0.1489 & 0.440932 \tabularnewline
43 & -0.028142 & -0.3146 & 0.376783 \tabularnewline
44 & -0.140694 & -1.573 & 0.059123 \tabularnewline
45 & -0.172658 & -1.9304 & 0.027913 \tabularnewline
46 & -0.169796 & -1.8984 & 0.029976 \tabularnewline
47 & -0.107439 & -1.2012 & 0.11597 \tabularnewline
48 & 0.036062 & 0.4032 & 0.343752 \tabularnewline
\hline
\end{tabular}
%Source: https://freestatistics.org/blog/index.php?pk=300040&T=1

[TABLE]
[ROW][C]Autocorrelation Function[/C][/ROW]
[ROW][C]Time lag k[/C][C]ACF(k)[/C][C]T-STAT[/C][C]P-value[/C][/ROW]
[ROW][C]1[/C][C]0.279359[/C][C]3.1233[/C][C]0.001111[/C][/ROW]
[ROW][C]2[/C][C]0.135145[/C][C]1.511[/C][C]0.066661[/C][/ROW]
[ROW][C]3[/C][C]0.246136[/C][C]2.7519[/C][C]0.003404[/C][/ROW]
[ROW][C]4[/C][C]0.158907[/C][C]1.7766[/C][C]0.03903[/C][/ROW]
[ROW][C]5[/C][C]0.030839[/C][C]0.3448[/C][C]0.365415[/C][/ROW]
[ROW][C]6[/C][C]0.02635[/C][C]0.2946[/C][C]0.384392[/C][/ROW]
[ROW][C]7[/C][C]0.068742[/C][C]0.7686[/C][C]0.221804[/C][/ROW]
[ROW][C]8[/C][C]-0.002114[/C][C]-0.0236[/C][C]0.49059[/C][/ROW]
[ROW][C]9[/C][C]-0.031845[/C][C]-0.356[/C][C]0.361206[/C][/ROW]
[ROW][C]10[/C][C]0.011633[/C][C]0.1301[/C][C]0.448365[/C][/ROW]
[ROW][C]11[/C][C]0.112188[/C][C]1.2543[/C][C]0.106037[/C][/ROW]
[ROW][C]12[/C][C]0.205322[/C][C]2.2956[/C][C]0.011683[/C][/ROW]
[ROW][C]13[/C][C]0.138039[/C][C]1.5433[/C][C]0.06264[/C][/ROW]
[ROW][C]14[/C][C]0.024006[/C][C]0.2684[/C][C]0.394417[/C][/ROW]
[ROW][C]15[/C][C]0.080191[/C][C]0.8966[/C][C]0.185838[/C][/ROW]
[ROW][C]16[/C][C]-0.001014[/C][C]-0.0113[/C][C]0.495488[/C][/ROW]
[ROW][C]17[/C][C]-0.072938[/C][C]-0.8155[/C][C]0.208175[/C][/ROW]
[ROW][C]18[/C][C]0.033188[/C][C]0.371[/C][C]0.355615[/C][/ROW]
[ROW][C]19[/C][C]-0.036853[/C][C]-0.412[/C][C]0.340513[/C][/ROW]
[ROW][C]20[/C][C]-0.098119[/C][C]-1.097[/C][C]0.137373[/C][/ROW]
[ROW][C]21[/C][C]-0.112112[/C][C]-1.2535[/C][C]0.106191[/C][/ROW]
[ROW][C]22[/C][C]-0.119848[/C][C]-1.3399[/C][C]0.091347[/C][/ROW]
[ROW][C]23[/C][C]0.050374[/C][C]0.5632[/C][C]0.287153[/C][/ROW]
[ROW][C]24[/C][C]0.032683[/C][C]0.3654[/C][C]0.357714[/C][/ROW]
[ROW][C]25[/C][C]0.059255[/C][C]0.6625[/C][C]0.254439[/C][/ROW]
[ROW][C]26[/C][C]0.015901[/C][C]0.1778[/C][C]0.429591[/C][/ROW]
[ROW][C]27[/C][C]0.013367[/C][C]0.1494[/C][C]0.440722[/C][/ROW]
[ROW][C]28[/C][C]-0.021762[/C][C]-0.2433[/C][C]0.404084[/C][/ROW]
[ROW][C]29[/C][C]-0.063352[/C][C]-0.7083[/C][C]0.240038[/C][/ROW]
[ROW][C]30[/C][C]-0.037511[/C][C]-0.4194[/C][C]0.337827[/C][/ROW]
[ROW][C]31[/C][C]-0.01662[/C][C]-0.1858[/C][C]0.426445[/C][/ROW]
[ROW][C]32[/C][C]-0.10165[/C][C]-1.1365[/C][C]0.128964[/C][/ROW]
[ROW][C]33[/C][C]-0.043719[/C][C]-0.4888[/C][C]0.312923[/C][/ROW]
[ROW][C]34[/C][C]-0.083217[/C][C]-0.9304[/C][C]0.176981[/C][/ROW]
[ROW][C]35[/C][C]-0.077973[/C][C]-0.8718[/C][C]0.192503[/C][/ROW]
[ROW][C]36[/C][C]0.097183[/C][C]1.0865[/C][C]0.139666[/C][/ROW]
[ROW][C]37[/C][C]0.031482[/C][C]0.352[/C][C]0.362723[/C][/ROW]
[ROW][C]38[/C][C]0.037361[/C][C]0.4177[/C][C]0.338438[/C][/ROW]
[ROW][C]39[/C][C]0.058041[/C][C]0.6489[/C][C]0.258792[/C][/ROW]
[ROW][C]40[/C][C]-0.079813[/C][C]-0.8923[/C][C]0.186963[/C][/ROW]
[ROW][C]41[/C][C]-0.042144[/C][C]-0.4712[/C][C]0.319163[/C][/ROW]
[ROW][C]42[/C][C]-0.013319[/C][C]-0.1489[/C][C]0.440932[/C][/ROW]
[ROW][C]43[/C][C]-0.028142[/C][C]-0.3146[/C][C]0.376783[/C][/ROW]
[ROW][C]44[/C][C]-0.140694[/C][C]-1.573[/C][C]0.059123[/C][/ROW]
[ROW][C]45[/C][C]-0.172658[/C][C]-1.9304[/C][C]0.027913[/C][/ROW]
[ROW][C]46[/C][C]-0.169796[/C][C]-1.8984[/C][C]0.029976[/C][/ROW]
[ROW][C]47[/C][C]-0.107439[/C][C]-1.2012[/C][C]0.11597[/C][/ROW]
[ROW][C]48[/C][C]0.036062[/C][C]0.4032[/C][C]0.343752[/C][/ROW]
[/TABLE]
Source: https://freestatistics.org/blog/index.php?pk=300040&T=1

Globally Unique Identifier (entire table): ba.freestatistics.org/blog/index.php?pk=300040&T=1

As an alternative you can also use a QR Code:  

The GUIDs for individual cells are displayed in the table below:

Autocorrelation Function
Time lag kACF(k)T-STATP-value
10.2793593.12330.001111
20.1351451.5110.066661
30.2461362.75190.003404
40.1589071.77660.03903
50.0308390.34480.365415
60.026350.29460.384392
70.0687420.76860.221804
8-0.002114-0.02360.49059
9-0.031845-0.3560.361206
100.0116330.13010.448365
110.1121881.25430.106037
120.2053222.29560.011683
130.1380391.54330.06264
140.0240060.26840.394417
150.0801910.89660.185838
16-0.001014-0.01130.495488
17-0.072938-0.81550.208175
180.0331880.3710.355615
19-0.036853-0.4120.340513
20-0.098119-1.0970.137373
21-0.112112-1.25350.106191
22-0.119848-1.33990.091347
230.0503740.56320.287153
240.0326830.36540.357714
250.0592550.66250.254439
260.0159010.17780.429591
270.0133670.14940.440722
28-0.021762-0.24330.404084
29-0.063352-0.70830.240038
30-0.037511-0.41940.337827
31-0.01662-0.18580.426445
32-0.10165-1.13650.128964
33-0.043719-0.48880.312923
34-0.083217-0.93040.176981
35-0.077973-0.87180.192503
360.0971831.08650.139666
370.0314820.3520.362723
380.0373610.41770.338438
390.0580410.64890.258792
40-0.079813-0.89230.186963
41-0.042144-0.47120.319163
42-0.013319-0.14890.440932
43-0.028142-0.31460.376783
44-0.140694-1.5730.059123
45-0.172658-1.93040.027913
46-0.169796-1.89840.029976
47-0.107439-1.20120.11597
480.0360620.40320.343752


Partial Autocorrelation Function
Time lag kPACF(k)T-STATP-value
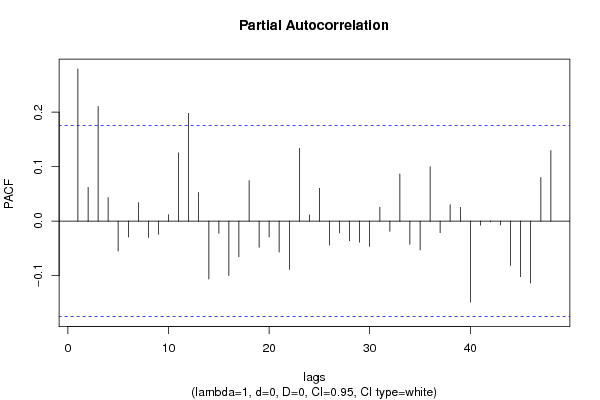
10.2793593.12330.001111
20.0619370.69250.244961
30.2105982.35460.010051
40.043150.48240.315173
5-0.054722-0.61180.270887
6-0.029175-0.32620.372414
70.0340130.38030.352191
8-0.029875-0.3340.369467
9-0.024197-0.27050.393601
100.0117740.13160.447743
110.1253961.4020.081701
120.1978612.21220.014386
130.0524440.58630.279352
14-0.106323-1.18870.118401
15-0.022348-0.24990.401552
16-0.09967-1.11430.133636
17-0.065491-0.73220.232705
180.074410.83190.203516
19-0.047956-0.53620.296401
20-0.02893-0.32350.373447
21-0.056582-0.63260.264071
22-0.088887-0.99380.161123
230.1335561.49320.068952
240.011460.12810.449126
250.0602120.67320.251033
26-0.043869-0.49050.31233
27-0.021572-0.24120.404907
28-0.036135-0.4040.343449
29-0.038596-0.43150.33342
30-0.045952-0.51380.304164
310.0256220.28650.387501
32-0.018576-0.20770.417905
330.0866590.96890.167239
34-0.042403-0.47410.318136
35-0.052812-0.59050.277975
360.0999011.11690.133085
37-0.021077-0.23560.407047
380.0302350.3380.367949
390.0253640.28360.388602
40-0.148289-1.65790.049921
41-0.0073-0.08160.467543
42-0.00125-0.0140.494437
43-0.007046-0.07880.468669
44-0.081454-0.91070.182108
45-0.101831-1.13850.128543
46-0.113484-1.26880.103438
470.0800370.89480.186295
480.1294571.44740.075148

\begin{tabular}{lllllllll}
\hline
Partial Autocorrelation Function \tabularnewline
Time lag k & PACF(k) & T-STAT & P-value \tabularnewline
1 & 0.279359 & 3.1233 & 0.001111 \tabularnewline
2 & 0.061937 & 0.6925 & 0.244961 \tabularnewline
3 & 0.210598 & 2.3546 & 0.010051 \tabularnewline
4 & 0.04315 & 0.4824 & 0.315173 \tabularnewline
5 & -0.054722 & -0.6118 & 0.270887 \tabularnewline
6 & -0.029175 & -0.3262 & 0.372414 \tabularnewline
7 & 0.034013 & 0.3803 & 0.352191 \tabularnewline
8 & -0.029875 & -0.334 & 0.369467 \tabularnewline
9 & -0.024197 & -0.2705 & 0.393601 \tabularnewline
10 & 0.011774 & 0.1316 & 0.447743 \tabularnewline
11 & 0.125396 & 1.402 & 0.081701 \tabularnewline
12 & 0.197861 & 2.2122 & 0.014386 \tabularnewline
13 & 0.052444 & 0.5863 & 0.279352 \tabularnewline
14 & -0.106323 & -1.1887 & 0.118401 \tabularnewline
15 & -0.022348 & -0.2499 & 0.401552 \tabularnewline
16 & -0.09967 & -1.1143 & 0.133636 \tabularnewline
17 & -0.065491 & -0.7322 & 0.232705 \tabularnewline
18 & 0.07441 & 0.8319 & 0.203516 \tabularnewline
19 & -0.047956 & -0.5362 & 0.296401 \tabularnewline
20 & -0.02893 & -0.3235 & 0.373447 \tabularnewline
21 & -0.056582 & -0.6326 & 0.264071 \tabularnewline
22 & -0.088887 & -0.9938 & 0.161123 \tabularnewline
23 & 0.133556 & 1.4932 & 0.068952 \tabularnewline
24 & 0.01146 & 0.1281 & 0.449126 \tabularnewline
25 & 0.060212 & 0.6732 & 0.251033 \tabularnewline
26 & -0.043869 & -0.4905 & 0.31233 \tabularnewline
27 & -0.021572 & -0.2412 & 0.404907 \tabularnewline
28 & -0.036135 & -0.404 & 0.343449 \tabularnewline
29 & -0.038596 & -0.4315 & 0.33342 \tabularnewline
30 & -0.045952 & -0.5138 & 0.304164 \tabularnewline
31 & 0.025622 & 0.2865 & 0.387501 \tabularnewline
32 & -0.018576 & -0.2077 & 0.417905 \tabularnewline
33 & 0.086659 & 0.9689 & 0.167239 \tabularnewline
34 & -0.042403 & -0.4741 & 0.318136 \tabularnewline
35 & -0.052812 & -0.5905 & 0.277975 \tabularnewline
36 & 0.099901 & 1.1169 & 0.133085 \tabularnewline
37 & -0.021077 & -0.2356 & 0.407047 \tabularnewline
38 & 0.030235 & 0.338 & 0.367949 \tabularnewline
39 & 0.025364 & 0.2836 & 0.388602 \tabularnewline
40 & -0.148289 & -1.6579 & 0.049921 \tabularnewline
41 & -0.0073 & -0.0816 & 0.467543 \tabularnewline
42 & -0.00125 & -0.014 & 0.494437 \tabularnewline
43 & -0.007046 & -0.0788 & 0.468669 \tabularnewline
44 & -0.081454 & -0.9107 & 0.182108 \tabularnewline
45 & -0.101831 & -1.1385 & 0.128543 \tabularnewline
46 & -0.113484 & -1.2688 & 0.103438 \tabularnewline
47 & 0.080037 & 0.8948 & 0.186295 \tabularnewline
48 & 0.129457 & 1.4474 & 0.075148 \tabularnewline
\hline
\end{tabular}
%Source: https://freestatistics.org/blog/index.php?pk=300040&T=2

[TABLE]
[ROW][C]Partial Autocorrelation Function[/C][/ROW]
[ROW][C]Time lag k[/C][C]PACF(k)[/C][C]T-STAT[/C][C]P-value[/C][/ROW]
[ROW][C]1[/C][C]0.279359[/C][C]3.1233[/C][C]0.001111[/C][/ROW]
[ROW][C]2[/C][C]0.061937[/C][C]0.6925[/C][C]0.244961[/C][/ROW]
[ROW][C]3[/C][C]0.210598[/C][C]2.3546[/C][C]0.010051[/C][/ROW]
[ROW][C]4[/C][C]0.04315[/C][C]0.4824[/C][C]0.315173[/C][/ROW]
[ROW][C]5[/C][C]-0.054722[/C][C]-0.6118[/C][C]0.270887[/C][/ROW]
[ROW][C]6[/C][C]-0.029175[/C][C]-0.3262[/C][C]0.372414[/C][/ROW]
[ROW][C]7[/C][C]0.034013[/C][C]0.3803[/C][C]0.352191[/C][/ROW]
[ROW][C]8[/C][C]-0.029875[/C][C]-0.334[/C][C]0.369467[/C][/ROW]
[ROW][C]9[/C][C]-0.024197[/C][C]-0.2705[/C][C]0.393601[/C][/ROW]
[ROW][C]10[/C][C]0.011774[/C][C]0.1316[/C][C]0.447743[/C][/ROW]
[ROW][C]11[/C][C]0.125396[/C][C]1.402[/C][C]0.081701[/C][/ROW]
[ROW][C]12[/C][C]0.197861[/C][C]2.2122[/C][C]0.014386[/C][/ROW]
[ROW][C]13[/C][C]0.052444[/C][C]0.5863[/C][C]0.279352[/C][/ROW]
[ROW][C]14[/C][C]-0.106323[/C][C]-1.1887[/C][C]0.118401[/C][/ROW]
[ROW][C]15[/C][C]-0.022348[/C][C]-0.2499[/C][C]0.401552[/C][/ROW]
[ROW][C]16[/C][C]-0.09967[/C][C]-1.1143[/C][C]0.133636[/C][/ROW]
[ROW][C]17[/C][C]-0.065491[/C][C]-0.7322[/C][C]0.232705[/C][/ROW]
[ROW][C]18[/C][C]0.07441[/C][C]0.8319[/C][C]0.203516[/C][/ROW]
[ROW][C]19[/C][C]-0.047956[/C][C]-0.5362[/C][C]0.296401[/C][/ROW]
[ROW][C]20[/C][C]-0.02893[/C][C]-0.3235[/C][C]0.373447[/C][/ROW]
[ROW][C]21[/C][C]-0.056582[/C][C]-0.6326[/C][C]0.264071[/C][/ROW]
[ROW][C]22[/C][C]-0.088887[/C][C]-0.9938[/C][C]0.161123[/C][/ROW]
[ROW][C]23[/C][C]0.133556[/C][C]1.4932[/C][C]0.068952[/C][/ROW]
[ROW][C]24[/C][C]0.01146[/C][C]0.1281[/C][C]0.449126[/C][/ROW]
[ROW][C]25[/C][C]0.060212[/C][C]0.6732[/C][C]0.251033[/C][/ROW]
[ROW][C]26[/C][C]-0.043869[/C][C]-0.4905[/C][C]0.31233[/C][/ROW]
[ROW][C]27[/C][C]-0.021572[/C][C]-0.2412[/C][C]0.404907[/C][/ROW]
[ROW][C]28[/C][C]-0.036135[/C][C]-0.404[/C][C]0.343449[/C][/ROW]
[ROW][C]29[/C][C]-0.038596[/C][C]-0.4315[/C][C]0.33342[/C][/ROW]
[ROW][C]30[/C][C]-0.045952[/C][C]-0.5138[/C][C]0.304164[/C][/ROW]
[ROW][C]31[/C][C]0.025622[/C][C]0.2865[/C][C]0.387501[/C][/ROW]
[ROW][C]32[/C][C]-0.018576[/C][C]-0.2077[/C][C]0.417905[/C][/ROW]
[ROW][C]33[/C][C]0.086659[/C][C]0.9689[/C][C]0.167239[/C][/ROW]
[ROW][C]34[/C][C]-0.042403[/C][C]-0.4741[/C][C]0.318136[/C][/ROW]
[ROW][C]35[/C][C]-0.052812[/C][C]-0.5905[/C][C]0.277975[/C][/ROW]
[ROW][C]36[/C][C]0.099901[/C][C]1.1169[/C][C]0.133085[/C][/ROW]
[ROW][C]37[/C][C]-0.021077[/C][C]-0.2356[/C][C]0.407047[/C][/ROW]
[ROW][C]38[/C][C]0.030235[/C][C]0.338[/C][C]0.367949[/C][/ROW]
[ROW][C]39[/C][C]0.025364[/C][C]0.2836[/C][C]0.388602[/C][/ROW]
[ROW][C]40[/C][C]-0.148289[/C][C]-1.6579[/C][C]0.049921[/C][/ROW]
[ROW][C]41[/C][C]-0.0073[/C][C]-0.0816[/C][C]0.467543[/C][/ROW]
[ROW][C]42[/C][C]-0.00125[/C][C]-0.014[/C][C]0.494437[/C][/ROW]
[ROW][C]43[/C][C]-0.007046[/C][C]-0.0788[/C][C]0.468669[/C][/ROW]
[ROW][C]44[/C][C]-0.081454[/C][C]-0.9107[/C][C]0.182108[/C][/ROW]
[ROW][C]45[/C][C]-0.101831[/C][C]-1.1385[/C][C]0.128543[/C][/ROW]
[ROW][C]46[/C][C]-0.113484[/C][C]-1.2688[/C][C]0.103438[/C][/ROW]
[ROW][C]47[/C][C]0.080037[/C][C]0.8948[/C][C]0.186295[/C][/ROW]
[ROW][C]48[/C][C]0.129457[/C][C]1.4474[/C][C]0.075148[/C][/ROW]
[/TABLE]
Source: https://freestatistics.org/blog/index.php?pk=300040&T=2

Globally Unique Identifier (entire table): ba.freestatistics.org/blog/index.php?pk=300040&T=2

As an alternative you can also use a QR Code:  

The GUIDs for individual cells are displayed in the table below:

Partial Autocorrelation Function
Time lag kPACF(k)T-STATP-value
10.2793593.12330.001111
20.0619370.69250.244961
30.2105982.35460.010051
40.043150.48240.315173
5-0.054722-0.61180.270887
6-0.029175-0.32620.372414
70.0340130.38030.352191
8-0.029875-0.3340.369467
9-0.024197-0.27050.393601
100.0117740.13160.447743
110.1253961.4020.081701
120.1978612.21220.014386
130.0524440.58630.279352
14-0.106323-1.18870.118401
15-0.022348-0.24990.401552
16-0.09967-1.11430.133636
17-0.065491-0.73220.232705
180.074410.83190.203516
19-0.047956-0.53620.296401
20-0.02893-0.32350.373447
21-0.056582-0.63260.264071
22-0.088887-0.99380.161123
230.1335561.49320.068952
240.011460.12810.449126
250.0602120.67320.251033
26-0.043869-0.49050.31233
27-0.021572-0.24120.404907
28-0.036135-0.4040.343449
29-0.038596-0.43150.33342
30-0.045952-0.51380.304164
310.0256220.28650.387501
32-0.018576-0.20770.417905
330.0866590.96890.167239
34-0.042403-0.47410.318136
35-0.052812-0.59050.277975
360.0999011.11690.133085
37-0.021077-0.23560.407047
380.0302350.3380.367949
390.0253640.28360.388602
40-0.148289-1.65790.049921
41-0.0073-0.08160.467543
42-0.00125-0.0140.494437
43-0.007046-0.07880.468669
44-0.081454-0.91070.182108
45-0.101831-1.13850.128543
46-0.113484-1.26880.103438
470.0800370.89480.186295
480.1294571.44740.075148


Parameters (Session):
par1 = 48 ; par2 = 1 ; par3 = 0 ; par4 = 0 ; par5 = 12 ; par6 = White Noise ; par7 = 0.95 ;
Parameters (R input):
par1 = 48 ; par2 = 1 ; par3 = 0 ; par4 = 0 ; par5 = 12 ; par6 = White Noise ; par7 = 0.95 ; par8 = ;
R code (references can be found in the software module):
if (par1 == 'Default') {
par1 = 10*log10(length(x))
} else {
par1 <- as.numeric(par1)
}
par2 <- as.numeric(par2)
par3 <- as.numeric(par3)
par4 <- as.numeric(par4)
par5 <- as.numeric(par5)
if (par6 == 'White Noise') par6 <- 'white' else par6 <- 'ma'
par7 <- as.numeric(par7)
if (par8 != '') par8 <- as.numeric(par8)
x <- na.omit(x)
ox <- x
if (par8 == '') {
if (par2 == 0) {
x <- log(x)
} else {
x <- (x ^ par2 - 1) / par2
}
} else {
x <- log(x,base=par8)
}
if (par3 > 0) x <- diff(x,lag=1,difference=par3)
if (par4 > 0) x <- diff(x,lag=par5,difference=par4)
bitmap(file='picts.png')
op <- par(mfrow=c(2,1))
plot(ox,type='l',main='Original Time Series',xlab='time',ylab='value')
if (par8=='') {
mytitle <- paste('Working Time Series (lambda=',par2,', d=',par3,', D=',par4,')',sep='')
mysub <- paste('(lambda=',par2,', d=',par3,', D=',par4,', CI=', par7, ', CI type=',par6,')',sep='')
} else {
mytitle <- paste('Working Time Series (base=',par8,', d=',par3,', D=',par4,')',sep='')
mysub <- paste('(base=',par8,', d=',par3,', D=',par4,', CI=', par7, ', CI type=',par6,')',sep='')
}
plot(x,type='l', main=mytitle,xlab='time',ylab='value')
par(op)
dev.off()
bitmap(file='pic1.png')
racf <- acf(x, par1, main='Autocorrelation', xlab='time lag', ylab='ACF', ci.type=par6, ci=par7, sub=mysub)
dev.off()
bitmap(file='pic2.png')
rpacf <- pacf(x,par1,main='Partial Autocorrelation',xlab='lags',ylab='PACF',sub=mysub)
dev.off()
(myacf <- c(racf$acf))
(mypacf <- c(rpacf$acf))
lengthx <- length(x)
sqrtn <- sqrt(lengthx)
load(file='createtable')
a<-table.start()
a<-table.row.start(a)
a<-table.element(a,'Autocorrelation Function',4,TRUE)
a<-table.row.end(a)
a<-table.row.start(a)
a<-table.element(a,'Time lag k',header=TRUE)
a<-table.element(a,'ACF(k)',header=TRUE)
a<-table.element(a,'T-STAT',header=TRUE)
a<-table.element(a,'P-value',header=TRUE)
a<-table.row.end(a)
for (i in 2:(par1+1)) {
a<-table.row.start(a)
a<-table.element(a,i-1,header=TRUE)
a<-table.element(a,round(myacf[i],6))
mytstat <- myacf[i]*sqrtn
a<-table.element(a,round(mytstat,4))
a<-table.element(a,round(1-pt(abs(mytstat),lengthx),6))
a<-table.row.end(a)
}
a<-table.end(a)
table.save(a,file='mytable.tab')
a<-table.start()
a<-table.row.start(a)
a<-table.element(a,'Partial Autocorrelation Function',4,TRUE)
a<-table.row.end(a)
a<-table.row.start(a)
a<-table.element(a,'Time lag k',header=TRUE)
a<-table.element(a,'PACF(k)',header=TRUE)
a<-table.element(a,'T-STAT',header=TRUE)
a<-table.element(a,'P-value',header=TRUE)
a<-table.row.end(a)
for (i in 1:par1) {
a<-table.row.start(a)
a<-table.element(a,i,header=TRUE)
a<-table.element(a,round(mypacf[i],6))
mytstat <- mypacf[i]*sqrtn
a<-table.element(a,round(mytstat,4))
a<-table.element(a,round(1-pt(abs(mytstat),lengthx),6))
a<-table.row.end(a)
}
a<-table.end(a)
table.save(a,file='mytable1.tab')