Free Statistics

of Irreproducible Research!

Author's title

Author*The author of this computation has been verified*
R Software Modulerwasp_arimabackwardselection.wasp
Title produced by softwareARIMA Backward Selection
Date of computationThu, 15 Dec 2016 21:43:02 +0100
Cite this page as followsStatistical Computations at FreeStatistics.org, Office for Research Development and Education, URL https://freestatistics.org/blog/index.php?v=date/2016/Dec/15/t1481834605r3v1sghcclj20wo.htm/, Retrieved Fri, 01 Nov 2024 03:34:17 +0000
Statistical Computations at FreeStatistics.org, Office for Research Development and Education, URL https://freestatistics.org/blog/index.php?pk=300007, Retrieved Fri, 01 Nov 2024 03:34:17 +0000
QR Codes:

Original text written by user:
IsPrivate?No (this computation is public)
User-defined keywords
Estimated Impact93
Family? (F = Feedback message, R = changed R code, M = changed R Module, P = changed Parameters, D = changed Data)
-       [ARIMA Backward Selection] [ARIMA Backward Se...] [2016-12-15 20:43:02] [6fe662842930c5949e61d44eeb8a265b] [Current]
Feedback Forum

Post a new message
Dataseries X:
4419
4336
4214
4294
4650
4608
4650
4625
4739
5010
4808
4474
4527
4652
4677
4904
4851
4956
4819
4940
5217
5305
5265
5256
5671
5617
5811
5728
5629
5490
5605
4944
5555
5956
5872
5795
6033
6337
6396
6244
6200
6082
5866
5917
6134
6428
6187
6228
6269
6586
6223
6724
6294
6445
6163
6207
6816
6850
6439
6401
6913
6969
7064
6987
6882
6683
6530
6748
6773
7375
7208
6676
7167
7146
7193
7162
7145
6819
6702
6702
6782
7307
6818
6966
7012
7754
7462
7183
7165
7299
7103
6950
7506
7708
7693
7495
7955
8316
9230
8654
8307
7940
7509
7752
8310
8616
8358
8150
8664
8817
8927
8537
8497
8270
7658
8049
8365
8971
8854
8540
8878
9184


Summary of computational transaction
Raw Input view raw input (R code)
Raw Outputview raw output of R engine
Computing time6 seconds
R ServerBig Analytics Cloud Computing Center

\begin{tabular}{lllllllll}
\hline
Summary of computational transaction \tabularnewline
Raw Input view raw input (R code)  \tabularnewline
Raw Outputview raw output of R engine  \tabularnewline
Computing time6 seconds \tabularnewline
R ServerBig Analytics Cloud Computing Center \tabularnewline
\hline
\end{tabular}
%Source: https://freestatistics.org/blog/index.php?pk=300007&T=0

[TABLE]
[ROW]
Summary of computational transaction[/C][/ROW] [ROW]Raw Input[/C] view raw input (R code) [/C][/ROW] [ROW]Raw Output[/C]view raw output of R engine [/C][/ROW] [ROW]Computing time[/C]6 seconds[/C][/ROW] [ROW]R Server[/C]Big Analytics Cloud Computing Center[/C][/ROW] [/TABLE] Source: https://freestatistics.org/blog/index.php?pk=300007&T=0

Globally Unique Identifier (entire table): ba.freestatistics.org/blog/index.php?pk=300007&T=0

As an alternative you can also use a QR Code:  

The GUIDs for individual cells are displayed in the table below:

Summary of computational transaction
Raw Input view raw input (R code)
Raw Outputview raw output of R engine
Computing time6 seconds
R ServerBig Analytics Cloud Computing Center


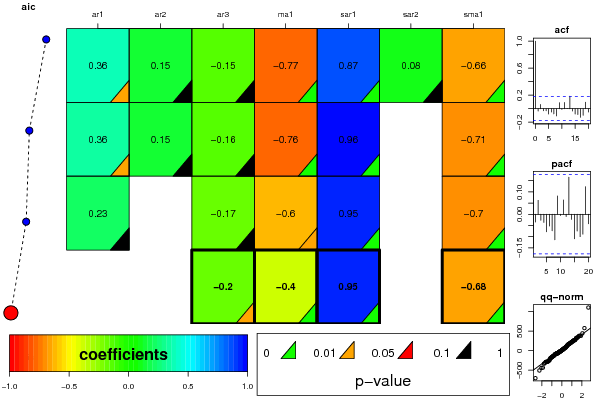
ARIMA Parameter Estimation and Backward Selection
Iterationar1ar2ar3ma1sar1sar2sma1
Estimates ( 1 )0.36020.1517-0.154-0.76590.87270.0801-0.6571
(p-val)(0.0204 )(0.1775 )(0.1231 )(0 )(0 )(0.5373 )(0 )
Estimates ( 2 )0.35510.1494-0.1556-0.76340.96120-0.7084
(p-val)(0.0259 )(0.1886 )(0.1217 )(0 )(0 )(NA )(0 )
Estimates ( 3 )0.23050-0.1693-0.60360.95430-0.7016
(p-val)(0.423 )(NA )(0.1172 )(0.0193 )(0 )(NA )(0 )
Estimates ( 4 )00-0.1982-0.39660.94960-0.6781
(p-val)(NA )(NA )(0.0282 )(0 )(0 )(NA )(0 )
Estimates ( 5 )NANANANANANANA
(p-val)(NA )(NA )(NA )(NA )(NA )(NA )(NA )
Estimates ( 6 )NANANANANANANA
(p-val)(NA )(NA )(NA )(NA )(NA )(NA )(NA )
Estimates ( 7 )NANANANANANANA
(p-val)(NA )(NA )(NA )(NA )(NA )(NA )(NA )
Estimates ( 8 )NANANANANANANA
(p-val)(NA )(NA )(NA )(NA )(NA )(NA )(NA )
Estimates ( 9 )NANANANANANANA
(p-val)(NA )(NA )(NA )(NA )(NA )(NA )(NA )
Estimates ( 10 )NANANANANANANA
(p-val)(NA )(NA )(NA )(NA )(NA )(NA )(NA )
Estimates ( 11 )NANANANANANANA
(p-val)(NA )(NA )(NA )(NA )(NA )(NA )(NA )
Estimates ( 12 )NANANANANANANA
(p-val)(NA )(NA )(NA )(NA )(NA )(NA )(NA )
Estimates ( 13 )NANANANANANANA
(p-val)(NA )(NA )(NA )(NA )(NA )(NA )(NA )

\begin{tabular}{lllllllll}
\hline
ARIMA Parameter Estimation and Backward Selection \tabularnewline
Iteration & ar1 & ar2 & ar3 & ma1 & sar1 & sar2 & sma1 \tabularnewline
Estimates ( 1 ) & 0.3602 & 0.1517 & -0.154 & -0.7659 & 0.8727 & 0.0801 & -0.6571 \tabularnewline
(p-val) & (0.0204 ) & (0.1775 ) & (0.1231 ) & (0 ) & (0 ) & (0.5373 ) & (0 ) \tabularnewline
Estimates ( 2 ) & 0.3551 & 0.1494 & -0.1556 & -0.7634 & 0.9612 & 0 & -0.7084 \tabularnewline
(p-val) & (0.0259 ) & (0.1886 ) & (0.1217 ) & (0 ) & (0 ) & (NA ) & (0 ) \tabularnewline
Estimates ( 3 ) & 0.2305 & 0 & -0.1693 & -0.6036 & 0.9543 & 0 & -0.7016 \tabularnewline
(p-val) & (0.423 ) & (NA ) & (0.1172 ) & (0.0193 ) & (0 ) & (NA ) & (0 ) \tabularnewline
Estimates ( 4 ) & 0 & 0 & -0.1982 & -0.3966 & 0.9496 & 0 & -0.6781 \tabularnewline
(p-val) & (NA ) & (NA ) & (0.0282 ) & (0 ) & (0 ) & (NA ) & (0 ) \tabularnewline
Estimates ( 5 ) & NA & NA & NA & NA & NA & NA & NA \tabularnewline
(p-val) & (NA ) & (NA ) & (NA ) & (NA ) & (NA ) & (NA ) & (NA ) \tabularnewline
Estimates ( 6 ) & NA & NA & NA & NA & NA & NA & NA \tabularnewline
(p-val) & (NA ) & (NA ) & (NA ) & (NA ) & (NA ) & (NA ) & (NA ) \tabularnewline
Estimates ( 7 ) & NA & NA & NA & NA & NA & NA & NA \tabularnewline
(p-val) & (NA ) & (NA ) & (NA ) & (NA ) & (NA ) & (NA ) & (NA ) \tabularnewline
Estimates ( 8 ) & NA & NA & NA & NA & NA & NA & NA \tabularnewline
(p-val) & (NA ) & (NA ) & (NA ) & (NA ) & (NA ) & (NA ) & (NA ) \tabularnewline
Estimates ( 9 ) & NA & NA & NA & NA & NA & NA & NA \tabularnewline
(p-val) & (NA ) & (NA ) & (NA ) & (NA ) & (NA ) & (NA ) & (NA ) \tabularnewline
Estimates ( 10 ) & NA & NA & NA & NA & NA & NA & NA \tabularnewline
(p-val) & (NA ) & (NA ) & (NA ) & (NA ) & (NA ) & (NA ) & (NA ) \tabularnewline
Estimates ( 11 ) & NA & NA & NA & NA & NA & NA & NA \tabularnewline
(p-val) & (NA ) & (NA ) & (NA ) & (NA ) & (NA ) & (NA ) & (NA ) \tabularnewline
Estimates ( 12 ) & NA & NA & NA & NA & NA & NA & NA \tabularnewline
(p-val) & (NA ) & (NA ) & (NA ) & (NA ) & (NA ) & (NA ) & (NA ) \tabularnewline
Estimates ( 13 ) & NA & NA & NA & NA & NA & NA & NA \tabularnewline
(p-val) & (NA ) & (NA ) & (NA ) & (NA ) & (NA ) & (NA ) & (NA ) \tabularnewline
\hline
\end{tabular}
%Source: https://freestatistics.org/blog/index.php?pk=300007&T=1

[TABLE]
[ROW][C]ARIMA Parameter Estimation and Backward Selection[/C][/ROW]
[ROW][C]Iteration[/C][C]ar1[/C][C]ar2[/C][C]ar3[/C][C]ma1[/C][C]sar1[/C][C]sar2[/C][C]sma1[/C][/ROW]
[ROW][C]Estimates ( 1 )[/C][C]0.3602[/C][C]0.1517[/C][C]-0.154[/C][C]-0.7659[/C][C]0.8727[/C][C]0.0801[/C][C]-0.6571[/C][/ROW]
[ROW][C](p-val)[/C][C](0.0204 )[/C][C](0.1775 )[/C][C](0.1231 )[/C][C](0 )[/C][C](0 )[/C][C](0.5373 )[/C][C](0 )[/C][/ROW]
[ROW][C]Estimates ( 2 )[/C][C]0.3551[/C][C]0.1494[/C][C]-0.1556[/C][C]-0.7634[/C][C]0.9612[/C][C]0[/C][C]-0.7084[/C][/ROW]
[ROW][C](p-val)[/C][C](0.0259 )[/C][C](0.1886 )[/C][C](0.1217 )[/C][C](0 )[/C][C](0 )[/C][C](NA )[/C][C](0 )[/C][/ROW]
[ROW][C]Estimates ( 3 )[/C][C]0.2305[/C][C]0[/C][C]-0.1693[/C][C]-0.6036[/C][C]0.9543[/C][C]0[/C][C]-0.7016[/C][/ROW]
[ROW][C](p-val)[/C][C](0.423 )[/C][C](NA )[/C][C](0.1172 )[/C][C](0.0193 )[/C][C](0 )[/C][C](NA )[/C][C](0 )[/C][/ROW]
[ROW][C]Estimates ( 4 )[/C][C]0[/C][C]0[/C][C]-0.1982[/C][C]-0.3966[/C][C]0.9496[/C][C]0[/C][C]-0.6781[/C][/ROW]
[ROW][C](p-val)[/C][C](NA )[/C][C](NA )[/C][C](0.0282 )[/C][C](0 )[/C][C](0 )[/C][C](NA )[/C][C](0 )[/C][/ROW]
[ROW][C]Estimates ( 5 )[/C][C]NA[/C][C]NA[/C][C]NA[/C][C]NA[/C][C]NA[/C][C]NA[/C][C]NA[/C][/ROW]
[ROW][C](p-val)[/C][C](NA )[/C][C](NA )[/C][C](NA )[/C][C](NA )[/C][C](NA )[/C][C](NA )[/C][C](NA )[/C][/ROW]
[ROW][C]Estimates ( 6 )[/C][C]NA[/C][C]NA[/C][C]NA[/C][C]NA[/C][C]NA[/C][C]NA[/C][C]NA[/C][/ROW]
[ROW][C](p-val)[/C][C](NA )[/C][C](NA )[/C][C](NA )[/C][C](NA )[/C][C](NA )[/C][C](NA )[/C][C](NA )[/C][/ROW]
[ROW][C]Estimates ( 7 )[/C][C]NA[/C][C]NA[/C][C]NA[/C][C]NA[/C][C]NA[/C][C]NA[/C][C]NA[/C][/ROW]
[ROW][C](p-val)[/C][C](NA )[/C][C](NA )[/C][C](NA )[/C][C](NA )[/C][C](NA )[/C][C](NA )[/C][C](NA )[/C][/ROW]
[ROW][C]Estimates ( 8 )[/C][C]NA[/C][C]NA[/C][C]NA[/C][C]NA[/C][C]NA[/C][C]NA[/C][C]NA[/C][/ROW]
[ROW][C](p-val)[/C][C](NA )[/C][C](NA )[/C][C](NA )[/C][C](NA )[/C][C](NA )[/C][C](NA )[/C][C](NA )[/C][/ROW]
[ROW][C]Estimates ( 9 )[/C][C]NA[/C][C]NA[/C][C]NA[/C][C]NA[/C][C]NA[/C][C]NA[/C][C]NA[/C][/ROW]
[ROW][C](p-val)[/C][C](NA )[/C][C](NA )[/C][C](NA )[/C][C](NA )[/C][C](NA )[/C][C](NA )[/C][C](NA )[/C][/ROW]
[ROW][C]Estimates ( 10 )[/C][C]NA[/C][C]NA[/C][C]NA[/C][C]NA[/C][C]NA[/C][C]NA[/C][C]NA[/C][/ROW]
[ROW][C](p-val)[/C][C](NA )[/C][C](NA )[/C][C](NA )[/C][C](NA )[/C][C](NA )[/C][C](NA )[/C][C](NA )[/C][/ROW]
[ROW][C]Estimates ( 11 )[/C][C]NA[/C][C]NA[/C][C]NA[/C][C]NA[/C][C]NA[/C][C]NA[/C][C]NA[/C][/ROW]
[ROW][C](p-val)[/C][C](NA )[/C][C](NA )[/C][C](NA )[/C][C](NA )[/C][C](NA )[/C][C](NA )[/C][C](NA )[/C][/ROW]
[ROW][C]Estimates ( 12 )[/C][C]NA[/C][C]NA[/C][C]NA[/C][C]NA[/C][C]NA[/C][C]NA[/C][C]NA[/C][/ROW]
[ROW][C](p-val)[/C][C](NA )[/C][C](NA )[/C][C](NA )[/C][C](NA )[/C][C](NA )[/C][C](NA )[/C][C](NA )[/C][/ROW]
[ROW][C]Estimates ( 13 )[/C][C]NA[/C][C]NA[/C][C]NA[/C][C]NA[/C][C]NA[/C][C]NA[/C][C]NA[/C][/ROW]
[ROW][C](p-val)[/C][C](NA )[/C][C](NA )[/C][C](NA )[/C][C](NA )[/C][C](NA )[/C][C](NA )[/C][C](NA )[/C][/ROW]
[/TABLE]
Source: https://freestatistics.org/blog/index.php?pk=300007&T=1

Globally Unique Identifier (entire table): ba.freestatistics.org/blog/index.php?pk=300007&T=1

As an alternative you can also use a QR Code:  

The GUIDs for individual cells are displayed in the table below:

ARIMA Parameter Estimation and Backward Selection
Iterationar1ar2ar3ma1sar1sar2sma1
Estimates ( 1 )0.36020.1517-0.154-0.76590.87270.0801-0.6571
(p-val)(0.0204 )(0.1775 )(0.1231 )(0 )(0 )(0.5373 )(0 )
Estimates ( 2 )0.35510.1494-0.1556-0.76340.96120-0.7084
(p-val)(0.0259 )(0.1886 )(0.1217 )(0 )(0 )(NA )(0 )
Estimates ( 3 )0.23050-0.1693-0.60360.95430-0.7016
(p-val)(0.423 )(NA )(0.1172 )(0.0193 )(0 )(NA )(0 )
Estimates ( 4 )00-0.1982-0.39660.94960-0.6781
(p-val)(NA )(NA )(0.0282 )(0 )(0 )(NA )(0 )
Estimates ( 5 )NANANANANANANA
(p-val)(NA )(NA )(NA )(NA )(NA )(NA )(NA )
Estimates ( 6 )NANANANANANANA
(p-val)(NA )(NA )(NA )(NA )(NA )(NA )(NA )
Estimates ( 7 )NANANANANANANA
(p-val)(NA )(NA )(NA )(NA )(NA )(NA )(NA )
Estimates ( 8 )NANANANANANANA
(p-val)(NA )(NA )(NA )(NA )(NA )(NA )(NA )
Estimates ( 9 )NANANANANANANA
(p-val)(NA )(NA )(NA )(NA )(NA )(NA )(NA )
Estimates ( 10 )NANANANANANANA
(p-val)(NA )(NA )(NA )(NA )(NA )(NA )(NA )
Estimates ( 11 )NANANANANANANA
(p-val)(NA )(NA )(NA )(NA )(NA )(NA )(NA )
Estimates ( 12 )NANANANANANANA
(p-val)(NA )(NA )(NA )(NA )(NA )(NA )(NA )
Estimates ( 13 )NANANANANANANA
(p-val)(NA )(NA )(NA )(NA )(NA )(NA )(NA )


Estimated ARIMA Residuals
Value
4.41899550516794
-58.1909003137286
-105.708978151927
25.2468487894438
257.827045036988
43.074249214001
76.3796108956994
66.5874497638869
125.996720904434
264.479118166407
-52.4355172275132
-242.989595119056
-6.36228415984459
117.103040224008
78.2941626602175
196.858406662539
-119.681049124155
110.372309787252
-77.1334070857326
73.2729324984381
232.323749410042
15.3724396250591
97.4549431799771
228.809817612519
442.417170998731
116.755777183075
324.166568016563
15.5071396900198
-144.724155813353
-166.518517304165
51.6919440039792
-703.435289974718
156.79844937887
284.940136136122
-13.5240536617206
95.4958072318222
161.924926077785
380.714239188345
181.567830530053
-78.7515837025042
-24.403840615891
-85.1633534091877
-285.763723834777
93.1140458366947
-70.4160923593977
24.7746189330153
-133.797912451454
75.7869161297912
-110.367878261714
170.867193509225
-332.06883704824
376.32083328263
-284.817629302945
59.5825269649867
-150.996300100496
37.7433032964738
379.914619742565
-73.5324210671862
-270.175897157126
-23.2558928746059
323.411196689418
-24.3924454367698
167.048027220461
-74.7302178990762
-9.59776508568891
-182.819754761077
-138.999162742396
205.383649081103
-280.796430902582
335.059064221992
169.306068256119
-440.117238321489
180.411447942308
-80.4472016457563
-31.6729216412336
-88.7622915806972
31.852015705178
-266.476992935071
-113.392998440147
-67.0390845454532
-241.732103334081
148.333622553685
-286.047780637243
188.971433943742
-155.63635353575
576.497920873411
-41.4156970683055
-316.709948516248
53.1077757606246
220.339295833974
-62.7215020740225
-170.574919533795
345.932436746528
-8.81887850607141
226.035546639541
27.6599432567895
271.162293544564
266.877880267615
1102.94431081589
-52.5586390318671
-177.66280933014
-192.185404455299
-435.340910707841
33.4608453950007
188.670406574609
27.0061680043658
-25.497576617551
-49.9685856159564
246.587860636101
-28.737997044266
-78.2339730301888
-202.78360183861
-2.84318559866829
-134.16236734006
-506.838310709913
156.304903961794
-19.8137181568524
256.945470772224
209.581688507325
-79.6075921122849
73.2548835712871
136.675355917748

\begin{tabular}{lllllllll}
\hline
Estimated ARIMA Residuals \tabularnewline
Value \tabularnewline
4.41899550516794 \tabularnewline
-58.1909003137286 \tabularnewline
-105.708978151927 \tabularnewline
25.2468487894438 \tabularnewline
257.827045036988 \tabularnewline
43.074249214001 \tabularnewline
76.3796108956994 \tabularnewline
66.5874497638869 \tabularnewline
125.996720904434 \tabularnewline
264.479118166407 \tabularnewline
-52.4355172275132 \tabularnewline
-242.989595119056 \tabularnewline
-6.36228415984459 \tabularnewline
117.103040224008 \tabularnewline
78.2941626602175 \tabularnewline
196.858406662539 \tabularnewline
-119.681049124155 \tabularnewline
110.372309787252 \tabularnewline
-77.1334070857326 \tabularnewline
73.2729324984381 \tabularnewline
232.323749410042 \tabularnewline
15.3724396250591 \tabularnewline
97.4549431799771 \tabularnewline
228.809817612519 \tabularnewline
442.417170998731 \tabularnewline
116.755777183075 \tabularnewline
324.166568016563 \tabularnewline
15.5071396900198 \tabularnewline
-144.724155813353 \tabularnewline
-166.518517304165 \tabularnewline
51.6919440039792 \tabularnewline
-703.435289974718 \tabularnewline
156.79844937887 \tabularnewline
284.940136136122 \tabularnewline
-13.5240536617206 \tabularnewline
95.4958072318222 \tabularnewline
161.924926077785 \tabularnewline
380.714239188345 \tabularnewline
181.567830530053 \tabularnewline
-78.7515837025042 \tabularnewline
-24.403840615891 \tabularnewline
-85.1633534091877 \tabularnewline
-285.763723834777 \tabularnewline
93.1140458366947 \tabularnewline
-70.4160923593977 \tabularnewline
24.7746189330153 \tabularnewline
-133.797912451454 \tabularnewline
75.7869161297912 \tabularnewline
-110.367878261714 \tabularnewline
170.867193509225 \tabularnewline
-332.06883704824 \tabularnewline
376.32083328263 \tabularnewline
-284.817629302945 \tabularnewline
59.5825269649867 \tabularnewline
-150.996300100496 \tabularnewline
37.7433032964738 \tabularnewline
379.914619742565 \tabularnewline
-73.5324210671862 \tabularnewline
-270.175897157126 \tabularnewline
-23.2558928746059 \tabularnewline
323.411196689418 \tabularnewline
-24.3924454367698 \tabularnewline
167.048027220461 \tabularnewline
-74.7302178990762 \tabularnewline
-9.59776508568891 \tabularnewline
-182.819754761077 \tabularnewline
-138.999162742396 \tabularnewline
205.383649081103 \tabularnewline
-280.796430902582 \tabularnewline
335.059064221992 \tabularnewline
169.306068256119 \tabularnewline
-440.117238321489 \tabularnewline
180.411447942308 \tabularnewline
-80.4472016457563 \tabularnewline
-31.6729216412336 \tabularnewline
-88.7622915806972 \tabularnewline
31.852015705178 \tabularnewline
-266.476992935071 \tabularnewline
-113.392998440147 \tabularnewline
-67.0390845454532 \tabularnewline
-241.732103334081 \tabularnewline
148.333622553685 \tabularnewline
-286.047780637243 \tabularnewline
188.971433943742 \tabularnewline
-155.63635353575 \tabularnewline
576.497920873411 \tabularnewline
-41.4156970683055 \tabularnewline
-316.709948516248 \tabularnewline
53.1077757606246 \tabularnewline
220.339295833974 \tabularnewline
-62.7215020740225 \tabularnewline
-170.574919533795 \tabularnewline
345.932436746528 \tabularnewline
-8.81887850607141 \tabularnewline
226.035546639541 \tabularnewline
27.6599432567895 \tabularnewline
271.162293544564 \tabularnewline
266.877880267615 \tabularnewline
1102.94431081589 \tabularnewline
-52.5586390318671 \tabularnewline
-177.66280933014 \tabularnewline
-192.185404455299 \tabularnewline
-435.340910707841 \tabularnewline
33.4608453950007 \tabularnewline
188.670406574609 \tabularnewline
27.0061680043658 \tabularnewline
-25.497576617551 \tabularnewline
-49.9685856159564 \tabularnewline
246.587860636101 \tabularnewline
-28.737997044266 \tabularnewline
-78.2339730301888 \tabularnewline
-202.78360183861 \tabularnewline
-2.84318559866829 \tabularnewline
-134.16236734006 \tabularnewline
-506.838310709913 \tabularnewline
156.304903961794 \tabularnewline
-19.8137181568524 \tabularnewline
256.945470772224 \tabularnewline
209.581688507325 \tabularnewline
-79.6075921122849 \tabularnewline
73.2548835712871 \tabularnewline
136.675355917748 \tabularnewline
\hline
\end{tabular}
%Source: https://freestatistics.org/blog/index.php?pk=300007&T=2

[TABLE]
[ROW][C]Estimated ARIMA Residuals[/C][/ROW]
[ROW][C]Value[/C][/ROW]
[ROW][C]4.41899550516794[/C][/ROW]
[ROW][C]-58.1909003137286[/C][/ROW]
[ROW][C]-105.708978151927[/C][/ROW]
[ROW][C]25.2468487894438[/C][/ROW]
[ROW][C]257.827045036988[/C][/ROW]
[ROW][C]43.074249214001[/C][/ROW]
[ROW][C]76.3796108956994[/C][/ROW]
[ROW][C]66.5874497638869[/C][/ROW]
[ROW][C]125.996720904434[/C][/ROW]
[ROW][C]264.479118166407[/C][/ROW]
[ROW][C]-52.4355172275132[/C][/ROW]
[ROW][C]-242.989595119056[/C][/ROW]
[ROW][C]-6.36228415984459[/C][/ROW]
[ROW][C]117.103040224008[/C][/ROW]
[ROW][C]78.2941626602175[/C][/ROW]
[ROW][C]196.858406662539[/C][/ROW]
[ROW][C]-119.681049124155[/C][/ROW]
[ROW][C]110.372309787252[/C][/ROW]
[ROW][C]-77.1334070857326[/C][/ROW]
[ROW][C]73.2729324984381[/C][/ROW]
[ROW][C]232.323749410042[/C][/ROW]
[ROW][C]15.3724396250591[/C][/ROW]
[ROW][C]97.4549431799771[/C][/ROW]
[ROW][C]228.809817612519[/C][/ROW]
[ROW][C]442.417170998731[/C][/ROW]
[ROW][C]116.755777183075[/C][/ROW]
[ROW][C]324.166568016563[/C][/ROW]
[ROW][C]15.5071396900198[/C][/ROW]
[ROW][C]-144.724155813353[/C][/ROW]
[ROW][C]-166.518517304165[/C][/ROW]
[ROW][C]51.6919440039792[/C][/ROW]
[ROW][C]-703.435289974718[/C][/ROW]
[ROW][C]156.79844937887[/C][/ROW]
[ROW][C]284.940136136122[/C][/ROW]
[ROW][C]-13.5240536617206[/C][/ROW]
[ROW][C]95.4958072318222[/C][/ROW]
[ROW][C]161.924926077785[/C][/ROW]
[ROW][C]380.714239188345[/C][/ROW]
[ROW][C]181.567830530053[/C][/ROW]
[ROW][C]-78.7515837025042[/C][/ROW]
[ROW][C]-24.403840615891[/C][/ROW]
[ROW][C]-85.1633534091877[/C][/ROW]
[ROW][C]-285.763723834777[/C][/ROW]
[ROW][C]93.1140458366947[/C][/ROW]
[ROW][C]-70.4160923593977[/C][/ROW]
[ROW][C]24.7746189330153[/C][/ROW]
[ROW][C]-133.797912451454[/C][/ROW]
[ROW][C]75.7869161297912[/C][/ROW]
[ROW][C]-110.367878261714[/C][/ROW]
[ROW][C]170.867193509225[/C][/ROW]
[ROW][C]-332.06883704824[/C][/ROW]
[ROW][C]376.32083328263[/C][/ROW]
[ROW][C]-284.817629302945[/C][/ROW]
[ROW][C]59.5825269649867[/C][/ROW]
[ROW][C]-150.996300100496[/C][/ROW]
[ROW][C]37.7433032964738[/C][/ROW]
[ROW][C]379.914619742565[/C][/ROW]
[ROW][C]-73.5324210671862[/C][/ROW]
[ROW][C]-270.175897157126[/C][/ROW]
[ROW][C]-23.2558928746059[/C][/ROW]
[ROW][C]323.411196689418[/C][/ROW]
[ROW][C]-24.3924454367698[/C][/ROW]
[ROW][C]167.048027220461[/C][/ROW]
[ROW][C]-74.7302178990762[/C][/ROW]
[ROW][C]-9.59776508568891[/C][/ROW]
[ROW][C]-182.819754761077[/C][/ROW]
[ROW][C]-138.999162742396[/C][/ROW]
[ROW][C]205.383649081103[/C][/ROW]
[ROW][C]-280.796430902582[/C][/ROW]
[ROW][C]335.059064221992[/C][/ROW]
[ROW][C]169.306068256119[/C][/ROW]
[ROW][C]-440.117238321489[/C][/ROW]
[ROW][C]180.411447942308[/C][/ROW]
[ROW][C]-80.4472016457563[/C][/ROW]
[ROW][C]-31.6729216412336[/C][/ROW]
[ROW][C]-88.7622915806972[/C][/ROW]
[ROW][C]31.852015705178[/C][/ROW]
[ROW][C]-266.476992935071[/C][/ROW]
[ROW][C]-113.392998440147[/C][/ROW]
[ROW][C]-67.0390845454532[/C][/ROW]
[ROW][C]-241.732103334081[/C][/ROW]
[ROW][C]148.333622553685[/C][/ROW]
[ROW][C]-286.047780637243[/C][/ROW]
[ROW][C]188.971433943742[/C][/ROW]
[ROW][C]-155.63635353575[/C][/ROW]
[ROW][C]576.497920873411[/C][/ROW]
[ROW][C]-41.4156970683055[/C][/ROW]
[ROW][C]-316.709948516248[/C][/ROW]
[ROW][C]53.1077757606246[/C][/ROW]
[ROW][C]220.339295833974[/C][/ROW]
[ROW][C]-62.7215020740225[/C][/ROW]
[ROW][C]-170.574919533795[/C][/ROW]
[ROW][C]345.932436746528[/C][/ROW]
[ROW][C]-8.81887850607141[/C][/ROW]
[ROW][C]226.035546639541[/C][/ROW]
[ROW][C]27.6599432567895[/C][/ROW]
[ROW][C]271.162293544564[/C][/ROW]
[ROW][C]266.877880267615[/C][/ROW]
[ROW][C]1102.94431081589[/C][/ROW]
[ROW][C]-52.5586390318671[/C][/ROW]
[ROW][C]-177.66280933014[/C][/ROW]
[ROW][C]-192.185404455299[/C][/ROW]
[ROW][C]-435.340910707841[/C][/ROW]
[ROW][C]33.4608453950007[/C][/ROW]
[ROW][C]188.670406574609[/C][/ROW]
[ROW][C]27.0061680043658[/C][/ROW]
[ROW][C]-25.497576617551[/C][/ROW]
[ROW][C]-49.9685856159564[/C][/ROW]
[ROW][C]246.587860636101[/C][/ROW]
[ROW][C]-28.737997044266[/C][/ROW]
[ROW][C]-78.2339730301888[/C][/ROW]
[ROW][C]-202.78360183861[/C][/ROW]
[ROW][C]-2.84318559866829[/C][/ROW]
[ROW][C]-134.16236734006[/C][/ROW]
[ROW][C]-506.838310709913[/C][/ROW]
[ROW][C]156.304903961794[/C][/ROW]
[ROW][C]-19.8137181568524[/C][/ROW]
[ROW][C]256.945470772224[/C][/ROW]
[ROW][C]209.581688507325[/C][/ROW]
[ROW][C]-79.6075921122849[/C][/ROW]
[ROW][C]73.2548835712871[/C][/ROW]
[ROW][C]136.675355917748[/C][/ROW]
[/TABLE]
Source: https://freestatistics.org/blog/index.php?pk=300007&T=2

Globally Unique Identifier (entire table): ba.freestatistics.org/blog/index.php?pk=300007&T=2

As an alternative you can also use a QR Code:  

The GUIDs for individual cells are displayed in the table below:

Estimated ARIMA Residuals
Value
4.41899550516794
-58.1909003137286
-105.708978151927
25.2468487894438
257.827045036988
43.074249214001
76.3796108956994
66.5874497638869
125.996720904434
264.479118166407
-52.4355172275132
-242.989595119056
-6.36228415984459
117.103040224008
78.2941626602175
196.858406662539
-119.681049124155
110.372309787252
-77.1334070857326
73.2729324984381
232.323749410042
15.3724396250591
97.4549431799771
228.809817612519
442.417170998731
116.755777183075
324.166568016563
15.5071396900198
-144.724155813353
-166.518517304165
51.6919440039792
-703.435289974718
156.79844937887
284.940136136122
-13.5240536617206
95.4958072318222
161.924926077785
380.714239188345
181.567830530053
-78.7515837025042
-24.403840615891
-85.1633534091877
-285.763723834777
93.1140458366947
-70.4160923593977
24.7746189330153
-133.797912451454
75.7869161297912
-110.367878261714
170.867193509225
-332.06883704824
376.32083328263
-284.817629302945
59.5825269649867
-150.996300100496
37.7433032964738
379.914619742565
-73.5324210671862
-270.175897157126
-23.2558928746059
323.411196689418
-24.3924454367698
167.048027220461
-74.7302178990762
-9.59776508568891
-182.819754761077
-138.999162742396
205.383649081103
-280.796430902582
335.059064221992
169.306068256119
-440.117238321489
180.411447942308
-80.4472016457563
-31.6729216412336
-88.7622915806972
31.852015705178
-266.476992935071
-113.392998440147
-67.0390845454532
-241.732103334081
148.333622553685
-286.047780637243
188.971433943742
-155.63635353575
576.497920873411
-41.4156970683055
-316.709948516248
53.1077757606246
220.339295833974
-62.7215020740225
-170.574919533795
345.932436746528
-8.81887850607141
226.035546639541
27.6599432567895
271.162293544564
266.877880267615
1102.94431081589
-52.5586390318671
-177.66280933014
-192.185404455299
-435.340910707841
33.4608453950007
188.670406574609
27.0061680043658
-25.497576617551
-49.9685856159564
246.587860636101
-28.737997044266
-78.2339730301888
-202.78360183861
-2.84318559866829
-134.16236734006
-506.838310709913
156.304903961794
-19.8137181568524
256.945470772224
209.581688507325
-79.6075921122849
73.2548835712871
136.675355917748


Parameters (Session):
par1 = 1 ; par2 = 2 ; par3 = TRUE ;
Parameters (R input):
par1 = FALSE ; par2 = 1 ; par3 = 1 ; par4 = 0 ; par5 = 12 ; par6 = 3 ; par7 = 1 ; par8 = 2 ; par9 = 1 ;
R code (references can be found in the software module):
par9 <- '1'
par8 <- '2'
par7 <- '1'
par6 <- '3'
par5 <- '12'
par4 <- '0'
par3 <- '0'
par2 <- '1'
par1 <- 'FALSE'
library(lattice)
if (par1 == 'TRUE') par1 <- TRUE
if (par1 == 'FALSE') par1 <- FALSE
par2 <- as.numeric(par2) #Box-Cox lambda transformation parameter
par3 <- as.numeric(par3) #degree of non-seasonal differencing
par4 <- as.numeric(par4) #degree of seasonal differencing
par5 <- as.numeric(par5) #seasonal period
par6 <- as.numeric(par6) #degree (p) of the non-seasonal AR(p) polynomial
par7 <- as.numeric(par7) #degree (q) of the non-seasonal MA(q) polynomial
par8 <- as.numeric(par8) #degree (P) of the seasonal AR(P) polynomial
par9 <- as.numeric(par9) #degree (Q) of the seasonal MA(Q) polynomial
armaGR <- function(arima.out, names, n){
try1 <- arima.out$coef
try2 <- sqrt(diag(arima.out$var.coef))
try.data.frame <- data.frame(matrix(NA,ncol=4,nrow=length(names)))
dimnames(try.data.frame) <- list(names,c('coef','std','tstat','pv'))
try.data.frame[,1] <- try1
for(i in 1:length(try2)) try.data.frame[which(rownames(try.data.frame)==names(try2)[i]),2] <- try2[i]
try.data.frame[,3] <- try.data.frame[,1] / try.data.frame[,2]
try.data.frame[,4] <- round((1-pt(abs(try.data.frame[,3]),df=n-(length(try2)+1)))*2,5)
vector <- rep(NA,length(names))
vector[is.na(try.data.frame[,4])] <- 0
maxi <- which.max(try.data.frame[,4])
continue <- max(try.data.frame[,4],na.rm=TRUE) > .05
vector[maxi] <- 0
list(summary=try.data.frame,next.vector=vector,continue=continue)
}
arimaSelect <- function(series, order=c(13,0,0), seasonal=list(order=c(2,0,0),period=12), include.mean=F){
nrc <- order[1]+order[3]+seasonal$order[1]+seasonal$order[3]
coeff <- matrix(NA, nrow=nrc*2, ncol=nrc)
pval <- matrix(NA, nrow=nrc*2, ncol=nrc)
mylist <- rep(list(NULL), nrc)
names <- NULL
if(order[1] > 0) names <- paste('ar',1:order[1],sep='')
if(order[3] > 0) names <- c( names , paste('ma',1:order[3],sep='') )
if(seasonal$order[1] > 0) names <- c(names, paste('sar',1:seasonal$order[1],sep=''))
if(seasonal$order[3] > 0) names <- c(names, paste('sma',1:seasonal$order[3],sep=''))
arima.out <- arima(series, order=order, seasonal=seasonal, include.mean=include.mean, method='ML')
mylist[[1]] <- arima.out
last.arma <- armaGR(arima.out, names, length(series))
mystop <- FALSE
i <- 1
coeff[i,] <- last.arma[[1]][,1]
pval [i,] <- last.arma[[1]][,4]
i <- 2
aic <- arima.out$aic
while(!mystop){
mylist[[i]] <- arima.out
arima.out <- arima(series, order=order, seasonal=seasonal, include.mean=include.mean, method='ML', fixed=last.arma$next.vector)
aic <- c(aic, arima.out$aic)
last.arma <- armaGR(arima.out, names, length(series))
mystop <- !last.arma$continue
coeff[i,] <- last.arma[[1]][,1]
pval [i,] <- last.arma[[1]][,4]
i <- i+1
}
list(coeff, pval, mylist, aic=aic)
}
arimaSelectplot <- function(arimaSelect.out,noms,choix){
noms <- names(arimaSelect.out[[3]][[1]]$coef)
coeff <- arimaSelect.out[[1]]
k <- min(which(is.na(coeff[,1])))-1
coeff <- coeff[1:k,]
pval <- arimaSelect.out[[2]][1:k,]
aic <- arimaSelect.out$aic[1:k]
coeff[coeff==0] <- NA
n <- ncol(coeff)
if(missing(choix)) choix <- k
layout(matrix(c(1,1,1,2,
3,3,3,2,
3,3,3,4,
5,6,7,7),nr=4),
widths=c(10,35,45,15),
heights=c(30,30,15,15))
couleurs <- rainbow(75)[1:50]#(50)
ticks <- pretty(coeff)
par(mar=c(1,1,3,1))
plot(aic,k:1-.5,type='o',pch=21,bg='blue',cex=2,axes=F,lty=2,xpd=NA)
points(aic[choix],k-choix+.5,pch=21,cex=4,bg=2,xpd=NA)
title('aic',line=2)
par(mar=c(3,0,0,0))
plot(0,axes=F,xlab='',ylab='',xlim=range(ticks),ylim=c(.1,1))
rect(xleft = min(ticks) + (0:49)/50*(max(ticks)-min(ticks)),
xright = min(ticks) + (1:50)/50*(max(ticks)-min(ticks)),
ytop = rep(1,50),
ybottom= rep(0,50),col=couleurs,border=NA)
axis(1,ticks)
rect(xleft=min(ticks),xright=max(ticks),ytop=1,ybottom=0)
text(mean(coeff,na.rm=T),.5,'coefficients',cex=2,font=2)
par(mar=c(1,1,3,1))
image(1:n,1:k,t(coeff[k:1,]),axes=F,col=couleurs,zlim=range(ticks))
for(i in 1:n) for(j in 1:k) if(!is.na(coeff[j,i])) {
if(pval[j,i]<.01) symb = 'green'
else if( (pval[j,i]<.05) & (pval[j,i]>=.01)) symb = 'orange'
else if( (pval[j,i]<.1) & (pval[j,i]>=.05)) symb = 'red'
else symb = 'black'
polygon(c(i+.5 ,i+.2 ,i+.5 ,i+.5),
c(k-j+0.5,k-j+0.5,k-j+0.8,k-j+0.5),
col=symb)
if(j==choix) {
rect(xleft=i-.5,
xright=i+.5,
ybottom=k-j+1.5,
ytop=k-j+.5,
lwd=4)
text(i,
k-j+1,
round(coeff[j,i],2),
cex=1.2,
font=2)
}
else{
rect(xleft=i-.5,xright=i+.5,ybottom=k-j+1.5,ytop=k-j+.5)
text(i,k-j+1,round(coeff[j,i],2),cex=1.2,font=1)
}
}
axis(3,1:n,noms)
par(mar=c(0.5,0,0,0.5))
plot(0,axes=F,xlab='',ylab='',type='n',xlim=c(0,8),ylim=c(-.2,.8))
cols <- c('green','orange','red','black')
niv <- c('0','0.01','0.05','0.1')
for(i in 0:3){
polygon(c(1+2*i ,1+2*i ,1+2*i-.5 ,1+2*i),
c(.4 ,.7 , .4 , .4),
col=cols[i+1])
text(2*i,0.5,niv[i+1],cex=1.5)
}
text(8,.5,1,cex=1.5)
text(4,0,'p-value',cex=2)
box()
residus <- arimaSelect.out[[3]][[choix]]$res
par(mar=c(1,2,4,1))
acf(residus,main='')
title('acf',line=.5)
par(mar=c(1,2,4,1))
pacf(residus,main='')
title('pacf',line=.5)
par(mar=c(2,2,4,1))
qqnorm(residus,main='')
title('qq-norm',line=.5)
qqline(residus)
residus
}
if (par2 == 0) x <- log(x)
if (par2 != 0) x <- x^par2
(selection <- arimaSelect(x, order=c(par6,par3,par7), seasonal=list(order=c(par8,par4,par9), period=par5)))
bitmap(file='test1.png')
resid <- arimaSelectplot(selection)
dev.off()
resid
bitmap(file='test2.png')
acf(resid,length(resid)/2, main='Residual Autocorrelation Function')
dev.off()
bitmap(file='test3.png')
pacf(resid,length(resid)/2, main='Residual Partial Autocorrelation Function')
dev.off()
bitmap(file='test4.png')
cpgram(resid, main='Residual Cumulative Periodogram')
dev.off()
bitmap(file='test5.png')
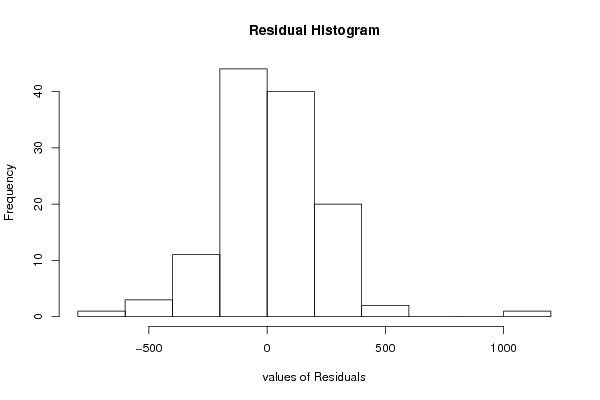
hist(resid, main='Residual Histogram', xlab='values of Residuals')
dev.off()
bitmap(file='test6.png')
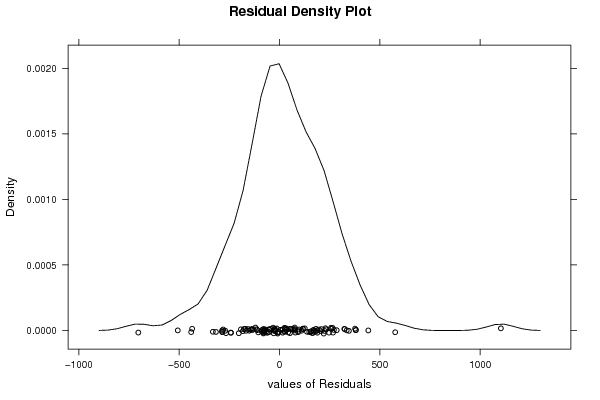
densityplot(~resid,col='black',main='Residual Density Plot', xlab='values of Residuals')
dev.off()
bitmap(file='test7.png')
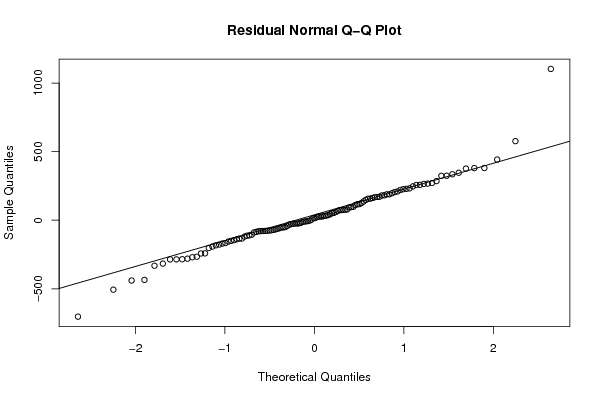
qqnorm(resid, main='Residual Normal Q-Q Plot')
qqline(resid)
dev.off()
ncols <- length(selection[[1]][1,])
nrows <- length(selection[[2]][,1])-1
load(file='createtable')
a<-table.start()
a<-table.row.start(a)
a<-table.element(a,'ARIMA Parameter Estimation and Backward Selection', ncols+1,TRUE)
a<-table.row.end(a)
a<-table.row.start(a)
a<-table.element(a,'Iteration', header=TRUE)
for (i in 1:ncols) {
a<-table.element(a,names(selection[[3]][[1]]$coef)[i],header=TRUE)
}
a<-table.row.end(a)
for (j in 1:nrows) {
a<-table.row.start(a)
mydum <- 'Estimates ('
mydum <- paste(mydum,j)
mydum <- paste(mydum,')')
a<-table.element(a,mydum, header=TRUE)
for (i in 1:ncols) {
a<-table.element(a,round(selection[[1]][j,i],4))
}
a<-table.row.end(a)
a<-table.row.start(a)
a<-table.element(a,'(p-val)', header=TRUE)
for (i in 1:ncols) {
mydum <- '('
mydum <- paste(mydum,round(selection[[2]][j,i],4),sep='')
mydum <- paste(mydum,')')
a<-table.element(a,mydum)
}
a<-table.row.end(a)
}
a<-table.end(a)
table.save(a,file='mytable.tab')
a<-table.start()
a<-table.row.start(a)
a<-table.element(a,'Estimated ARIMA Residuals', 1,TRUE)
a<-table.row.end(a)
a<-table.row.start(a)
a<-table.element(a,'Value', 1,TRUE)
a<-table.row.end(a)
for (i in (par4*par5+par3):length(resid)) {
a<-table.row.start(a)
a<-table.element(a,resid[i])
a<-table.row.end(a)
}
a<-table.end(a)
table.save(a,file='mytable1.tab')