Free Statistics

of Irreproducible Research!

Author's title

Author*The author of this computation has been verified*
R Software Modulerwasp_autocorrelation.wasp
Title produced by software(Partial) Autocorrelation Function
Date of computationThu, 15 Dec 2016 20:54:47 +0100
Cite this page as followsStatistical Computations at FreeStatistics.org, Office for Research Development and Education, URL https://freestatistics.org/blog/index.php?v=date/2016/Dec/15/t1481831852w9agfdvc0nzf03v.htm/, Retrieved Fri, 01 Nov 2024 03:34:23 +0000
Statistical Computations at FreeStatistics.org, Office for Research Development and Education, URL https://freestatistics.org/blog/index.php?pk=299987, Retrieved Fri, 01 Nov 2024 03:34:23 +0000
QR Codes:

Original text written by user:
IsPrivate?No (this computation is public)
User-defined keywords
Estimated Impact117
Family? (F = Feedback message, R = changed R code, M = changed R Module, P = changed Parameters, D = changed Data)
-       [(Partial) Autocorrelation Function] [ACF N2142 d=D=0] [2016-12-15 19:54:47] [31f526a885cd288e1bc58dc4a6a7fb1f] [Current]
Feedback Forum

Post a new message
Dataseries X:
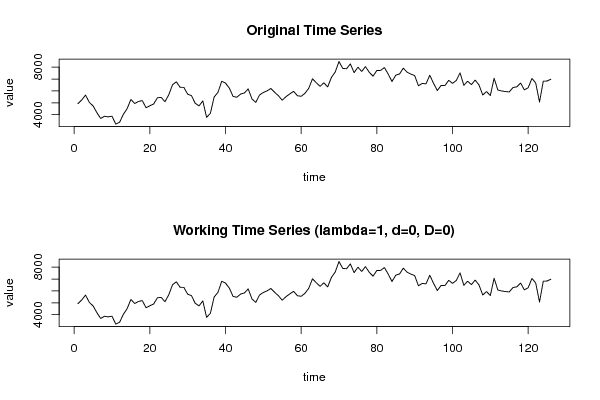
4926
5242
5650
5042
4738
4178
3688
3870
3822
3872
3216
3366
4034
4514
5286
4940
5112
5188
4588
4754
4898
5422
5458
5088
5676
6518
6768
6306
6296
5728
5604
4956
4744
5160
3782
4114
5488
5874
6812
6658
6236
5542
5468
5738
5828
6168
5324
5038
5662
5868
6008
6206
5880
5594
5216
5522
5748
5966
5600
5546
5798
6218
7020
6684
6386
6680
6332
7128
7592
8468
7892
7866
8270
7536
7990
7638
8040
7564
7234
7718
7722
7966
7412
6792
7316
7424
7910
7574
7414
7292
6432
6630
6594
7318
6634
6032
6460
6446
6890
6638
6872
7516
6474
6812
6532
6908
6502
5656
5948
5608
7062
6074
5998
5944
5914
6286
6340
6666
6090
6264
7052
6666
5060
6818
6830
6986


Summary of computational transaction
Raw Input view raw input (R code)
Raw Outputview raw output of R engine
Computing time1 seconds
R ServerBig Analytics Cloud Computing Center

\begin{tabular}{lllllllll}
\hline
Summary of computational transaction \tabularnewline
Raw Input view raw input (R code)  \tabularnewline
Raw Outputview raw output of R engine  \tabularnewline
Computing time1 seconds \tabularnewline
R ServerBig Analytics Cloud Computing Center \tabularnewline
\hline
\end{tabular}
%Source: https://freestatistics.org/blog/index.php?pk=299987&T=0

[TABLE]
[ROW]
Summary of computational transaction[/C][/ROW] [ROW]Raw Input[/C] view raw input (R code) [/C][/ROW] [ROW]Raw Output[/C]view raw output of R engine [/C][/ROW] [ROW]Computing time[/C]1 seconds[/C][/ROW] [ROW]R Server[/C]Big Analytics Cloud Computing Center[/C][/ROW] [/TABLE] Source: https://freestatistics.org/blog/index.php?pk=299987&T=0

Globally Unique Identifier (entire table): ba.freestatistics.org/blog/index.php?pk=299987&T=0

As an alternative you can also use a QR Code:  

The GUIDs for individual cells are displayed in the table below:

Summary of computational transaction
Raw Input view raw input (R code)
Raw Outputview raw output of R engine
Computing time1 seconds
R ServerBig Analytics Cloud Computing Center


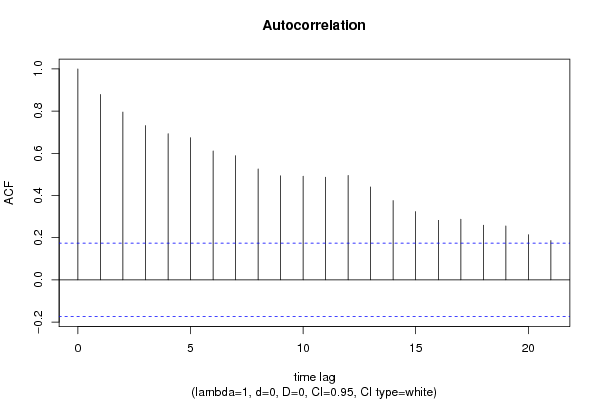
Autocorrelation Function
Time lag kACF(k)T-STATP-value
10.8785969.86220
20.7952138.92620
30.7311778.20740
40.6927897.77650
50.6734057.55890
60.6111236.85980
70.5881956.60250
80.5253935.89750
90.4930425.53440
100.4908225.50950
110.4864415.46030
120.4950655.55710
130.4404354.94391e-06
140.3755764.21582.4e-05
150.3234823.63110.000205
160.2820463.1660.000969
170.2871943.22380.000806
180.2588392.90550.002166
190.2550782.86320.002456
200.2138762.40080.008912
210.1861032.0890.01936

\begin{tabular}{lllllllll}
\hline
Autocorrelation Function \tabularnewline
Time lag k & ACF(k) & T-STAT & P-value \tabularnewline
1 & 0.878596 & 9.8622 & 0 \tabularnewline
2 & 0.795213 & 8.9262 & 0 \tabularnewline
3 & 0.731177 & 8.2074 & 0 \tabularnewline
4 & 0.692789 & 7.7765 & 0 \tabularnewline
5 & 0.673405 & 7.5589 & 0 \tabularnewline
6 & 0.611123 & 6.8598 & 0 \tabularnewline
7 & 0.588195 & 6.6025 & 0 \tabularnewline
8 & 0.525393 & 5.8975 & 0 \tabularnewline
9 & 0.493042 & 5.5344 & 0 \tabularnewline
10 & 0.490822 & 5.5095 & 0 \tabularnewline
11 & 0.486441 & 5.4603 & 0 \tabularnewline
12 & 0.495065 & 5.5571 & 0 \tabularnewline
13 & 0.440435 & 4.9439 & 1e-06 \tabularnewline
14 & 0.375576 & 4.2158 & 2.4e-05 \tabularnewline
15 & 0.323482 & 3.6311 & 0.000205 \tabularnewline
16 & 0.282046 & 3.166 & 0.000969 \tabularnewline
17 & 0.287194 & 3.2238 & 0.000806 \tabularnewline
18 & 0.258839 & 2.9055 & 0.002166 \tabularnewline
19 & 0.255078 & 2.8632 & 0.002456 \tabularnewline
20 & 0.213876 & 2.4008 & 0.008912 \tabularnewline
21 & 0.186103 & 2.089 & 0.01936 \tabularnewline
\hline
\end{tabular}
%Source: https://freestatistics.org/blog/index.php?pk=299987&T=1

[TABLE]
[ROW][C]Autocorrelation Function[/C][/ROW]
[ROW][C]Time lag k[/C][C]ACF(k)[/C][C]T-STAT[/C][C]P-value[/C][/ROW]
[ROW][C]1[/C][C]0.878596[/C][C]9.8622[/C][C]0[/C][/ROW]
[ROW][C]2[/C][C]0.795213[/C][C]8.9262[/C][C]0[/C][/ROW]
[ROW][C]3[/C][C]0.731177[/C][C]8.2074[/C][C]0[/C][/ROW]
[ROW][C]4[/C][C]0.692789[/C][C]7.7765[/C][C]0[/C][/ROW]
[ROW][C]5[/C][C]0.673405[/C][C]7.5589[/C][C]0[/C][/ROW]
[ROW][C]6[/C][C]0.611123[/C][C]6.8598[/C][C]0[/C][/ROW]
[ROW][C]7[/C][C]0.588195[/C][C]6.6025[/C][C]0[/C][/ROW]
[ROW][C]8[/C][C]0.525393[/C][C]5.8975[/C][C]0[/C][/ROW]
[ROW][C]9[/C][C]0.493042[/C][C]5.5344[/C][C]0[/C][/ROW]
[ROW][C]10[/C][C]0.490822[/C][C]5.5095[/C][C]0[/C][/ROW]
[ROW][C]11[/C][C]0.486441[/C][C]5.4603[/C][C]0[/C][/ROW]
[ROW][C]12[/C][C]0.495065[/C][C]5.5571[/C][C]0[/C][/ROW]
[ROW][C]13[/C][C]0.440435[/C][C]4.9439[/C][C]1e-06[/C][/ROW]
[ROW][C]14[/C][C]0.375576[/C][C]4.2158[/C][C]2.4e-05[/C][/ROW]
[ROW][C]15[/C][C]0.323482[/C][C]3.6311[/C][C]0.000205[/C][/ROW]
[ROW][C]16[/C][C]0.282046[/C][C]3.166[/C][C]0.000969[/C][/ROW]
[ROW][C]17[/C][C]0.287194[/C][C]3.2238[/C][C]0.000806[/C][/ROW]
[ROW][C]18[/C][C]0.258839[/C][C]2.9055[/C][C]0.002166[/C][/ROW]
[ROW][C]19[/C][C]0.255078[/C][C]2.8632[/C][C]0.002456[/C][/ROW]
[ROW][C]20[/C][C]0.213876[/C][C]2.4008[/C][C]0.008912[/C][/ROW]
[ROW][C]21[/C][C]0.186103[/C][C]2.089[/C][C]0.01936[/C][/ROW]
[/TABLE]
Source: https://freestatistics.org/blog/index.php?pk=299987&T=1

Globally Unique Identifier (entire table): ba.freestatistics.org/blog/index.php?pk=299987&T=1

As an alternative you can also use a QR Code:  

The GUIDs for individual cells are displayed in the table below:

Autocorrelation Function
Time lag kACF(k)T-STATP-value
10.8785969.86220
20.7952138.92620
30.7311778.20740
40.6927897.77650
50.6734057.55890
60.6111236.85980
70.5881956.60250
80.5253935.89750
90.4930425.53440
100.4908225.50950
110.4864415.46030
120.4950655.55710
130.4404354.94391e-06
140.3755764.21582.4e-05
150.3234823.63110.000205
160.2820463.1660.000969
170.2871943.22380.000806
180.2588392.90550.002166
190.2550782.86320.002456
200.2138762.40080.008912
210.1861032.0890.01936


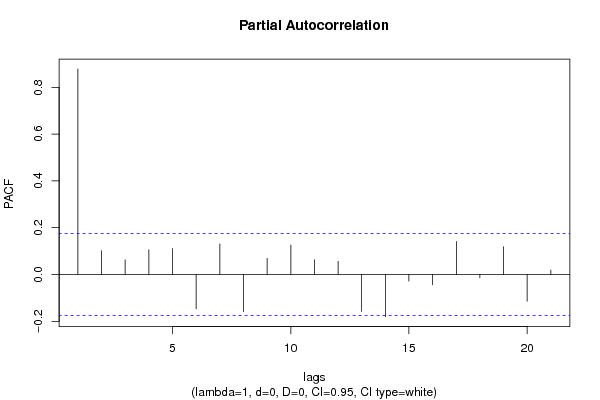
Partial Autocorrelation Function
Time lag kPACF(k)T-STATP-value
10.8785969.86220
20.1020831.14590.12701
30.0626490.70320.241602
40.1054981.18420.119279
50.1105061.24040.10856
6-0.14627-1.64190.051555
70.1307091.46720.072407
8-0.158658-1.78090.038667
90.0690760.77540.219784
100.1264321.41920.079155
110.0631270.70860.239941
120.0560060.62870.265353
13-0.157755-1.77080.039506
14-0.180183-2.02250.022618
15-0.028213-0.31670.376003
16-0.044143-0.49550.310553
170.1409621.58230.058045
18-0.013853-0.15550.438337
190.1189591.33530.09209
20-0.114543-1.28570.100446
210.0187870.21090.416661

\begin{tabular}{lllllllll}
\hline
Partial Autocorrelation Function \tabularnewline
Time lag k & PACF(k) & T-STAT & P-value \tabularnewline
1 & 0.878596 & 9.8622 & 0 \tabularnewline
2 & 0.102083 & 1.1459 & 0.12701 \tabularnewline
3 & 0.062649 & 0.7032 & 0.241602 \tabularnewline
4 & 0.105498 & 1.1842 & 0.119279 \tabularnewline
5 & 0.110506 & 1.2404 & 0.10856 \tabularnewline
6 & -0.14627 & -1.6419 & 0.051555 \tabularnewline
7 & 0.130709 & 1.4672 & 0.072407 \tabularnewline
8 & -0.158658 & -1.7809 & 0.038667 \tabularnewline
9 & 0.069076 & 0.7754 & 0.219784 \tabularnewline
10 & 0.126432 & 1.4192 & 0.079155 \tabularnewline
11 & 0.063127 & 0.7086 & 0.239941 \tabularnewline
12 & 0.056006 & 0.6287 & 0.265353 \tabularnewline
13 & -0.157755 & -1.7708 & 0.039506 \tabularnewline
14 & -0.180183 & -2.0225 & 0.022618 \tabularnewline
15 & -0.028213 & -0.3167 & 0.376003 \tabularnewline
16 & -0.044143 & -0.4955 & 0.310553 \tabularnewline
17 & 0.140962 & 1.5823 & 0.058045 \tabularnewline
18 & -0.013853 & -0.1555 & 0.438337 \tabularnewline
19 & 0.118959 & 1.3353 & 0.09209 \tabularnewline
20 & -0.114543 & -1.2857 & 0.100446 \tabularnewline
21 & 0.018787 & 0.2109 & 0.416661 \tabularnewline
\hline
\end{tabular}
%Source: https://freestatistics.org/blog/index.php?pk=299987&T=2

[TABLE]
[ROW][C]Partial Autocorrelation Function[/C][/ROW]
[ROW][C]Time lag k[/C][C]PACF(k)[/C][C]T-STAT[/C][C]P-value[/C][/ROW]
[ROW][C]1[/C][C]0.878596[/C][C]9.8622[/C][C]0[/C][/ROW]
[ROW][C]2[/C][C]0.102083[/C][C]1.1459[/C][C]0.12701[/C][/ROW]
[ROW][C]3[/C][C]0.062649[/C][C]0.7032[/C][C]0.241602[/C][/ROW]
[ROW][C]4[/C][C]0.105498[/C][C]1.1842[/C][C]0.119279[/C][/ROW]
[ROW][C]5[/C][C]0.110506[/C][C]1.2404[/C][C]0.10856[/C][/ROW]
[ROW][C]6[/C][C]-0.14627[/C][C]-1.6419[/C][C]0.051555[/C][/ROW]
[ROW][C]7[/C][C]0.130709[/C][C]1.4672[/C][C]0.072407[/C][/ROW]
[ROW][C]8[/C][C]-0.158658[/C][C]-1.7809[/C][C]0.038667[/C][/ROW]
[ROW][C]9[/C][C]0.069076[/C][C]0.7754[/C][C]0.219784[/C][/ROW]
[ROW][C]10[/C][C]0.126432[/C][C]1.4192[/C][C]0.079155[/C][/ROW]
[ROW][C]11[/C][C]0.063127[/C][C]0.7086[/C][C]0.239941[/C][/ROW]
[ROW][C]12[/C][C]0.056006[/C][C]0.6287[/C][C]0.265353[/C][/ROW]
[ROW][C]13[/C][C]-0.157755[/C][C]-1.7708[/C][C]0.039506[/C][/ROW]
[ROW][C]14[/C][C]-0.180183[/C][C]-2.0225[/C][C]0.022618[/C][/ROW]
[ROW][C]15[/C][C]-0.028213[/C][C]-0.3167[/C][C]0.376003[/C][/ROW]
[ROW][C]16[/C][C]-0.044143[/C][C]-0.4955[/C][C]0.310553[/C][/ROW]
[ROW][C]17[/C][C]0.140962[/C][C]1.5823[/C][C]0.058045[/C][/ROW]
[ROW][C]18[/C][C]-0.013853[/C][C]-0.1555[/C][C]0.438337[/C][/ROW]
[ROW][C]19[/C][C]0.118959[/C][C]1.3353[/C][C]0.09209[/C][/ROW]
[ROW][C]20[/C][C]-0.114543[/C][C]-1.2857[/C][C]0.100446[/C][/ROW]
[ROW][C]21[/C][C]0.018787[/C][C]0.2109[/C][C]0.416661[/C][/ROW]
[/TABLE]
Source: https://freestatistics.org/blog/index.php?pk=299987&T=2

Globally Unique Identifier (entire table): ba.freestatistics.org/blog/index.php?pk=299987&T=2

As an alternative you can also use a QR Code:  

The GUIDs for individual cells are displayed in the table below:

Partial Autocorrelation Function
Time lag kPACF(k)T-STATP-value
10.8785969.86220
20.1020831.14590.12701
30.0626490.70320.241602
40.1054981.18420.119279
50.1105061.24040.10856
6-0.14627-1.64190.051555
70.1307091.46720.072407
8-0.158658-1.78090.038667
90.0690760.77540.219784
100.1264321.41920.079155
110.0631270.70860.239941
120.0560060.62870.265353
13-0.157755-1.77080.039506
14-0.180183-2.02250.022618
15-0.028213-0.31670.376003
16-0.044143-0.49550.310553
170.1409621.58230.058045
18-0.013853-0.15550.438337
190.1189591.33530.09209
20-0.114543-1.28570.100446
210.0187870.21090.416661


Parameters (Session):
par1 = Default ; par2 = 1 ; par3 = 0 ; par4 = 0 ; par5 = 12 ; par6 = White Noise ; par7 = 0.95 ;
Parameters (R input):
par1 = Default ; par2 = 1 ; par3 = 0 ; par4 = 0 ; par5 = 12 ; par6 = White Noise ; par7 = 0.95 ; par8 = ;
R code (references can be found in the software module):
if (par1 == 'Default') {
par1 = 10*log10(length(x))
} else {
par1 <- as.numeric(par1)
}
par2 <- as.numeric(par2)
par3 <- as.numeric(par3)
par4 <- as.numeric(par4)
par5 <- as.numeric(par5)
if (par6 == 'White Noise') par6 <- 'white' else par6 <- 'ma'
par7 <- as.numeric(par7)
if (par8 != '') par8 <- as.numeric(par8)
x <- na.omit(x)
ox <- x
if (par8 == '') {
if (par2 == 0) {
x <- log(x)
} else {
x <- (x ^ par2 - 1) / par2
}
} else {
x <- log(x,base=par8)
}
if (par3 > 0) x <- diff(x,lag=1,difference=par3)
if (par4 > 0) x <- diff(x,lag=par5,difference=par4)
bitmap(file='picts.png')
op <- par(mfrow=c(2,1))
plot(ox,type='l',main='Original Time Series',xlab='time',ylab='value')
if (par8=='') {
mytitle <- paste('Working Time Series (lambda=',par2,', d=',par3,', D=',par4,')',sep='')
mysub <- paste('(lambda=',par2,', d=',par3,', D=',par4,', CI=', par7, ', CI type=',par6,')',sep='')
} else {
mytitle <- paste('Working Time Series (base=',par8,', d=',par3,', D=',par4,')',sep='')
mysub <- paste('(base=',par8,', d=',par3,', D=',par4,', CI=', par7, ', CI type=',par6,')',sep='')
}
plot(x,type='l', main=mytitle,xlab='time',ylab='value')
par(op)
dev.off()
bitmap(file='pic1.png')
racf <- acf(x, par1, main='Autocorrelation', xlab='time lag', ylab='ACF', ci.type=par6, ci=par7, sub=mysub)
dev.off()
bitmap(file='pic2.png')
rpacf <- pacf(x,par1,main='Partial Autocorrelation',xlab='lags',ylab='PACF',sub=mysub)
dev.off()
(myacf <- c(racf$acf))
(mypacf <- c(rpacf$acf))
lengthx <- length(x)
sqrtn <- sqrt(lengthx)
load(file='createtable')
a<-table.start()
a<-table.row.start(a)
a<-table.element(a,'Autocorrelation Function',4,TRUE)
a<-table.row.end(a)
a<-table.row.start(a)
a<-table.element(a,'Time lag k',header=TRUE)
a<-table.element(a,'ACF(k)',header=TRUE)
a<-table.element(a,'T-STAT',header=TRUE)
a<-table.element(a,'P-value',header=TRUE)
a<-table.row.end(a)
for (i in 2:(par1+1)) {
a<-table.row.start(a)
a<-table.element(a,i-1,header=TRUE)
a<-table.element(a,round(myacf[i],6))
mytstat <- myacf[i]*sqrtn
a<-table.element(a,round(mytstat,4))
a<-table.element(a,round(1-pt(abs(mytstat),lengthx),6))
a<-table.row.end(a)
}
a<-table.end(a)
table.save(a,file='mytable.tab')
a<-table.start()
a<-table.row.start(a)
a<-table.element(a,'Partial Autocorrelation Function',4,TRUE)
a<-table.row.end(a)
a<-table.row.start(a)
a<-table.element(a,'Time lag k',header=TRUE)
a<-table.element(a,'PACF(k)',header=TRUE)
a<-table.element(a,'T-STAT',header=TRUE)
a<-table.element(a,'P-value',header=TRUE)
a<-table.row.end(a)
for (i in 1:par1) {
a<-table.row.start(a)
a<-table.element(a,i,header=TRUE)
a<-table.element(a,round(mypacf[i],6))
mytstat <- mypacf[i]*sqrtn
a<-table.element(a,round(mytstat,4))
a<-table.element(a,round(1-pt(abs(mytstat),lengthx),6))
a<-table.row.end(a)
}
a<-table.end(a)
table.save(a,file='mytable1.tab')