Free Statistics

of Irreproducible Research!

Author's title

Author*The author of this computation has been verified*
R Software Modulerwasp_arimaforecasting.wasp
Title produced by softwareARIMA Forecasting
Date of computationWed, 14 Dec 2016 18:14:04 +0100
Cite this page as followsStatistical Computations at FreeStatistics.org, Office for Research Development and Education, URL https://freestatistics.org/blog/index.php?v=date/2016/Dec/14/t1481735756vfr3qc7btb6zvhg.htm/, Retrieved Fri, 01 Nov 2024 03:42:55 +0000
Statistical Computations at FreeStatistics.org, Office for Research Development and Education, URL https://freestatistics.org/blog/index.php?pk=299646, Retrieved Fri, 01 Nov 2024 03:42:55 +0000
QR Codes:

Original text written by user:
IsPrivate?No (this computation is public)
User-defined keywords
Estimated Impact94
Family? (F = Feedback message, R = changed R code, M = changed R Module, P = changed Parameters, D = changed Data)
-       [ARIMA Forecasting] [kyle] [2016-12-14 17:14:04] [673dd365cbcfe0c4e35658a2fe545652] [Current]
Feedback Forum

Post a new message
Dataseries X:
3106.78
3235.94
2998.12
2896.3
2952
3060.24
2988.32
2889
2881.82
2969.22
3026.2
3146.08
3032.48
2719.74
2785.18
2797.28
2783.7
2822.84
2835.8
2823.22
2879.14
3003.5
2910.7
2895.54
2982.36
3087.2
3195.28
3272.72
3390.6
3676.12
4052.18
4431.2
4554.96
4279.7
4391.86
4482.82
4530.68
4580.66
4623.5
4720.14
4811.82
4980.18
5174.28
5181.24


Summary of computational transaction
Raw Input view raw input (R code)
Raw Outputview raw output of R engine
Computing time2 seconds
R ServerBig Analytics Cloud Computing Center

\begin{tabular}{lllllllll}
\hline
Summary of computational transaction \tabularnewline
Raw Input view raw input (R code)  \tabularnewline
Raw Outputview raw output of R engine  \tabularnewline
Computing time2 seconds \tabularnewline
R ServerBig Analytics Cloud Computing Center \tabularnewline
\hline
\end{tabular}
%Source: https://freestatistics.org/blog/index.php?pk=299646&T=0

[TABLE]
[ROW]
Summary of computational transaction[/C][/ROW] [ROW]Raw Input[/C] view raw input (R code) [/C][/ROW] [ROW]Raw Output[/C]view raw output of R engine [/C][/ROW] [ROW]Computing time[/C]2 seconds[/C][/ROW] [ROW]R Server[/C]Big Analytics Cloud Computing Center[/C][/ROW] [/TABLE] Source: https://freestatistics.org/blog/index.php?pk=299646&T=0

Globally Unique Identifier (entire table): ba.freestatistics.org/blog/index.php?pk=299646&T=0

As an alternative you can also use a QR Code:  

The GUIDs for individual cells are displayed in the table below:

Summary of computational transaction
Raw Input view raw input (R code)
Raw Outputview raw output of R engine
Computing time2 seconds
R ServerBig Analytics Cloud Computing Center


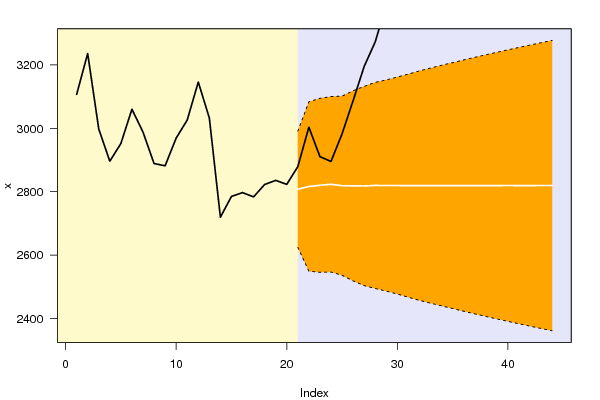
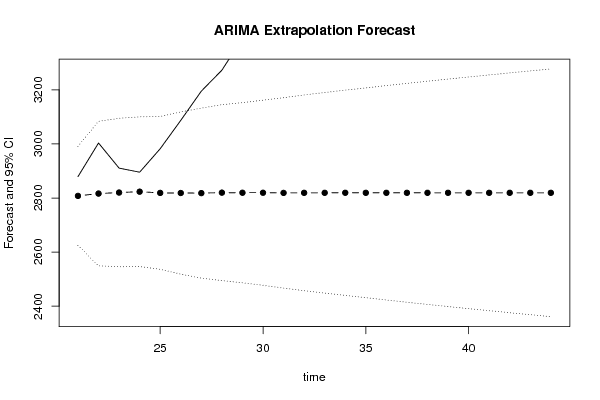
Univariate ARIMA Extrapolation Forecast
timeY[t]F[t]95% LB95% UBp-value(H0: Y[t] = F[t])P(F[t]>Y[t-1])P(F[t]>Y[t-s])P(F[t]>Y[20])
192835.8-------
202823.22-------
212879.142807.88482624.68982991.07980.22290.43480.43480.4348
223003.52816.55122549.40343083.6990.08510.3230.3230.4805
232910.72820.31262545.933094.69510.25920.09530.09530.4917
242895.542823.49992546.72993100.270.3050.26840.26840.5008
252982.362819.00052536.4433101.55790.12860.29770.29770.4883
263087.22818.62882518.70123118.55650.03960.14230.14230.488
273195.282818.1832503.84563132.52040.00940.04670.04670.4875
283272.722819.95422494.77993145.12840.00320.01180.01180.4921
293390.62819.60662486.57543152.63784e-040.00380.00380.4915
303676.122819.64562477.37153161.919605e-045e-040.4918
314052.182819.05192467.06453171.03940000.4907
324431.22819.34922457.41043181.2880000.4916
334554.962819.32052448.48653190.15450000.4918
344279.72819.50142440.04453198.95830000.4923
354391.862819.34532431.50423207.18650000.4922
364482.822819.37982423.05373215.70590000.4924
374530.682819.32522414.74783223.90260000.4925
384580.662819.39242406.73033232.05460000.4927
394623.52819.36682398.86083239.87290000.4928
404720.142819.38542391.13513247.63560000.493
414811.822819.35922383.50453255.2140000.4931
424980.182819.37382376.0213262.72660000.4932
435174.282819.36622368.66173270.07060000.4933
445181.242819.37592361.43363277.31820000.4934

\begin{tabular}{lllllllll}
\hline
Univariate ARIMA Extrapolation Forecast \tabularnewline
time & Y[t] & F[t] & 95% LB & 95% UB & p-value(H0: Y[t] = F[t]) & P(F[t]>Y[t-1]) & P(F[t]>Y[t-s]) & P(F[t]>Y[20]) \tabularnewline
19 & 2835.8 & - & - & - & - & - & - & - \tabularnewline
20 & 2823.22 & - & - & - & - & - & - & - \tabularnewline
21 & 2879.14 & 2807.8848 & 2624.6898 & 2991.0798 & 0.2229 & 0.4348 & 0.4348 & 0.4348 \tabularnewline
22 & 3003.5 & 2816.5512 & 2549.4034 & 3083.699 & 0.0851 & 0.323 & 0.323 & 0.4805 \tabularnewline
23 & 2910.7 & 2820.3126 & 2545.93 & 3094.6951 & 0.2592 & 0.0953 & 0.0953 & 0.4917 \tabularnewline
24 & 2895.54 & 2823.4999 & 2546.7299 & 3100.27 & 0.305 & 0.2684 & 0.2684 & 0.5008 \tabularnewline
25 & 2982.36 & 2819.0005 & 2536.443 & 3101.5579 & 0.1286 & 0.2977 & 0.2977 & 0.4883 \tabularnewline
26 & 3087.2 & 2818.6288 & 2518.7012 & 3118.5565 & 0.0396 & 0.1423 & 0.1423 & 0.488 \tabularnewline
27 & 3195.28 & 2818.183 & 2503.8456 & 3132.5204 & 0.0094 & 0.0467 & 0.0467 & 0.4875 \tabularnewline
28 & 3272.72 & 2819.9542 & 2494.7799 & 3145.1284 & 0.0032 & 0.0118 & 0.0118 & 0.4921 \tabularnewline
29 & 3390.6 & 2819.6066 & 2486.5754 & 3152.6378 & 4e-04 & 0.0038 & 0.0038 & 0.4915 \tabularnewline
30 & 3676.12 & 2819.6456 & 2477.3715 & 3161.9196 & 0 & 5e-04 & 5e-04 & 0.4918 \tabularnewline
31 & 4052.18 & 2819.0519 & 2467.0645 & 3171.0394 & 0 & 0 & 0 & 0.4907 \tabularnewline
32 & 4431.2 & 2819.3492 & 2457.4104 & 3181.288 & 0 & 0 & 0 & 0.4916 \tabularnewline
33 & 4554.96 & 2819.3205 & 2448.4865 & 3190.1545 & 0 & 0 & 0 & 0.4918 \tabularnewline
34 & 4279.7 & 2819.5014 & 2440.0445 & 3198.9583 & 0 & 0 & 0 & 0.4923 \tabularnewline
35 & 4391.86 & 2819.3453 & 2431.5042 & 3207.1865 & 0 & 0 & 0 & 0.4922 \tabularnewline
36 & 4482.82 & 2819.3798 & 2423.0537 & 3215.7059 & 0 & 0 & 0 & 0.4924 \tabularnewline
37 & 4530.68 & 2819.3252 & 2414.7478 & 3223.9026 & 0 & 0 & 0 & 0.4925 \tabularnewline
38 & 4580.66 & 2819.3924 & 2406.7303 & 3232.0546 & 0 & 0 & 0 & 0.4927 \tabularnewline
39 & 4623.5 & 2819.3668 & 2398.8608 & 3239.8729 & 0 & 0 & 0 & 0.4928 \tabularnewline
40 & 4720.14 & 2819.3854 & 2391.1351 & 3247.6356 & 0 & 0 & 0 & 0.493 \tabularnewline
41 & 4811.82 & 2819.3592 & 2383.5045 & 3255.214 & 0 & 0 & 0 & 0.4931 \tabularnewline
42 & 4980.18 & 2819.3738 & 2376.021 & 3262.7266 & 0 & 0 & 0 & 0.4932 \tabularnewline
43 & 5174.28 & 2819.3662 & 2368.6617 & 3270.0706 & 0 & 0 & 0 & 0.4933 \tabularnewline
44 & 5181.24 & 2819.3759 & 2361.4336 & 3277.3182 & 0 & 0 & 0 & 0.4934 \tabularnewline
\hline
\end{tabular}
%Source: https://freestatistics.org/blog/index.php?pk=299646&T=1

[TABLE]
[ROW][C]Univariate ARIMA Extrapolation Forecast[/C][/ROW]
[ROW][C]time[/C][C]Y[t][/C][C]F[t][/C][C]95% LB[/C][C]95% UB[/C][C]p-value(H0: Y[t] = F[t])[/C][C]P(F[t]>Y[t-1])[/C][C]P(F[t]>Y[t-s])[/C][C]P(F[t]>Y[20])[/C][/ROW]
[ROW][C]19[/C][C]2835.8[/C][C]-[/C][C]-[/C][C]-[/C][C]-[/C][C]-[/C][C]-[/C][C]-[/C][/ROW]
[ROW][C]20[/C][C]2823.22[/C][C]-[/C][C]-[/C][C]-[/C][C]-[/C][C]-[/C][C]-[/C][C]-[/C][/ROW]
[ROW][C]21[/C][C]2879.14[/C][C]2807.8848[/C][C]2624.6898[/C][C]2991.0798[/C][C]0.2229[/C][C]0.4348[/C][C]0.4348[/C][C]0.4348[/C][/ROW]
[ROW][C]22[/C][C]3003.5[/C][C]2816.5512[/C][C]2549.4034[/C][C]3083.699[/C][C]0.0851[/C][C]0.323[/C][C]0.323[/C][C]0.4805[/C][/ROW]
[ROW][C]23[/C][C]2910.7[/C][C]2820.3126[/C][C]2545.93[/C][C]3094.6951[/C][C]0.2592[/C][C]0.0953[/C][C]0.0953[/C][C]0.4917[/C][/ROW]
[ROW][C]24[/C][C]2895.54[/C][C]2823.4999[/C][C]2546.7299[/C][C]3100.27[/C][C]0.305[/C][C]0.2684[/C][C]0.2684[/C][C]0.5008[/C][/ROW]
[ROW][C]25[/C][C]2982.36[/C][C]2819.0005[/C][C]2536.443[/C][C]3101.5579[/C][C]0.1286[/C][C]0.2977[/C][C]0.2977[/C][C]0.4883[/C][/ROW]
[ROW][C]26[/C][C]3087.2[/C][C]2818.6288[/C][C]2518.7012[/C][C]3118.5565[/C][C]0.0396[/C][C]0.1423[/C][C]0.1423[/C][C]0.488[/C][/ROW]
[ROW][C]27[/C][C]3195.28[/C][C]2818.183[/C][C]2503.8456[/C][C]3132.5204[/C][C]0.0094[/C][C]0.0467[/C][C]0.0467[/C][C]0.4875[/C][/ROW]
[ROW][C]28[/C][C]3272.72[/C][C]2819.9542[/C][C]2494.7799[/C][C]3145.1284[/C][C]0.0032[/C][C]0.0118[/C][C]0.0118[/C][C]0.4921[/C][/ROW]
[ROW][C]29[/C][C]3390.6[/C][C]2819.6066[/C][C]2486.5754[/C][C]3152.6378[/C][C]4e-04[/C][C]0.0038[/C][C]0.0038[/C][C]0.4915[/C][/ROW]
[ROW][C]30[/C][C]3676.12[/C][C]2819.6456[/C][C]2477.3715[/C][C]3161.9196[/C][C]0[/C][C]5e-04[/C][C]5e-04[/C][C]0.4918[/C][/ROW]
[ROW][C]31[/C][C]4052.18[/C][C]2819.0519[/C][C]2467.0645[/C][C]3171.0394[/C][C]0[/C][C]0[/C][C]0[/C][C]0.4907[/C][/ROW]
[ROW][C]32[/C][C]4431.2[/C][C]2819.3492[/C][C]2457.4104[/C][C]3181.288[/C][C]0[/C][C]0[/C][C]0[/C][C]0.4916[/C][/ROW]
[ROW][C]33[/C][C]4554.96[/C][C]2819.3205[/C][C]2448.4865[/C][C]3190.1545[/C][C]0[/C][C]0[/C][C]0[/C][C]0.4918[/C][/ROW]
[ROW][C]34[/C][C]4279.7[/C][C]2819.5014[/C][C]2440.0445[/C][C]3198.9583[/C][C]0[/C][C]0[/C][C]0[/C][C]0.4923[/C][/ROW]
[ROW][C]35[/C][C]4391.86[/C][C]2819.3453[/C][C]2431.5042[/C][C]3207.1865[/C][C]0[/C][C]0[/C][C]0[/C][C]0.4922[/C][/ROW]
[ROW][C]36[/C][C]4482.82[/C][C]2819.3798[/C][C]2423.0537[/C][C]3215.7059[/C][C]0[/C][C]0[/C][C]0[/C][C]0.4924[/C][/ROW]
[ROW][C]37[/C][C]4530.68[/C][C]2819.3252[/C][C]2414.7478[/C][C]3223.9026[/C][C]0[/C][C]0[/C][C]0[/C][C]0.4925[/C][/ROW]
[ROW][C]38[/C][C]4580.66[/C][C]2819.3924[/C][C]2406.7303[/C][C]3232.0546[/C][C]0[/C][C]0[/C][C]0[/C][C]0.4927[/C][/ROW]
[ROW][C]39[/C][C]4623.5[/C][C]2819.3668[/C][C]2398.8608[/C][C]3239.8729[/C][C]0[/C][C]0[/C][C]0[/C][C]0.4928[/C][/ROW]
[ROW][C]40[/C][C]4720.14[/C][C]2819.3854[/C][C]2391.1351[/C][C]3247.6356[/C][C]0[/C][C]0[/C][C]0[/C][C]0.493[/C][/ROW]
[ROW][C]41[/C][C]4811.82[/C][C]2819.3592[/C][C]2383.5045[/C][C]3255.214[/C][C]0[/C][C]0[/C][C]0[/C][C]0.4931[/C][/ROW]
[ROW][C]42[/C][C]4980.18[/C][C]2819.3738[/C][C]2376.021[/C][C]3262.7266[/C][C]0[/C][C]0[/C][C]0[/C][C]0.4932[/C][/ROW]
[ROW][C]43[/C][C]5174.28[/C][C]2819.3662[/C][C]2368.6617[/C][C]3270.0706[/C][C]0[/C][C]0[/C][C]0[/C][C]0.4933[/C][/ROW]
[ROW][C]44[/C][C]5181.24[/C][C]2819.3759[/C][C]2361.4336[/C][C]3277.3182[/C][C]0[/C][C]0[/C][C]0[/C][C]0.4934[/C][/ROW]
[/TABLE]
Source: https://freestatistics.org/blog/index.php?pk=299646&T=1

Globally Unique Identifier (entire table): ba.freestatistics.org/blog/index.php?pk=299646&T=1

As an alternative you can also use a QR Code:  

The GUIDs for individual cells are displayed in the table below:

Univariate ARIMA Extrapolation Forecast
timeY[t]F[t]95% LB95% UBp-value(H0: Y[t] = F[t])P(F[t]>Y[t-1])P(F[t]>Y[t-s])P(F[t]>Y[20])
192835.8-------
202823.22-------
212879.142807.88482624.68982991.07980.22290.43480.43480.4348
223003.52816.55122549.40343083.6990.08510.3230.3230.4805
232910.72820.31262545.933094.69510.25920.09530.09530.4917
242895.542823.49992546.72993100.270.3050.26840.26840.5008
252982.362819.00052536.4433101.55790.12860.29770.29770.4883
263087.22818.62882518.70123118.55650.03960.14230.14230.488
273195.282818.1832503.84563132.52040.00940.04670.04670.4875
283272.722819.95422494.77993145.12840.00320.01180.01180.4921
293390.62819.60662486.57543152.63784e-040.00380.00380.4915
303676.122819.64562477.37153161.919605e-045e-040.4918
314052.182819.05192467.06453171.03940000.4907
324431.22819.34922457.41043181.2880000.4916
334554.962819.32052448.48653190.15450000.4918
344279.72819.50142440.04453198.95830000.4923
354391.862819.34532431.50423207.18650000.4922
364482.822819.37982423.05373215.70590000.4924
374530.682819.32522414.74783223.90260000.4925
384580.662819.39242406.73033232.05460000.4927
394623.52819.36682398.86083239.87290000.4928
404720.142819.38542391.13513247.63560000.493
414811.822819.35922383.50453255.2140000.4931
424980.182819.37382376.0213262.72660000.4932
435174.282819.36622368.66173270.07060000.4933
445181.242819.37592361.43363277.31820000.4934


Univariate ARIMA Extrapolation Forecast Performance
time% S.E.PEMAPEsMAPESq.EMSERMSEScaledEMASE
210.03330.02470.02470.02515077.3033000.53410.5341
220.04840.06220.04350.044734949.845420013.5744141.46931.40130.9677
230.04960.03110.03930.04038169.886216065.6783126.75050.67750.8709
240.050.02490.03570.03655189.773613346.7021115.52790.540.7882
250.05110.05480.03950.040526686.340316014.6298126.54891.22440.8755
260.05430.0870.04740.048972130.480425367.2715159.27112.01311.0651
270.05690.1180.05750.0598142202.160942057.97205.08042.82651.3167
280.05880.13830.06760.0709204996.89662425.3358249.85063.39371.5763
290.06030.16840.07880.0835326033.477791715.1293302.84514.27981.8767
300.06190.2330.09420.1015733548.4689155898.4633394.83986.41962.331
310.06370.30430.11330.12491520604.8472279962.68529.1159.24282.9593
320.06550.36380.13420.15152598063.1209473137.7167687.850112.08153.7195
330.06710.3810.15320.17613012444.4265668469.0021817.599513.00934.4341
340.06870.34120.16660.19292132180.03773019.7898879.215410.94484.8992
350.07020.35810.17940.20912472802.3697886338.6285941.455611.78675.3583
360.07170.37110.19140.22452767033.38281003882.05061001.939112.46825.8027
370.07320.37770.20230.23872928735.3561117108.71561056.933612.82736.2159
380.07470.38450.21240.25193102063.39541227383.97561107.873613.20146.604
390.07610.39020.22180.26413254896.44241334095.15811155.030413.52276.9681
400.07750.40270.23080.27623612868.12711448033.80651203.342814.2477.3321
410.07890.41410.23960.28793969899.86791568122.66661252.24714.93437.6941
420.08020.43390.24840.34669083.23861709075.41991307.316116.19628.0806
430.08160.45510.25740.31255545619.08041875881.6661369.628317.65118.4967
440.08290.45580.26570.32415578402.07722030153.34981424.834517.70328.8803

\begin{tabular}{lllllllll}
\hline
Univariate ARIMA Extrapolation Forecast Performance \tabularnewline
time & % S.E. & PE & MAPE & sMAPE & Sq.E & MSE & RMSE & ScaledE & MASE \tabularnewline
21 & 0.0333 & 0.0247 & 0.0247 & 0.0251 & 5077.3033 & 0 & 0 & 0.5341 & 0.5341 \tabularnewline
22 & 0.0484 & 0.0622 & 0.0435 & 0.0447 & 34949.8454 & 20013.5744 & 141.4693 & 1.4013 & 0.9677 \tabularnewline
23 & 0.0496 & 0.0311 & 0.0393 & 0.0403 & 8169.8862 & 16065.6783 & 126.7505 & 0.6775 & 0.8709 \tabularnewline
24 & 0.05 & 0.0249 & 0.0357 & 0.0365 & 5189.7736 & 13346.7021 & 115.5279 & 0.54 & 0.7882 \tabularnewline
25 & 0.0511 & 0.0548 & 0.0395 & 0.0405 & 26686.3403 & 16014.6298 & 126.5489 & 1.2244 & 0.8755 \tabularnewline
26 & 0.0543 & 0.087 & 0.0474 & 0.0489 & 72130.4804 & 25367.2715 & 159.2711 & 2.0131 & 1.0651 \tabularnewline
27 & 0.0569 & 0.118 & 0.0575 & 0.0598 & 142202.1609 & 42057.97 & 205.0804 & 2.8265 & 1.3167 \tabularnewline
28 & 0.0588 & 0.1383 & 0.0676 & 0.0709 & 204996.896 & 62425.3358 & 249.8506 & 3.3937 & 1.5763 \tabularnewline
29 & 0.0603 & 0.1684 & 0.0788 & 0.0835 & 326033.4777 & 91715.1293 & 302.8451 & 4.2798 & 1.8767 \tabularnewline
30 & 0.0619 & 0.233 & 0.0942 & 0.1015 & 733548.4689 & 155898.4633 & 394.8398 & 6.4196 & 2.331 \tabularnewline
31 & 0.0637 & 0.3043 & 0.1133 & 0.1249 & 1520604.8472 & 279962.68 & 529.115 & 9.2428 & 2.9593 \tabularnewline
32 & 0.0655 & 0.3638 & 0.1342 & 0.1515 & 2598063.1209 & 473137.7167 & 687.8501 & 12.0815 & 3.7195 \tabularnewline
33 & 0.0671 & 0.381 & 0.1532 & 0.1761 & 3012444.4265 & 668469.0021 & 817.5995 & 13.0093 & 4.4341 \tabularnewline
34 & 0.0687 & 0.3412 & 0.1666 & 0.1929 & 2132180.03 & 773019.7898 & 879.2154 & 10.9448 & 4.8992 \tabularnewline
35 & 0.0702 & 0.3581 & 0.1794 & 0.2091 & 2472802.3697 & 886338.6285 & 941.4556 & 11.7867 & 5.3583 \tabularnewline
36 & 0.0717 & 0.3711 & 0.1914 & 0.2245 & 2767033.3828 & 1003882.0506 & 1001.9391 & 12.4682 & 5.8027 \tabularnewline
37 & 0.0732 & 0.3777 & 0.2023 & 0.2387 & 2928735.356 & 1117108.7156 & 1056.9336 & 12.8273 & 6.2159 \tabularnewline
38 & 0.0747 & 0.3845 & 0.2124 & 0.2519 & 3102063.3954 & 1227383.9756 & 1107.8736 & 13.2014 & 6.604 \tabularnewline
39 & 0.0761 & 0.3902 & 0.2218 & 0.2641 & 3254896.4424 & 1334095.1581 & 1155.0304 & 13.5227 & 6.9681 \tabularnewline
40 & 0.0775 & 0.4027 & 0.2308 & 0.2762 & 3612868.1271 & 1448033.8065 & 1203.3428 & 14.247 & 7.3321 \tabularnewline
41 & 0.0789 & 0.4141 & 0.2396 & 0.2879 & 3969899.8679 & 1568122.6666 & 1252.247 & 14.9343 & 7.6941 \tabularnewline
42 & 0.0802 & 0.4339 & 0.2484 & 0.3 & 4669083.2386 & 1709075.4199 & 1307.3161 & 16.1962 & 8.0806 \tabularnewline
43 & 0.0816 & 0.4551 & 0.2574 & 0.3125 & 5545619.0804 & 1875881.666 & 1369.6283 & 17.6511 & 8.4967 \tabularnewline
44 & 0.0829 & 0.4558 & 0.2657 & 0.3241 & 5578402.0772 & 2030153.3498 & 1424.8345 & 17.7032 & 8.8803 \tabularnewline
\hline
\end{tabular}
%Source: https://freestatistics.org/blog/index.php?pk=299646&T=2

[TABLE]
[ROW][C]Univariate ARIMA Extrapolation Forecast Performance[/C][/ROW]
[ROW][C]time[/C][C]% S.E.[/C][C]PE[/C][C]MAPE[/C][C]sMAPE[/C][C]Sq.E[/C][C]MSE[/C][C]RMSE[/C][C]ScaledE[/C][C]MASE[/C][/ROW]
[ROW][C]21[/C][C]0.0333[/C][C]0.0247[/C][C]0.0247[/C][C]0.0251[/C][C]5077.3033[/C][C]0[/C][C]0[/C][C]0.5341[/C][C]0.5341[/C][/ROW]
[ROW][C]22[/C][C]0.0484[/C][C]0.0622[/C][C]0.0435[/C][C]0.0447[/C][C]34949.8454[/C][C]20013.5744[/C][C]141.4693[/C][C]1.4013[/C][C]0.9677[/C][/ROW]
[ROW][C]23[/C][C]0.0496[/C][C]0.0311[/C][C]0.0393[/C][C]0.0403[/C][C]8169.8862[/C][C]16065.6783[/C][C]126.7505[/C][C]0.6775[/C][C]0.8709[/C][/ROW]
[ROW][C]24[/C][C]0.05[/C][C]0.0249[/C][C]0.0357[/C][C]0.0365[/C][C]5189.7736[/C][C]13346.7021[/C][C]115.5279[/C][C]0.54[/C][C]0.7882[/C][/ROW]
[ROW][C]25[/C][C]0.0511[/C][C]0.0548[/C][C]0.0395[/C][C]0.0405[/C][C]26686.3403[/C][C]16014.6298[/C][C]126.5489[/C][C]1.2244[/C][C]0.8755[/C][/ROW]
[ROW][C]26[/C][C]0.0543[/C][C]0.087[/C][C]0.0474[/C][C]0.0489[/C][C]72130.4804[/C][C]25367.2715[/C][C]159.2711[/C][C]2.0131[/C][C]1.0651[/C][/ROW]
[ROW][C]27[/C][C]0.0569[/C][C]0.118[/C][C]0.0575[/C][C]0.0598[/C][C]142202.1609[/C][C]42057.97[/C][C]205.0804[/C][C]2.8265[/C][C]1.3167[/C][/ROW]
[ROW][C]28[/C][C]0.0588[/C][C]0.1383[/C][C]0.0676[/C][C]0.0709[/C][C]204996.896[/C][C]62425.3358[/C][C]249.8506[/C][C]3.3937[/C][C]1.5763[/C][/ROW]
[ROW][C]29[/C][C]0.0603[/C][C]0.1684[/C][C]0.0788[/C][C]0.0835[/C][C]326033.4777[/C][C]91715.1293[/C][C]302.8451[/C][C]4.2798[/C][C]1.8767[/C][/ROW]
[ROW][C]30[/C][C]0.0619[/C][C]0.233[/C][C]0.0942[/C][C]0.1015[/C][C]733548.4689[/C][C]155898.4633[/C][C]394.8398[/C][C]6.4196[/C][C]2.331[/C][/ROW]
[ROW][C]31[/C][C]0.0637[/C][C]0.3043[/C][C]0.1133[/C][C]0.1249[/C][C]1520604.8472[/C][C]279962.68[/C][C]529.115[/C][C]9.2428[/C][C]2.9593[/C][/ROW]
[ROW][C]32[/C][C]0.0655[/C][C]0.3638[/C][C]0.1342[/C][C]0.1515[/C][C]2598063.1209[/C][C]473137.7167[/C][C]687.8501[/C][C]12.0815[/C][C]3.7195[/C][/ROW]
[ROW][C]33[/C][C]0.0671[/C][C]0.381[/C][C]0.1532[/C][C]0.1761[/C][C]3012444.4265[/C][C]668469.0021[/C][C]817.5995[/C][C]13.0093[/C][C]4.4341[/C][/ROW]
[ROW][C]34[/C][C]0.0687[/C][C]0.3412[/C][C]0.1666[/C][C]0.1929[/C][C]2132180.03[/C][C]773019.7898[/C][C]879.2154[/C][C]10.9448[/C][C]4.8992[/C][/ROW]
[ROW][C]35[/C][C]0.0702[/C][C]0.3581[/C][C]0.1794[/C][C]0.2091[/C][C]2472802.3697[/C][C]886338.6285[/C][C]941.4556[/C][C]11.7867[/C][C]5.3583[/C][/ROW]
[ROW][C]36[/C][C]0.0717[/C][C]0.3711[/C][C]0.1914[/C][C]0.2245[/C][C]2767033.3828[/C][C]1003882.0506[/C][C]1001.9391[/C][C]12.4682[/C][C]5.8027[/C][/ROW]
[ROW][C]37[/C][C]0.0732[/C][C]0.3777[/C][C]0.2023[/C][C]0.2387[/C][C]2928735.356[/C][C]1117108.7156[/C][C]1056.9336[/C][C]12.8273[/C][C]6.2159[/C][/ROW]
[ROW][C]38[/C][C]0.0747[/C][C]0.3845[/C][C]0.2124[/C][C]0.2519[/C][C]3102063.3954[/C][C]1227383.9756[/C][C]1107.8736[/C][C]13.2014[/C][C]6.604[/C][/ROW]
[ROW][C]39[/C][C]0.0761[/C][C]0.3902[/C][C]0.2218[/C][C]0.2641[/C][C]3254896.4424[/C][C]1334095.1581[/C][C]1155.0304[/C][C]13.5227[/C][C]6.9681[/C][/ROW]
[ROW][C]40[/C][C]0.0775[/C][C]0.4027[/C][C]0.2308[/C][C]0.2762[/C][C]3612868.1271[/C][C]1448033.8065[/C][C]1203.3428[/C][C]14.247[/C][C]7.3321[/C][/ROW]
[ROW][C]41[/C][C]0.0789[/C][C]0.4141[/C][C]0.2396[/C][C]0.2879[/C][C]3969899.8679[/C][C]1568122.6666[/C][C]1252.247[/C][C]14.9343[/C][C]7.6941[/C][/ROW]
[ROW][C]42[/C][C]0.0802[/C][C]0.4339[/C][C]0.2484[/C][C]0.3[/C][C]4669083.2386[/C][C]1709075.4199[/C][C]1307.3161[/C][C]16.1962[/C][C]8.0806[/C][/ROW]
[ROW][C]43[/C][C]0.0816[/C][C]0.4551[/C][C]0.2574[/C][C]0.3125[/C][C]5545619.0804[/C][C]1875881.666[/C][C]1369.6283[/C][C]17.6511[/C][C]8.4967[/C][/ROW]
[ROW][C]44[/C][C]0.0829[/C][C]0.4558[/C][C]0.2657[/C][C]0.3241[/C][C]5578402.0772[/C][C]2030153.3498[/C][C]1424.8345[/C][C]17.7032[/C][C]8.8803[/C][/ROW]
[/TABLE]
Source: https://freestatistics.org/blog/index.php?pk=299646&T=2

Globally Unique Identifier (entire table): ba.freestatistics.org/blog/index.php?pk=299646&T=2

As an alternative you can also use a QR Code:  

The GUIDs for individual cells are displayed in the table below:

Univariate ARIMA Extrapolation Forecast Performance
time% S.E.PEMAPEsMAPESq.EMSERMSEScaledEMASE
210.03330.02470.02470.02515077.3033000.53410.5341
220.04840.06220.04350.044734949.845420013.5744141.46931.40130.9677
230.04960.03110.03930.04038169.886216065.6783126.75050.67750.8709
240.050.02490.03570.03655189.773613346.7021115.52790.540.7882
250.05110.05480.03950.040526686.340316014.6298126.54891.22440.8755
260.05430.0870.04740.048972130.480425367.2715159.27112.01311.0651
270.05690.1180.05750.0598142202.160942057.97205.08042.82651.3167
280.05880.13830.06760.0709204996.89662425.3358249.85063.39371.5763
290.06030.16840.07880.0835326033.477791715.1293302.84514.27981.8767
300.06190.2330.09420.1015733548.4689155898.4633394.83986.41962.331
310.06370.30430.11330.12491520604.8472279962.68529.1159.24282.9593
320.06550.36380.13420.15152598063.1209473137.7167687.850112.08153.7195
330.06710.3810.15320.17613012444.4265668469.0021817.599513.00934.4341
340.06870.34120.16660.19292132180.03773019.7898879.215410.94484.8992
350.07020.35810.17940.20912472802.3697886338.6285941.455611.78675.3583
360.07170.37110.19140.22452767033.38281003882.05061001.939112.46825.8027
370.07320.37770.20230.23872928735.3561117108.71561056.933612.82736.2159
380.07470.38450.21240.25193102063.39541227383.97561107.873613.20146.604
390.07610.39020.22180.26413254896.44241334095.15811155.030413.52276.9681
400.07750.40270.23080.27623612868.12711448033.80651203.342814.2477.3321
410.07890.41410.23960.28793969899.86791568122.66661252.24714.93437.6941
420.08020.43390.24840.34669083.23861709075.41991307.316116.19628.0806
430.08160.45510.25740.31255545619.08041875881.6661369.628317.65118.4967
440.08290.45580.26570.32415578402.07722030153.34981424.834517.70328.8803


Parameters (Session):
par1 = Default ; par2 = 1 ; par3 = 1 ; par4 = 0 ; par5 = 1 ; par6 = White Noise ; par7 = 0.95 ;
Parameters (R input):
par1 = 24 ; par2 = 1 ; par3 = 1 ; par4 = 0 ; par5 = 1 ; par6 = 3 ; par7 = 2 ; par8 = 0 ; par9 = 0 ; par10 = FALSE ;
R code (references can be found in the software module):
par10 <- 'FALSE'
par9 <- '0'
par8 <- '0'
par7 <- '2'
par6 <- '3'
par5 <- '1'
par4 <- '0'
par3 <- '1'
par2 <- '1'
par1 <- '4'
par1 <- as.numeric(par1) #cut off periods
par2 <- as.numeric(par2) #lambda
par3 <- as.numeric(par3) #degree of non-seasonal differencing
par4 <- as.numeric(par4) #degree of seasonal differencing
par5 <- as.numeric(par5) #seasonal period
par6 <- as.numeric(par6) #p
par7 <- as.numeric(par7) #q
par8 <- as.numeric(par8) #P
par9 <- as.numeric(par9) #Q
if (par10 == 'TRUE') par10 <- TRUE
if (par10 == 'FALSE') par10 <- FALSE
if (par2 == 0) x <- log(x)
if (par2 != 0) x <- x^par2
lx <- length(x)
first <- lx - 2*par1
nx <- lx - par1
nx1 <- nx + 1
fx <- lx - nx
if (fx < 1) {
fx <- par5*2
nx1 <- lx + fx - 1
first <- lx - 2*fx
}
first <- 1
if (fx < 3) fx <- round(lx/10,0)
(arima.out <- arima(x[1:nx], order=c(par6,par3,par7), seasonal=list(order=c(par8,par4,par9), period=par5), include.mean=par10, method='ML'))
(forecast <- predict(arima.out,fx))
(lb <- forecast$pred - 1.96 * forecast$se)
(ub <- forecast$pred + 1.96 * forecast$se)
if (par2 == 0) {
x <- exp(x)
forecast$pred <- exp(forecast$pred)
lb <- exp(lb)
ub <- exp(ub)
}
if (par2 != 0) {
x <- x^(1/par2)
forecast$pred <- forecast$pred^(1/par2)
lb <- lb^(1/par2)
ub <- ub^(1/par2)
}
if (par2 < 0) {
olb <- lb
lb <- ub
ub <- olb
}
(actandfor <- c(x[1:nx], forecast$pred))
(perc.se <- (ub-forecast$pred)/1.96/forecast$pred)
bitmap(file='test1.png')
opar <- par(mar=c(4,4,2,2),las=1)
ylim <- c( min(x[first:nx],lb), max(x[first:nx],ub))
plot(x,ylim=ylim,type='n',xlim=c(first,lx))
usr <- par('usr')
rect(usr[1],usr[3],nx+1,usr[4],border=NA,col='lemonchiffon')
rect(nx1,usr[3],usr[2],usr[4],border=NA,col='lavender')
abline(h= (-3:3)*2 , col ='gray', lty =3)
polygon( c(nx1:lx,lx:nx1), c(lb,rev(ub)), col = 'orange', lty=2,border=NA)
lines(nx1:lx, lb , lty=2)
lines(nx1:lx, ub , lty=2)
lines(x, lwd=2)
lines(nx1:lx, forecast$pred , lwd=2 , col ='white')
box()
par(opar)
dev.off()
prob.dec <- array(NA, dim=fx)
prob.sdec <- array(NA, dim=fx)
prob.ldec <- array(NA, dim=fx)
prob.pval <- array(NA, dim=fx)
perf.pe <- array(0, dim=fx)
perf.spe <- array(0, dim=fx)
perf.scalederr <- array(0, dim=fx)
perf.mase <- array(0, dim=fx)
perf.mase1 <- array(0, dim=fx)
perf.mape <- array(0, dim=fx)
perf.smape <- array(0, dim=fx)
perf.mape1 <- array(0, dim=fx)
perf.smape1 <- array(0,dim=fx)
perf.se <- array(0, dim=fx)
perf.mse <- array(0, dim=fx)
perf.mse1 <- array(0, dim=fx)
perf.rmse <- array(0, dim=fx)
perf.scaleddenom <- 0
for (i in 2:fx) {
perf.scaleddenom = perf.scaleddenom + abs(x[nx+i] - x[nx+i-1])
}
perf.scaleddenom = perf.scaleddenom / (fx-1)
for (i in 1:fx) {
locSD <- (ub[i] - forecast$pred[i]) / 1.96
perf.scalederr[i] = (x[nx+i] - forecast$pred[i]) / perf.scaleddenom
perf.pe[i] = (x[nx+i] - forecast$pred[i]) / x[nx+i]
perf.spe[i] = 2*(x[nx+i] - forecast$pred[i]) / (x[nx+i] + forecast$pred[i])
perf.se[i] = (x[nx+i] - forecast$pred[i])^2
prob.dec[i] = pnorm((x[nx+i-1] - forecast$pred[i]) / locSD)
prob.sdec[i] = pnorm((x[nx+i-par5] - forecast$pred[i]) / locSD)
prob.ldec[i] = pnorm((x[nx] - forecast$pred[i]) / locSD)
prob.pval[i] = pnorm(abs(x[nx+i] - forecast$pred[i]) / locSD)
}
perf.mape[1] = abs(perf.pe[1])
perf.smape[1] = abs(perf.spe[1])
perf.mape1[1] = perf.mape[1]
perf.smape1[1] = perf.smape[1]
perf.mse[1] = perf.se[1]
perf.mase[1] = abs(perf.scalederr[1])
perf.mase1[1] = perf.mase[1]
for (i in 2:fx) {
perf.mape[i] = perf.mape[i-1] + abs(perf.pe[i])
perf.mape1[i] = perf.mape[i] / i
perf.smape[i] = perf.smape[i-1] + abs(perf.spe[i])
perf.smape1[i] = perf.smape[i] / i
perf.mse[i] = perf.mse[i-1] + perf.se[i]
perf.mse1[i] = perf.mse[i] / i
perf.mase[i] = perf.mase[i-1] + abs(perf.scalederr[i])
perf.mase1[i] = perf.mase[i] / i
}
perf.rmse = sqrt(perf.mse1)
bitmap(file='test2.png')
plot(forecast$pred, pch=19, type='b',main='ARIMA Extrapolation Forecast', ylab='Forecast and 95% CI', xlab='time',ylim=c(min(lb),max(ub)))
dum <- forecast$pred
dum[1:par1] <- x[(nx+1):lx]
lines(dum, lty=1)
lines(ub,lty=3)
lines(lb,lty=3)
dev.off()
load(file='createtable')
a<-table.start()
a<-table.row.start(a)
a<-table.element(a,'Univariate ARIMA Extrapolation Forecast',9,TRUE)
a<-table.row.end(a)
a<-table.row.start(a)
a<-table.element(a,'time',1,header=TRUE)
a<-table.element(a,'Y[t]',1,header=TRUE)
a<-table.element(a,'F[t]',1,header=TRUE)
a<-table.element(a,'95% LB',1,header=TRUE)
a<-table.element(a,'95% UB',1,header=TRUE)
a<-table.element(a,'p-value
(H0: Y[t] = F[t])',1,header=TRUE)
a<-table.element(a,'P(F[t]>Y[t-1])',1,header=TRUE)
a<-table.element(a,'P(F[t]>Y[t-s])',1,header=TRUE)
mylab <- paste('P(F[t]>Y[',nx,sep='')
mylab <- paste(mylab,'])',sep='')
a<-table.element(a,mylab,1,header=TRUE)
a<-table.row.end(a)
for (i in (nx-par5):nx) {
a<-table.row.start(a)
a<-table.element(a,i,header=TRUE)
a<-table.element(a,x[i])
a<-table.element(a,'-')
a<-table.row.end(a)
}
for (i in 1:fx) {
a<-table.row.start(a)
a<-table.element(a,nx+i,header=TRUE)
a<-table.element(a,round(x[nx+i],4))
a<-table.element(a,round(forecast$pred[i],4))
a<-table.element(a,round(lb[i],4))
a<-table.element(a,round(ub[i],4))
a<-table.element(a,round((1-prob.pval[i]),4))
a<-table.element(a,round((1-prob.dec[i]),4))
a<-table.element(a,round((1-prob.sdec[i]),4))
a<-table.element(a,round((1-prob.ldec[i]),4))
a<-table.row.end(a)
}
a<-table.end(a)
table.save(a,file='mytable.tab')
a<-table.start()
a<-table.row.start(a)
a<-table.element(a,'Univariate ARIMA Extrapolation Forecast Performance',10,TRUE)
a<-table.row.end(a)
a<-table.row.start(a)
a<-table.element(a,'time',1,header=TRUE)
a<-table.element(a,'% S.E.',1,header=TRUE)
a<-table.element(a,'PE',1,header=TRUE)
a<-table.element(a,'MAPE',1,header=TRUE)
a<-table.element(a,'sMAPE',1,header=TRUE)
a<-table.element(a,'Sq.E',1,header=TRUE)
a<-table.element(a,'MSE',1,header=TRUE)
a<-table.element(a,'RMSE',1,header=TRUE)
a<-table.element(a,'ScaledE',1,header=TRUE)
a<-table.element(a,'MASE',1,header=TRUE)
a<-table.row.end(a)
for (i in 1:fx) {
a<-table.row.start(a)
a<-table.element(a,nx+i,header=TRUE)
a<-table.element(a,round(perc.se[i],4))
a<-table.element(a,round(perf.pe[i],4))
a<-table.element(a,round(perf.mape1[i],4))
a<-table.element(a,round(perf.smape1[i],4))
a<-table.element(a,round(perf.se[i],4))
a<-table.element(a,round(perf.mse1[i],4))
a<-table.element(a,round(perf.rmse[i],4))
a<-table.element(a,round(perf.scalederr[i],4))
a<-table.element(a,round(perf.mase1[i],4))
a<-table.row.end(a)
}
a<-table.end(a)
table.save(a,file='mytable1.tab')