Free Statistics

of Irreproducible Research!

Author's title

Author*The author of this computation has been verified*
R Software Modulerwasp_structuraltimeseries.wasp
Title produced by softwareStructural Time Series Models
Date of computationTue, 13 Dec 2016 20:45:56 +0100
Cite this page as followsStatistical Computations at FreeStatistics.org, Office for Research Development and Education, URL https://freestatistics.org/blog/index.php?v=date/2016/Dec/13/t1481658670dy6wlkzsvrnmfja.htm/, Retrieved Fri, 01 Nov 2024 03:28:36 +0000
Statistical Computations at FreeStatistics.org, Office for Research Development and Education, URL https://freestatistics.org/blog/index.php?pk=299213, Retrieved Fri, 01 Nov 2024 03:28:36 +0000
QR Codes:

Original text written by user:
IsPrivate?No (this computation is public)
User-defined keywords
Estimated Impact97
Family? (F = Feedback message, R = changed R code, M = changed R Module, P = changed Parameters, D = changed Data)
-       [Structural Time Series Models] [structural time s...] [2016-12-13 19:45:56] [130d73899007e5ff8a4f636b9bcfb397] [Current]
Feedback Forum

Post a new message
Dataseries X:
4786.55
5403.6
6042.4
5824.45
5349.4
5428.2
4906.65
4965.9
4842.3
4638.55
4542.2
4335.15
4445
4750.5
5081.2
5476.35
5359
5358.5
5646.5
5878
6270
6601.5
6792
6871.5
6726.5
6770.5
6611
6711
6089.5
5858.5
5673.5
5531.5
5081.5
5057.5
4979
5003.5


Summary of computational transaction
Raw Input view raw input (R code)
Raw Outputview raw output of R engine
Computing time3 seconds
R ServerBig Analytics Cloud Computing Center

\begin{tabular}{lllllllll}
\hline
Summary of computational transaction \tabularnewline
Raw Input view raw input (R code)  \tabularnewline
Raw Outputview raw output of R engine  \tabularnewline
Computing time3 seconds \tabularnewline
R ServerBig Analytics Cloud Computing Center \tabularnewline
\hline
\end{tabular}
%Source: https://freestatistics.org/blog/index.php?pk=299213&T=0

[TABLE]
[ROW]
Summary of computational transaction[/C][/ROW] [ROW]Raw Input[/C] view raw input (R code) [/C][/ROW] [ROW]Raw Output[/C]view raw output of R engine [/C][/ROW] [ROW]Computing time[/C]3 seconds[/C][/ROW] [ROW]R Server[/C]Big Analytics Cloud Computing Center[/C][/ROW] [/TABLE] Source: https://freestatistics.org/blog/index.php?pk=299213&T=0

Globally Unique Identifier (entire table): ba.freestatistics.org/blog/index.php?pk=299213&T=0

As an alternative you can also use a QR Code:  

The GUIDs for individual cells are displayed in the table below:

Summary of computational transaction
Raw Input view raw input (R code)
Raw Outputview raw output of R engine
Computing time3 seconds
R ServerBig Analytics Cloud Computing Center


Structural Time Series Model -- Interpolation
tObservedLevelSlopeSeasonalStand. Residuals
14786.554786.55000
25403.65372.4830855395449.764694053754131.11691446046041.41101692684646
36042.46011.5806098862141.30684190028730.81939011380372.2083461148263
45824.455793.4856246760369.090082389981330.9643753239735-1.31001636129336
55349.45318.26633787182-55.576575209361431.1336621281786-1.94899402528461
65428.25397.09788250674-22.594200958970831.10211749325680.476180125882804
74906.654875.46057897488-149.64683343898531.1894210251195-1.75731209506859
84965.94934.73763754038-95.394696275263331.1623624596220.733223483836959
94842.34811.13494303132-102.79792129403531.1650569686765-0.0988147282883999
104638.554607.37784473346-129.44717035892531.1721552665425-0.353315940889223
114542.24511.02955569317-120.68328990829431.17044430682730.115770729712594
124335.154303.97627515063-143.59048403978331.1737248493684-0.302012201237875
1344454609.42713478422-28.5850321949979-164.4271347842221.82180689269923
144750.54732.172788874089.6247569005089518.32721112591880.442203585931415
155081.25063.2661944588795.169696821373617.93380554112561.12183691292428
165476.355458.68594034952174.99932563858217.66405965048331.04835724952578
1753595341.1429692165197.250262666154217.857030783493-1.02180752250961
185358.55340.5956006014771.262975351222417.9043993985271-0.341674138190012
195646.55628.67271183619128.87262330452417.82728816381020.757603422609106
2058785860.19952051205156.14868883840617.80047948794770.358740115484806
2162706252.24475675508218.82930788088417.75524324491610.824440402514834
226601.56583.76062393998248.77216695323217.73937606002420.393853063810385
2367926774.25459843778233.28626028377217.7454015622199-0.203697487116988
246871.56853.74292243712192.41770173573617.7570775628787-0.537579508563827
256726.56941.39243766314164.99788435184-214.892437663142-0.39543015402644
266770.56755.9935876595474.912088154205914.5064123404615-1.10114081554284
2766116596.3037253717512.496860059943914.6962746282452-0.819130672011372
2867116696.3557439361635.774860430861314.64425606384440.305820975931558
296089.56074.56890436307-138.99219546870114.9310956369281-2.29735761785166
305858.55843.53942521445-163.45038301400114.9605747855532-0.321607895486815
315673.55658.53435588993-169.17805666075814.9656441100699-0.0753273367764646
325531.55516.53905008455-161.95494583251414.96094991544890.0950030174276552
335081.55066.50252075726-238.50554628484514.9974792427429-1.00689138620071
345057.55042.52249460761-181.49999338754714.97750539238860.749829384558918
3549794964.02953674249-154.12773137034414.97046325751050.360049371948285
365003.54988.53850402608-106.65769104062414.96149597391910.624416319933543

\begin{tabular}{lllllllll}
\hline
Structural Time Series Model -- Interpolation \tabularnewline
t & Observed & Level & Slope & Seasonal & Stand. Residuals \tabularnewline
1 & 4786.55 & 4786.55 & 0 & 0 & 0 \tabularnewline
2 & 5403.6 & 5372.48308553954 & 49.7646940537541 & 31.1169144604604 & 1.41101692684646 \tabularnewline
3 & 6042.4 & 6011.5806098862 & 141.306841900287 & 30.8193901138037 & 2.2083461148263 \tabularnewline
4 & 5824.45 & 5793.48562467603 & 69.0900823899813 & 30.9643753239735 & -1.31001636129336 \tabularnewline
5 & 5349.4 & 5318.26633787182 & -55.5765752093614 & 31.1336621281786 & -1.94899402528461 \tabularnewline
6 & 5428.2 & 5397.09788250674 & -22.5942009589708 & 31.1021174932568 & 0.476180125882804 \tabularnewline
7 & 4906.65 & 4875.46057897488 & -149.646833438985 & 31.1894210251195 & -1.75731209506859 \tabularnewline
8 & 4965.9 & 4934.73763754038 & -95.3946962752633 & 31.162362459622 & 0.733223483836959 \tabularnewline
9 & 4842.3 & 4811.13494303132 & -102.797921294035 & 31.1650569686765 & -0.0988147282883999 \tabularnewline
10 & 4638.55 & 4607.37784473346 & -129.447170358925 & 31.1721552665425 & -0.353315940889223 \tabularnewline
11 & 4542.2 & 4511.02955569317 & -120.683289908294 & 31.1704443068273 & 0.115770729712594 \tabularnewline
12 & 4335.15 & 4303.97627515063 & -143.590484039783 & 31.1737248493684 & -0.302012201237875 \tabularnewline
13 & 4445 & 4609.42713478422 & -28.5850321949979 & -164.427134784222 & 1.82180689269923 \tabularnewline
14 & 4750.5 & 4732.17278887408 & 9.62475690050895 & 18.3272111259188 & 0.442203585931415 \tabularnewline
15 & 5081.2 & 5063.26619445887 & 95.1696968213736 & 17.9338055411256 & 1.12183691292428 \tabularnewline
16 & 5476.35 & 5458.68594034952 & 174.999325638582 & 17.6640596504833 & 1.04835724952578 \tabularnewline
17 & 5359 & 5341.14296921651 & 97.2502626661542 & 17.857030783493 & -1.02180752250961 \tabularnewline
18 & 5358.5 & 5340.59560060147 & 71.2629753512224 & 17.9043993985271 & -0.341674138190012 \tabularnewline
19 & 5646.5 & 5628.67271183619 & 128.872623304524 & 17.8272881638102 & 0.757603422609106 \tabularnewline
20 & 5878 & 5860.19952051205 & 156.148688838406 & 17.8004794879477 & 0.358740115484806 \tabularnewline
21 & 6270 & 6252.24475675508 & 218.829307880884 & 17.7552432449161 & 0.824440402514834 \tabularnewline
22 & 6601.5 & 6583.76062393998 & 248.772166953232 & 17.7393760600242 & 0.393853063810385 \tabularnewline
23 & 6792 & 6774.25459843778 & 233.286260283772 & 17.7454015622199 & -0.203697487116988 \tabularnewline
24 & 6871.5 & 6853.74292243712 & 192.417701735736 & 17.7570775628787 & -0.537579508563827 \tabularnewline
25 & 6726.5 & 6941.39243766314 & 164.99788435184 & -214.892437663142 & -0.39543015402644 \tabularnewline
26 & 6770.5 & 6755.99358765954 & 74.9120881542059 & 14.5064123404615 & -1.10114081554284 \tabularnewline
27 & 6611 & 6596.30372537175 & 12.4968600599439 & 14.6962746282452 & -0.819130672011372 \tabularnewline
28 & 6711 & 6696.35574393616 & 35.7748604308613 & 14.6442560638444 & 0.305820975931558 \tabularnewline
29 & 6089.5 & 6074.56890436307 & -138.992195468701 & 14.9310956369281 & -2.29735761785166 \tabularnewline
30 & 5858.5 & 5843.53942521445 & -163.450383014001 & 14.9605747855532 & -0.321607895486815 \tabularnewline
31 & 5673.5 & 5658.53435588993 & -169.178056660758 & 14.9656441100699 & -0.0753273367764646 \tabularnewline
32 & 5531.5 & 5516.53905008455 & -161.954945832514 & 14.9609499154489 & 0.0950030174276552 \tabularnewline
33 & 5081.5 & 5066.50252075726 & -238.505546284845 & 14.9974792427429 & -1.00689138620071 \tabularnewline
34 & 5057.5 & 5042.52249460761 & -181.499993387547 & 14.9775053923886 & 0.749829384558918 \tabularnewline
35 & 4979 & 4964.02953674249 & -154.127731370344 & 14.9704632575105 & 0.360049371948285 \tabularnewline
36 & 5003.5 & 4988.53850402608 & -106.657691040624 & 14.9614959739191 & 0.624416319933543 \tabularnewline
\hline
\end{tabular}
%Source: https://freestatistics.org/blog/index.php?pk=299213&T=1

[TABLE]
[ROW][C]Structural Time Series Model -- Interpolation[/C][/ROW]
[ROW][C]t[/C][C]Observed[/C][C]Level[/C][C]Slope[/C][C]Seasonal[/C][C]Stand. Residuals[/C][/ROW]
[ROW][C]1[/C][C]4786.55[/C][C]4786.55[/C][C]0[/C][C]0[/C][C]0[/C][/ROW]
[ROW][C]2[/C][C]5403.6[/C][C]5372.48308553954[/C][C]49.7646940537541[/C][C]31.1169144604604[/C][C]1.41101692684646[/C][/ROW]
[ROW][C]3[/C][C]6042.4[/C][C]6011.5806098862[/C][C]141.306841900287[/C][C]30.8193901138037[/C][C]2.2083461148263[/C][/ROW]
[ROW][C]4[/C][C]5824.45[/C][C]5793.48562467603[/C][C]69.0900823899813[/C][C]30.9643753239735[/C][C]-1.31001636129336[/C][/ROW]
[ROW][C]5[/C][C]5349.4[/C][C]5318.26633787182[/C][C]-55.5765752093614[/C][C]31.1336621281786[/C][C]-1.94899402528461[/C][/ROW]
[ROW][C]6[/C][C]5428.2[/C][C]5397.09788250674[/C][C]-22.5942009589708[/C][C]31.1021174932568[/C][C]0.476180125882804[/C][/ROW]
[ROW][C]7[/C][C]4906.65[/C][C]4875.46057897488[/C][C]-149.646833438985[/C][C]31.1894210251195[/C][C]-1.75731209506859[/C][/ROW]
[ROW][C]8[/C][C]4965.9[/C][C]4934.73763754038[/C][C]-95.3946962752633[/C][C]31.162362459622[/C][C]0.733223483836959[/C][/ROW]
[ROW][C]9[/C][C]4842.3[/C][C]4811.13494303132[/C][C]-102.797921294035[/C][C]31.1650569686765[/C][C]-0.0988147282883999[/C][/ROW]
[ROW][C]10[/C][C]4638.55[/C][C]4607.37784473346[/C][C]-129.447170358925[/C][C]31.1721552665425[/C][C]-0.353315940889223[/C][/ROW]
[ROW][C]11[/C][C]4542.2[/C][C]4511.02955569317[/C][C]-120.683289908294[/C][C]31.1704443068273[/C][C]0.115770729712594[/C][/ROW]
[ROW][C]12[/C][C]4335.15[/C][C]4303.97627515063[/C][C]-143.590484039783[/C][C]31.1737248493684[/C][C]-0.302012201237875[/C][/ROW]
[ROW][C]13[/C][C]4445[/C][C]4609.42713478422[/C][C]-28.5850321949979[/C][C]-164.427134784222[/C][C]1.82180689269923[/C][/ROW]
[ROW][C]14[/C][C]4750.5[/C][C]4732.17278887408[/C][C]9.62475690050895[/C][C]18.3272111259188[/C][C]0.442203585931415[/C][/ROW]
[ROW][C]15[/C][C]5081.2[/C][C]5063.26619445887[/C][C]95.1696968213736[/C][C]17.9338055411256[/C][C]1.12183691292428[/C][/ROW]
[ROW][C]16[/C][C]5476.35[/C][C]5458.68594034952[/C][C]174.999325638582[/C][C]17.6640596504833[/C][C]1.04835724952578[/C][/ROW]
[ROW][C]17[/C][C]5359[/C][C]5341.14296921651[/C][C]97.2502626661542[/C][C]17.857030783493[/C][C]-1.02180752250961[/C][/ROW]
[ROW][C]18[/C][C]5358.5[/C][C]5340.59560060147[/C][C]71.2629753512224[/C][C]17.9043993985271[/C][C]-0.341674138190012[/C][/ROW]
[ROW][C]19[/C][C]5646.5[/C][C]5628.67271183619[/C][C]128.872623304524[/C][C]17.8272881638102[/C][C]0.757603422609106[/C][/ROW]
[ROW][C]20[/C][C]5878[/C][C]5860.19952051205[/C][C]156.148688838406[/C][C]17.8004794879477[/C][C]0.358740115484806[/C][/ROW]
[ROW][C]21[/C][C]6270[/C][C]6252.24475675508[/C][C]218.829307880884[/C][C]17.7552432449161[/C][C]0.824440402514834[/C][/ROW]
[ROW][C]22[/C][C]6601.5[/C][C]6583.76062393998[/C][C]248.772166953232[/C][C]17.7393760600242[/C][C]0.393853063810385[/C][/ROW]
[ROW][C]23[/C][C]6792[/C][C]6774.25459843778[/C][C]233.286260283772[/C][C]17.7454015622199[/C][C]-0.203697487116988[/C][/ROW]
[ROW][C]24[/C][C]6871.5[/C][C]6853.74292243712[/C][C]192.417701735736[/C][C]17.7570775628787[/C][C]-0.537579508563827[/C][/ROW]
[ROW][C]25[/C][C]6726.5[/C][C]6941.39243766314[/C][C]164.99788435184[/C][C]-214.892437663142[/C][C]-0.39543015402644[/C][/ROW]
[ROW][C]26[/C][C]6770.5[/C][C]6755.99358765954[/C][C]74.9120881542059[/C][C]14.5064123404615[/C][C]-1.10114081554284[/C][/ROW]
[ROW][C]27[/C][C]6611[/C][C]6596.30372537175[/C][C]12.4968600599439[/C][C]14.6962746282452[/C][C]-0.819130672011372[/C][/ROW]
[ROW][C]28[/C][C]6711[/C][C]6696.35574393616[/C][C]35.7748604308613[/C][C]14.6442560638444[/C][C]0.305820975931558[/C][/ROW]
[ROW][C]29[/C][C]6089.5[/C][C]6074.56890436307[/C][C]-138.992195468701[/C][C]14.9310956369281[/C][C]-2.29735761785166[/C][/ROW]
[ROW][C]30[/C][C]5858.5[/C][C]5843.53942521445[/C][C]-163.450383014001[/C][C]14.9605747855532[/C][C]-0.321607895486815[/C][/ROW]
[ROW][C]31[/C][C]5673.5[/C][C]5658.53435588993[/C][C]-169.178056660758[/C][C]14.9656441100699[/C][C]-0.0753273367764646[/C][/ROW]
[ROW][C]32[/C][C]5531.5[/C][C]5516.53905008455[/C][C]-161.954945832514[/C][C]14.9609499154489[/C][C]0.0950030174276552[/C][/ROW]
[ROW][C]33[/C][C]5081.5[/C][C]5066.50252075726[/C][C]-238.505546284845[/C][C]14.9974792427429[/C][C]-1.00689138620071[/C][/ROW]
[ROW][C]34[/C][C]5057.5[/C][C]5042.52249460761[/C][C]-181.499993387547[/C][C]14.9775053923886[/C][C]0.749829384558918[/C][/ROW]
[ROW][C]35[/C][C]4979[/C][C]4964.02953674249[/C][C]-154.127731370344[/C][C]14.9704632575105[/C][C]0.360049371948285[/C][/ROW]
[ROW][C]36[/C][C]5003.5[/C][C]4988.53850402608[/C][C]-106.657691040624[/C][C]14.9614959739191[/C][C]0.624416319933543[/C][/ROW]
[/TABLE]
Source: https://freestatistics.org/blog/index.php?pk=299213&T=1

Globally Unique Identifier (entire table): ba.freestatistics.org/blog/index.php?pk=299213&T=1

As an alternative you can also use a QR Code:  

The GUIDs for individual cells are displayed in the table below:

Structural Time Series Model -- Interpolation
tObservedLevelSlopeSeasonalStand. Residuals
14786.554786.55000
25403.65372.4830855395449.764694053754131.11691446046041.41101692684646
36042.46011.5806098862141.30684190028730.81939011380372.2083461148263
45824.455793.4856246760369.090082389981330.9643753239735-1.31001636129336
55349.45318.26633787182-55.576575209361431.1336621281786-1.94899402528461
65428.25397.09788250674-22.594200958970831.10211749325680.476180125882804
74906.654875.46057897488-149.64683343898531.1894210251195-1.75731209506859
84965.94934.73763754038-95.394696275263331.1623624596220.733223483836959
94842.34811.13494303132-102.79792129403531.1650569686765-0.0988147282883999
104638.554607.37784473346-129.44717035892531.1721552665425-0.353315940889223
114542.24511.02955569317-120.68328990829431.17044430682730.115770729712594
124335.154303.97627515063-143.59048403978331.1737248493684-0.302012201237875
1344454609.42713478422-28.5850321949979-164.4271347842221.82180689269923
144750.54732.172788874089.6247569005089518.32721112591880.442203585931415
155081.25063.2661944588795.169696821373617.93380554112561.12183691292428
165476.355458.68594034952174.99932563858217.66405965048331.04835724952578
1753595341.1429692165197.250262666154217.857030783493-1.02180752250961
185358.55340.5956006014771.262975351222417.9043993985271-0.341674138190012
195646.55628.67271183619128.87262330452417.82728816381020.757603422609106
2058785860.19952051205156.14868883840617.80047948794770.358740115484806
2162706252.24475675508218.82930788088417.75524324491610.824440402514834
226601.56583.76062393998248.77216695323217.73937606002420.393853063810385
2367926774.25459843778233.28626028377217.7454015622199-0.203697487116988
246871.56853.74292243712192.41770173573617.7570775628787-0.537579508563827
256726.56941.39243766314164.99788435184-214.892437663142-0.39543015402644
266770.56755.9935876595474.912088154205914.5064123404615-1.10114081554284
2766116596.3037253717512.496860059943914.6962746282452-0.819130672011372
2867116696.3557439361635.774860430861314.64425606384440.305820975931558
296089.56074.56890436307-138.99219546870114.9310956369281-2.29735761785166
305858.55843.53942521445-163.45038301400114.9605747855532-0.321607895486815
315673.55658.53435588993-169.17805666075814.9656441100699-0.0753273367764646
325531.55516.53905008455-161.95494583251414.96094991544890.0950030174276552
335081.55066.50252075726-238.50554628484514.9974792427429-1.00689138620071
345057.55042.52249460761-181.49999338754714.97750539238860.749829384558918
3549794964.02953674249-154.12773137034414.97046325751050.360049371948285
365003.54988.53850402608-106.65769104062414.96149597391910.624416319933543


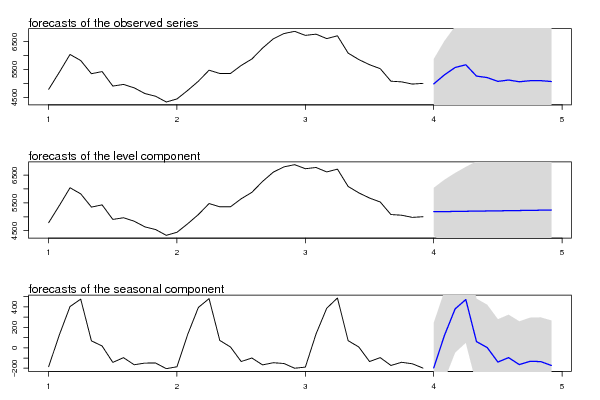
Structural Time Series Model -- Extrapolation
tObservedLevelSeasonal
14984.500489948165181.88373164735-197.383241699196
25307.853443303935187.36215911544120.49128418849
35573.574697438215192.84058658353380.734110854688
45671.064803127135198.31901405161472.745789075522
55264.645204397635203.797441519760.8477628779243
65211.762219331485209.275868987792.48635034368863
75075.309579923065214.75429645587-139.444716532818
85124.161387064895220.23272392396-96.0713368590671
95061.435431706565225.71115139205-164.275719685486
105098.748899287075231.18957886014-132.440679573063
115101.88370751685236.66800632822-134.784298811417
125069.241129617045242.14643379631-172.905304179266

\begin{tabular}{lllllllll}
\hline
Structural Time Series Model -- Extrapolation \tabularnewline
t & Observed & Level & Seasonal \tabularnewline
1 & 4984.50048994816 & 5181.88373164735 & -197.383241699196 \tabularnewline
2 & 5307.85344330393 & 5187.36215911544 & 120.49128418849 \tabularnewline
3 & 5573.57469743821 & 5192.84058658353 & 380.734110854688 \tabularnewline
4 & 5671.06480312713 & 5198.31901405161 & 472.745789075522 \tabularnewline
5 & 5264.64520439763 & 5203.7974415197 & 60.8477628779243 \tabularnewline
6 & 5211.76221933148 & 5209.27586898779 & 2.48635034368863 \tabularnewline
7 & 5075.30957992306 & 5214.75429645587 & -139.444716532818 \tabularnewline
8 & 5124.16138706489 & 5220.23272392396 & -96.0713368590671 \tabularnewline
9 & 5061.43543170656 & 5225.71115139205 & -164.275719685486 \tabularnewline
10 & 5098.74889928707 & 5231.18957886014 & -132.440679573063 \tabularnewline
11 & 5101.8837075168 & 5236.66800632822 & -134.784298811417 \tabularnewline
12 & 5069.24112961704 & 5242.14643379631 & -172.905304179266 \tabularnewline
\hline
\end{tabular}
%Source: https://freestatistics.org/blog/index.php?pk=299213&T=2

[TABLE]
[ROW][C]Structural Time Series Model -- Extrapolation[/C][/ROW]
[ROW][C]t[/C][C]Observed[/C][C]Level[/C][C]Seasonal[/C][/ROW]
[ROW][C]1[/C][C]4984.50048994816[/C][C]5181.88373164735[/C][C]-197.383241699196[/C][/ROW]
[ROW][C]2[/C][C]5307.85344330393[/C][C]5187.36215911544[/C][C]120.49128418849[/C][/ROW]
[ROW][C]3[/C][C]5573.57469743821[/C][C]5192.84058658353[/C][C]380.734110854688[/C][/ROW]
[ROW][C]4[/C][C]5671.06480312713[/C][C]5198.31901405161[/C][C]472.745789075522[/C][/ROW]
[ROW][C]5[/C][C]5264.64520439763[/C][C]5203.7974415197[/C][C]60.8477628779243[/C][/ROW]
[ROW][C]6[/C][C]5211.76221933148[/C][C]5209.27586898779[/C][C]2.48635034368863[/C][/ROW]
[ROW][C]7[/C][C]5075.30957992306[/C][C]5214.75429645587[/C][C]-139.444716532818[/C][/ROW]
[ROW][C]8[/C][C]5124.16138706489[/C][C]5220.23272392396[/C][C]-96.0713368590671[/C][/ROW]
[ROW][C]9[/C][C]5061.43543170656[/C][C]5225.71115139205[/C][C]-164.275719685486[/C][/ROW]
[ROW][C]10[/C][C]5098.74889928707[/C][C]5231.18957886014[/C][C]-132.440679573063[/C][/ROW]
[ROW][C]11[/C][C]5101.8837075168[/C][C]5236.66800632822[/C][C]-134.784298811417[/C][/ROW]
[ROW][C]12[/C][C]5069.24112961704[/C][C]5242.14643379631[/C][C]-172.905304179266[/C][/ROW]
[/TABLE]
Source: https://freestatistics.org/blog/index.php?pk=299213&T=2

Globally Unique Identifier (entire table): ba.freestatistics.org/blog/index.php?pk=299213&T=2

As an alternative you can also use a QR Code:  

The GUIDs for individual cells are displayed in the table below:

Structural Time Series Model -- Extrapolation
tObservedLevelSeasonal
14984.500489948165181.88373164735-197.383241699196
25307.853443303935187.36215911544120.49128418849
35573.574697438215192.84058658353380.734110854688
45671.064803127135198.31901405161472.745789075522
55264.645204397635203.797441519760.8477628779243
65211.762219331485209.275868987792.48635034368863
75075.309579923065214.75429645587-139.444716532818
85124.161387064895220.23272392396-96.0713368590671
95061.435431706565225.71115139205-164.275719685486
105098.748899287075231.18957886014-132.440679573063
115101.88370751685236.66800632822-134.784298811417
125069.241129617045242.14643379631-172.905304179266


Parameters (Session):
par1 = 12 ; par2 = 12 ; par3 = BFGS ;
Parameters (R input):
par1 = 12 ; par2 = 12 ; par3 = BFGS ;
R code (references can be found in the software module):
require('stsm')
require('stsm.class')
require('KFKSDS')
par1 <- as.numeric(par1)
par2 <- as.numeric(par2)
nx <- length(x)
x <- ts(x,frequency=par1)
m <- StructTS(x,type='BSM')
print(m$coef)
print(m$fitted)
print(m$resid)
mylevel <- as.numeric(m$fitted[,'level'])
myslope <- as.numeric(m$fitted[,'slope'])
myseas <- as.numeric(m$fitted[,'sea'])
myresid <- as.numeric(m$resid)
myfit <- mylevel+myseas
mm <- stsm.model(model = 'BSM', y = x, transPars = 'StructTS')
fit2 <- stsmFit(mm, stsm.method = 'maxlik.td.optim', method = par3, KF.args = list(P0cov = TRUE))
(fit2.comps <- tsSmooth(fit2, P0cov = FALSE)$states)
m2 <- set.pars(mm, pmax(fit2$par, .Machine$double.eps))
(ss <- char2numeric(m2))
(pred <- predict(ss, x, n.ahead = par2))
mylagmax <- nx/2
bitmap(file='test2.png')
op <- par(mfrow = c(2,2))
acf(as.numeric(x),lag.max = mylagmax,main='Observed')
acf(mylevel,na.action=na.pass,lag.max = mylagmax,main='Level')
acf(myseas,na.action=na.pass,lag.max = mylagmax,main='Seasonal')
acf(myresid,na.action=na.pass,lag.max = mylagmax,main='Standardized Residals')
par(op)
dev.off()
bitmap(file='test3.png')
op <- par(mfrow = c(2,2))
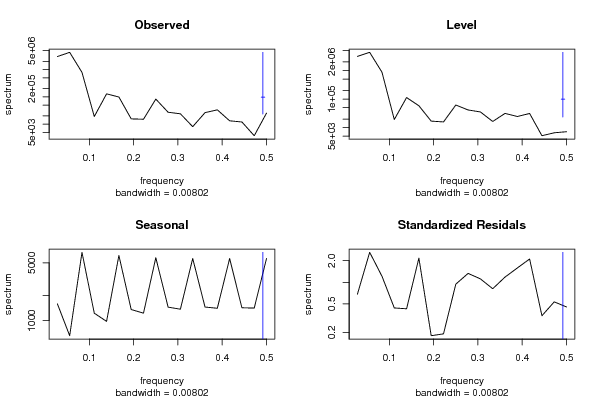
spectrum(as.numeric(x),main='Observed')
spectrum(mylevel,main='Level')
spectrum(myseas,main='Seasonal')
spectrum(myresid,main='Standardized Residals')
par(op)
dev.off()
bitmap(file='test4.png')
op <- par(mfrow = c(2,2))
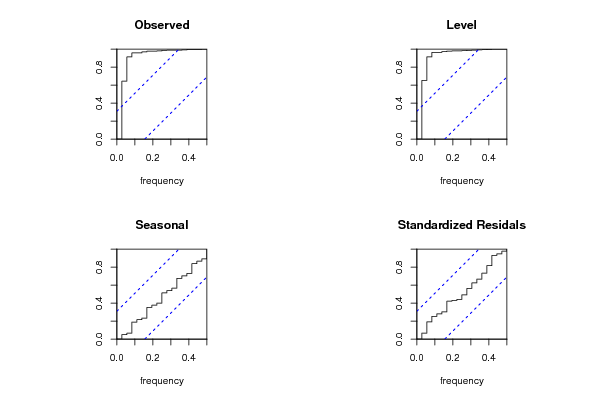
cpgram(as.numeric(x),main='Observed')
cpgram(mylevel,main='Level')
cpgram(myseas,main='Seasonal')
cpgram(myresid,main='Standardized Residals')
par(op)
dev.off()
bitmap(file='test1.png')
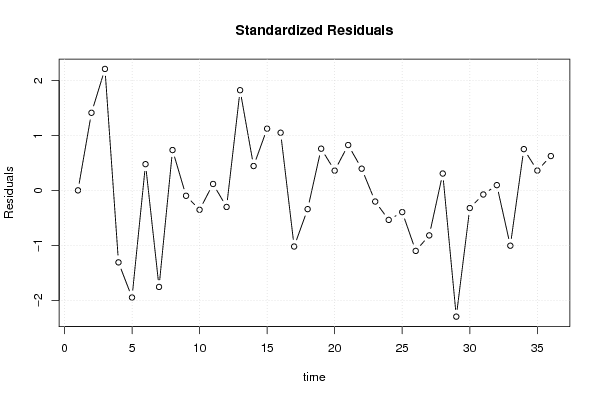
plot(as.numeric(m$resid),main='Standardized Residuals',ylab='Residuals',xlab='time',type='b')
grid()
dev.off()
bitmap(file='test5.png')
op <- par(mfrow = c(2,2))
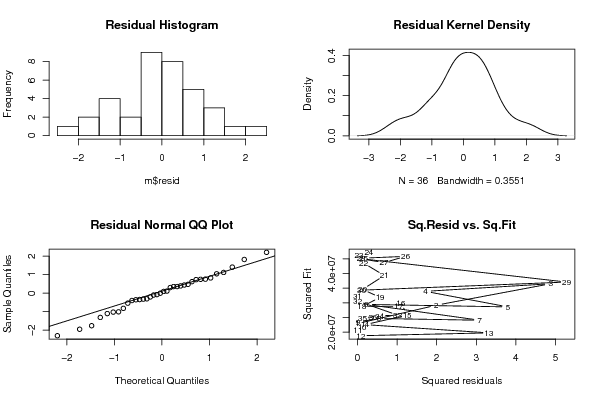
hist(m$resid,main='Residual Histogram')
plot(density(m$resid),main='Residual Kernel Density')
qqnorm(m$resid,main='Residual Normal QQ Plot')
qqline(m$resid)
plot(m$resid^2, myfit^2,main='Sq.Resid vs. Sq.Fit',xlab='Squared residuals',ylab='Squared Fit')
par(op)
dev.off()
bitmap(file='test6.png')
par(mfrow = c(3,1), mar = c(3,3,3,3))
plot(cbind(x, pred$pred), type = 'n', plot.type = 'single', ylab = '')
lines(x)
polygon(c(time(pred$pred), rev(time(pred$pred))), c(pred$pred + 2 * pred$se, rev(pred$pred)), col = 'gray85', border = NA)
polygon(c(time(pred$pred), rev(time(pred$pred))), c(pred$pred - 2 * pred$se, rev(pred$pred)), col = ' gray85', border = NA)
lines(pred$pred, col = 'blue', lwd = 1.5)
mtext(text = 'forecasts of the observed series', side = 3, adj = 0)
plot(cbind(x, pred$a[,1]), type = 'n', plot.type = 'single', ylab = '')
lines(x)
polygon(c(time(pred$a[,1]), rev(time(pred$a[,1]))), c(pred$a[,1] + 2 * sqrt(pred$P[,1]), rev(pred$a[,1])), col = 'gray85', border = NA)
polygon(c(time(pred$a[,1]), rev(time(pred$a[,1]))), c(pred$a[,1] - 2 * sqrt(pred$P[,1]), rev(pred$a[,1])), col = ' gray85', border = NA)
lines(pred$a[,1], col = 'blue', lwd = 1.5)
mtext(text = 'forecasts of the level component', side = 3, adj = 0)
plot(cbind(fit2.comps[,3], pred$a[,3]), type = 'n', plot.type = 'single', ylab = '')
lines(fit2.comps[,3])
polygon(c(time(pred$a[,3]), rev(time(pred$a[,3]))), c(pred$a[,3] + 2 * sqrt(pred$P[,3]), rev(pred$a[,3])), col = 'gray85', border = NA)
polygon(c(time(pred$a[,3]), rev(time(pred$a[,3]))), c(pred$a[,3] - 2 * sqrt(pred$P[,3]), rev(pred$a[,3])), col = ' gray85', border = NA)
lines(pred$a[,3], col = 'blue', lwd = 1.5)
mtext(text = 'forecasts of the seasonal component', side = 3, adj = 0)
dev.off()
load(file='createtable')
a<-table.start()
a<-table.row.start(a)
a<-table.element(a,'Structural Time Series Model -- Interpolation',6,TRUE)
a<-table.row.end(a)
a<-table.row.start(a)
a<-table.element(a,'t',header=TRUE)
a<-table.element(a,'Observed',header=TRUE)
a<-table.element(a,'Level',header=TRUE)
a<-table.element(a,'Slope',header=TRUE)
a<-table.element(a,'Seasonal',header=TRUE)
a<-table.element(a,'Stand. Residuals',header=TRUE)
a<-table.row.end(a)
for (i in 1:nx) {
a<-table.row.start(a)
a<-table.element(a,i,header=TRUE)
a<-table.element(a,x[i])
a<-table.element(a,mylevel[i])
a<-table.element(a,myslope[i])
a<-table.element(a,myseas[i])
a<-table.element(a,myresid[i])
a<-table.row.end(a)
}
a<-table.end(a)
table.save(a,file='mytable.tab')
a<-table.start()
a<-table.row.start(a)
a<-table.element(a,'Structural Time Series Model -- Extrapolation',4,TRUE)
a<-table.row.end(a)
a<-table.row.start(a)
a<-table.element(a,'t',header=TRUE)
a<-table.element(a,'Observed',header=TRUE)
a<-table.element(a,'Level',header=TRUE)
a<-table.element(a,'Seasonal',header=TRUE)
a<-table.row.end(a)
for (i in 1:par2) {
a<-table.row.start(a)
a<-table.element(a,i,header=TRUE)
a<-table.element(a,pred$pred[i])
a<-table.element(a,pred$a[i,1])
a<-table.element(a,pred$a[i,3])
a<-table.row.end(a)
}
a<-table.end(a)
table.save(a,file='mytable1.tab')