Free Statistics

of Irreproducible Research!

Author's title

Author*The author of this computation has been verified*
R Software Modulerwasp_autocorrelation.wasp
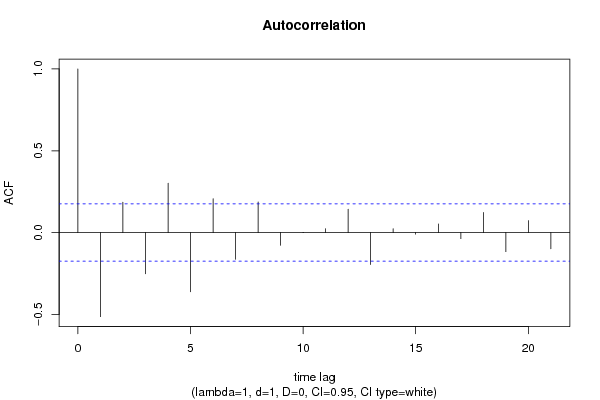
Title produced by software(Partial) Autocorrelation Function
Date of computationTue, 13 Dec 2016 13:01:25 +0100
Cite this page as followsStatistical Computations at FreeStatistics.org, Office for Research Development and Education, URL https://freestatistics.org/blog/index.php?v=date/2016/Dec/13/t14816305845l5yh6l907qu90v.htm/, Retrieved Fri, 01 Nov 2024 03:35:52 +0000
Statistical Computations at FreeStatistics.org, Office for Research Development and Education, URL https://freestatistics.org/blog/index.php?pk=299081, Retrieved Fri, 01 Nov 2024 03:35:52 +0000
QR Codes:

Original text written by user:
IsPrivate?No (this computation is public)
User-defined keywords
Estimated Impact80
Family? (F = Feedback message, R = changed R code, M = changed R Module, P = changed Parameters, D = changed Data)
-       [(Partial) Autocorrelation Function] [Autocorrelation] [2016-12-13 12:01:25] [36884fbde1107444791dd71ee0072a5a] [Current]
Feedback Forum

Post a new message
Dataseries X:
3647
1885
4791
3178
2849
4716
3085
2799
3573
2721
3355
5667
2856
1944
4188
2949
3567
4137
3494
2489
3244
2669
2529
3377
3366
2073
4133
4213
3710
5123
3141
3084
3804
3203
2757
2243
5229
2857
3395
4882
7140
8945
6866
4205
3217
3079
2263
4187
2665
2073
3540
3686
2384
4500
1679
868
1869
3710
6904
3415
938
3359
3551
2278
3033
2280
2901
4812
4882
7896
5048
3741
4418
3471
5055
7595
8124
2333
3008
2744
2833
2428
4269
3207
5170
7767
4544
3741
2193
3432
5282
6635
4222
7317
4132
5048
4383
3761
4081
6491
5859
7139
7682
8649
6146
7137
9948
15819
8370
13222
16711
19059
8303
20781
9638
13444
6072
13442
14457
17705
16463
19194
20688
14739
12702
15760


Summary of computational transaction
Raw Input view raw input (R code)
Raw Outputview raw output of R engine
Computing time1 seconds
R ServerBig Analytics Cloud Computing Center

\begin{tabular}{lllllllll}
\hline
Summary of computational transaction \tabularnewline
Raw Input view raw input (R code)  \tabularnewline
Raw Outputview raw output of R engine  \tabularnewline
Computing time1 seconds \tabularnewline
R ServerBig Analytics Cloud Computing Center \tabularnewline
\hline
\end{tabular}
%Source: https://freestatistics.org/blog/index.php?pk=299081&T=0

[TABLE]
[ROW]
Summary of computational transaction[/C][/ROW] [ROW]Raw Input[/C] view raw input (R code) [/C][/ROW] [ROW]Raw Output[/C]view raw output of R engine [/C][/ROW] [ROW]Computing time[/C]1 seconds[/C][/ROW] [ROW]R Server[/C]Big Analytics Cloud Computing Center[/C][/ROW] [/TABLE] Source: https://freestatistics.org/blog/index.php?pk=299081&T=0

Globally Unique Identifier (entire table): ba.freestatistics.org/blog/index.php?pk=299081&T=0

As an alternative you can also use a QR Code:  

The GUIDs for individual cells are displayed in the table below:

Summary of computational transaction
Raw Input view raw input (R code)
Raw Outputview raw output of R engine
Computing time1 seconds
R ServerBig Analytics Cloud Computing Center


Autocorrelation Function
Time lag kACF(k)T-STATP-value
1-0.51401-5.74680
20.1848292.06640.020426
3-0.252-2.81750.002814
40.3013023.36870.000502
5-0.36149-4.04164.6e-05
60.2066822.31080.011242
7-0.162714-1.81920.035638
80.1867672.08810.019408
9-0.077417-0.86550.194198
10-0.001338-0.0150.494043
110.0237880.2660.395355
120.1426881.59530.056585
13-0.195703-2.1880.015263
140.0230940.25820.398337
15-0.009669-0.10810.457044
160.0522520.58420.280072
17-0.037157-0.41540.33927
180.1223681.36810.086865
19-0.116619-1.30380.097342
200.0730380.81660.207857
21-0.098874-1.10540.135545

\begin{tabular}{lllllllll}
\hline
Autocorrelation Function \tabularnewline
Time lag k & ACF(k) & T-STAT & P-value \tabularnewline
1 & -0.51401 & -5.7468 & 0 \tabularnewline
2 & 0.184829 & 2.0664 & 0.020426 \tabularnewline
3 & -0.252 & -2.8175 & 0.002814 \tabularnewline
4 & 0.301302 & 3.3687 & 0.000502 \tabularnewline
5 & -0.36149 & -4.0416 & 4.6e-05 \tabularnewline
6 & 0.206682 & 2.3108 & 0.011242 \tabularnewline
7 & -0.162714 & -1.8192 & 0.035638 \tabularnewline
8 & 0.186767 & 2.0881 & 0.019408 \tabularnewline
9 & -0.077417 & -0.8655 & 0.194198 \tabularnewline
10 & -0.001338 & -0.015 & 0.494043 \tabularnewline
11 & 0.023788 & 0.266 & 0.395355 \tabularnewline
12 & 0.142688 & 1.5953 & 0.056585 \tabularnewline
13 & -0.195703 & -2.188 & 0.015263 \tabularnewline
14 & 0.023094 & 0.2582 & 0.398337 \tabularnewline
15 & -0.009669 & -0.1081 & 0.457044 \tabularnewline
16 & 0.052252 & 0.5842 & 0.280072 \tabularnewline
17 & -0.037157 & -0.4154 & 0.33927 \tabularnewline
18 & 0.122368 & 1.3681 & 0.086865 \tabularnewline
19 & -0.116619 & -1.3038 & 0.097342 \tabularnewline
20 & 0.073038 & 0.8166 & 0.207857 \tabularnewline
21 & -0.098874 & -1.1054 & 0.135545 \tabularnewline
\hline
\end{tabular}
%Source: https://freestatistics.org/blog/index.php?pk=299081&T=1

[TABLE]
[ROW][C]Autocorrelation Function[/C][/ROW]
[ROW][C]Time lag k[/C][C]ACF(k)[/C][C]T-STAT[/C][C]P-value[/C][/ROW]
[ROW][C]1[/C][C]-0.51401[/C][C]-5.7468[/C][C]0[/C][/ROW]
[ROW][C]2[/C][C]0.184829[/C][C]2.0664[/C][C]0.020426[/C][/ROW]
[ROW][C]3[/C][C]-0.252[/C][C]-2.8175[/C][C]0.002814[/C][/ROW]
[ROW][C]4[/C][C]0.301302[/C][C]3.3687[/C][C]0.000502[/C][/ROW]
[ROW][C]5[/C][C]-0.36149[/C][C]-4.0416[/C][C]4.6e-05[/C][/ROW]
[ROW][C]6[/C][C]0.206682[/C][C]2.3108[/C][C]0.011242[/C][/ROW]
[ROW][C]7[/C][C]-0.162714[/C][C]-1.8192[/C][C]0.035638[/C][/ROW]
[ROW][C]8[/C][C]0.186767[/C][C]2.0881[/C][C]0.019408[/C][/ROW]
[ROW][C]9[/C][C]-0.077417[/C][C]-0.8655[/C][C]0.194198[/C][/ROW]
[ROW][C]10[/C][C]-0.001338[/C][C]-0.015[/C][C]0.494043[/C][/ROW]
[ROW][C]11[/C][C]0.023788[/C][C]0.266[/C][C]0.395355[/C][/ROW]
[ROW][C]12[/C][C]0.142688[/C][C]1.5953[/C][C]0.056585[/C][/ROW]
[ROW][C]13[/C][C]-0.195703[/C][C]-2.188[/C][C]0.015263[/C][/ROW]
[ROW][C]14[/C][C]0.023094[/C][C]0.2582[/C][C]0.398337[/C][/ROW]
[ROW][C]15[/C][C]-0.009669[/C][C]-0.1081[/C][C]0.457044[/C][/ROW]
[ROW][C]16[/C][C]0.052252[/C][C]0.5842[/C][C]0.280072[/C][/ROW]
[ROW][C]17[/C][C]-0.037157[/C][C]-0.4154[/C][C]0.33927[/C][/ROW]
[ROW][C]18[/C][C]0.122368[/C][C]1.3681[/C][C]0.086865[/C][/ROW]
[ROW][C]19[/C][C]-0.116619[/C][C]-1.3038[/C][C]0.097342[/C][/ROW]
[ROW][C]20[/C][C]0.073038[/C][C]0.8166[/C][C]0.207857[/C][/ROW]
[ROW][C]21[/C][C]-0.098874[/C][C]-1.1054[/C][C]0.135545[/C][/ROW]
[/TABLE]
Source: https://freestatistics.org/blog/index.php?pk=299081&T=1

Globally Unique Identifier (entire table): ba.freestatistics.org/blog/index.php?pk=299081&T=1

As an alternative you can also use a QR Code:  

The GUIDs for individual cells are displayed in the table below:

Autocorrelation Function
Time lag kACF(k)T-STATP-value
1-0.51401-5.74680
20.1848292.06640.020426
3-0.252-2.81750.002814
40.3013023.36870.000502
5-0.36149-4.04164.6e-05
60.2066822.31080.011242
7-0.162714-1.81920.035638
80.1867672.08810.019408
9-0.077417-0.86550.194198
10-0.001338-0.0150.494043
110.0237880.2660.395355
120.1426881.59530.056585
13-0.195703-2.1880.015263
140.0230940.25820.398337
15-0.009669-0.10810.457044
160.0522520.58420.280072
17-0.037157-0.41540.33927
180.1223681.36810.086865
19-0.116619-1.30380.097342
200.0730380.81660.207857
21-0.098874-1.10540.135545


Partial Autocorrelation Function
Time lag kPACF(k)T-STATP-value
1-0.51401-5.74680
2-0.107881-1.20610.11502
3-0.27804-3.10860.001164
40.0842410.94180.174046
5-0.246166-2.75220.0034
6-0.147121-1.64490.051256
7-0.152126-1.70080.045732
8-0.078557-0.87830.190736
90.0795980.88990.187606
10-0.132998-1.4870.069771
110.028320.31660.376028
120.2017282.25540.012924
13-0.029885-0.33410.369421
14-0.024148-0.270.393809
15-0.067246-0.75180.226782
16-0.00444-0.04960.480246
170.0892990.99840.160008
180.1597521.78610.038255
190.0251830.28160.389377
20-0.018147-0.20290.419774
21-0.046296-0.51760.302824

\begin{tabular}{lllllllll}
\hline
Partial Autocorrelation Function \tabularnewline
Time lag k & PACF(k) & T-STAT & P-value \tabularnewline
1 & -0.51401 & -5.7468 & 0 \tabularnewline
2 & -0.107881 & -1.2061 & 0.11502 \tabularnewline
3 & -0.27804 & -3.1086 & 0.001164 \tabularnewline
4 & 0.084241 & 0.9418 & 0.174046 \tabularnewline
5 & -0.246166 & -2.7522 & 0.0034 \tabularnewline
6 & -0.147121 & -1.6449 & 0.051256 \tabularnewline
7 & -0.152126 & -1.7008 & 0.045732 \tabularnewline
8 & -0.078557 & -0.8783 & 0.190736 \tabularnewline
9 & 0.079598 & 0.8899 & 0.187606 \tabularnewline
10 & -0.132998 & -1.487 & 0.069771 \tabularnewline
11 & 0.02832 & 0.3166 & 0.376028 \tabularnewline
12 & 0.201728 & 2.2554 & 0.012924 \tabularnewline
13 & -0.029885 & -0.3341 & 0.369421 \tabularnewline
14 & -0.024148 & -0.27 & 0.393809 \tabularnewline
15 & -0.067246 & -0.7518 & 0.226782 \tabularnewline
16 & -0.00444 & -0.0496 & 0.480246 \tabularnewline
17 & 0.089299 & 0.9984 & 0.160008 \tabularnewline
18 & 0.159752 & 1.7861 & 0.038255 \tabularnewline
19 & 0.025183 & 0.2816 & 0.389377 \tabularnewline
20 & -0.018147 & -0.2029 & 0.419774 \tabularnewline
21 & -0.046296 & -0.5176 & 0.302824 \tabularnewline
\hline
\end{tabular}
%Source: https://freestatistics.org/blog/index.php?pk=299081&T=2

[TABLE]
[ROW][C]Partial Autocorrelation Function[/C][/ROW]
[ROW][C]Time lag k[/C][C]PACF(k)[/C][C]T-STAT[/C][C]P-value[/C][/ROW]
[ROW][C]1[/C][C]-0.51401[/C][C]-5.7468[/C][C]0[/C][/ROW]
[ROW][C]2[/C][C]-0.107881[/C][C]-1.2061[/C][C]0.11502[/C][/ROW]
[ROW][C]3[/C][C]-0.27804[/C][C]-3.1086[/C][C]0.001164[/C][/ROW]
[ROW][C]4[/C][C]0.084241[/C][C]0.9418[/C][C]0.174046[/C][/ROW]
[ROW][C]5[/C][C]-0.246166[/C][C]-2.7522[/C][C]0.0034[/C][/ROW]
[ROW][C]6[/C][C]-0.147121[/C][C]-1.6449[/C][C]0.051256[/C][/ROW]
[ROW][C]7[/C][C]-0.152126[/C][C]-1.7008[/C][C]0.045732[/C][/ROW]
[ROW][C]8[/C][C]-0.078557[/C][C]-0.8783[/C][C]0.190736[/C][/ROW]
[ROW][C]9[/C][C]0.079598[/C][C]0.8899[/C][C]0.187606[/C][/ROW]
[ROW][C]10[/C][C]-0.132998[/C][C]-1.487[/C][C]0.069771[/C][/ROW]
[ROW][C]11[/C][C]0.02832[/C][C]0.3166[/C][C]0.376028[/C][/ROW]
[ROW][C]12[/C][C]0.201728[/C][C]2.2554[/C][C]0.012924[/C][/ROW]
[ROW][C]13[/C][C]-0.029885[/C][C]-0.3341[/C][C]0.369421[/C][/ROW]
[ROW][C]14[/C][C]-0.024148[/C][C]-0.27[/C][C]0.393809[/C][/ROW]
[ROW][C]15[/C][C]-0.067246[/C][C]-0.7518[/C][C]0.226782[/C][/ROW]
[ROW][C]16[/C][C]-0.00444[/C][C]-0.0496[/C][C]0.480246[/C][/ROW]
[ROW][C]17[/C][C]0.089299[/C][C]0.9984[/C][C]0.160008[/C][/ROW]
[ROW][C]18[/C][C]0.159752[/C][C]1.7861[/C][C]0.038255[/C][/ROW]
[ROW][C]19[/C][C]0.025183[/C][C]0.2816[/C][C]0.389377[/C][/ROW]
[ROW][C]20[/C][C]-0.018147[/C][C]-0.2029[/C][C]0.419774[/C][/ROW]
[ROW][C]21[/C][C]-0.046296[/C][C]-0.5176[/C][C]0.302824[/C][/ROW]
[/TABLE]
Source: https://freestatistics.org/blog/index.php?pk=299081&T=2

Globally Unique Identifier (entire table): ba.freestatistics.org/blog/index.php?pk=299081&T=2

As an alternative you can also use a QR Code:  

The GUIDs for individual cells are displayed in the table below:

Partial Autocorrelation Function
Time lag kPACF(k)T-STATP-value
1-0.51401-5.74680
2-0.107881-1.20610.11502
3-0.27804-3.10860.001164
40.0842410.94180.174046
5-0.246166-2.75220.0034
6-0.147121-1.64490.051256
7-0.152126-1.70080.045732
8-0.078557-0.87830.190736
90.0795980.88990.187606
10-0.132998-1.4870.069771
110.028320.31660.376028
120.2017282.25540.012924
13-0.029885-0.33410.369421
14-0.024148-0.270.393809
15-0.067246-0.75180.226782
16-0.00444-0.04960.480246
170.0892990.99840.160008
180.1597521.78610.038255
190.0251830.28160.389377
20-0.018147-0.20290.419774
21-0.046296-0.51760.302824


Parameters (Session):
par1 = Default ; par2 = 1 ; par3 = 1 ; par4 = 0 ; par5 = 12 ; par6 = White Noise ; par7 = 0.95 ;
Parameters (R input):
par1 = Default ; par2 = 1 ; par3 = 1 ; par4 = 0 ; par5 = 12 ; par6 = White Noise ; par7 = 0.95 ; par8 = ;
R code (references can be found in the software module):
par8 <- ''
par7 <- '0.95'
par6 <- 'White Noise'
par5 <- '12'
par4 <- '1'
par3 <- '0'
par2 <- '1'
par1 <- 'Default'
if (par1 == 'Default') {
par1 = 10*log10(length(x))
} else {
par1 <- as.numeric(par1)
}
par2 <- as.numeric(par2)
par3 <- as.numeric(par3)
par4 <- as.numeric(par4)
par5 <- as.numeric(par5)
if (par6 == 'White Noise') par6 <- 'white' else par6 <- 'ma'
par7 <- as.numeric(par7)
if (par8 != '') par8 <- as.numeric(par8)
x <- na.omit(x)
ox <- x
if (par8 == '') {
if (par2 == 0) {
x <- log(x)
} else {
x <- (x ^ par2 - 1) / par2
}
} else {
x <- log(x,base=par8)
}
if (par3 > 0) x <- diff(x,lag=1,difference=par3)
if (par4 > 0) x <- diff(x,lag=par5,difference=par4)
bitmap(file='picts.png')
op <- par(mfrow=c(2,1))
plot(ox,type='l',main='Original Time Series',xlab='time',ylab='value')
if (par8=='') {
mytitle <- paste('Working Time Series (lambda=',par2,', d=',par3,', D=',par4,')',sep='')
mysub <- paste('(lambda=',par2,', d=',par3,', D=',par4,', CI=', par7, ', CI type=',par6,')',sep='')
} else {
mytitle <- paste('Working Time Series (base=',par8,', d=',par3,', D=',par4,')',sep='')
mysub <- paste('(base=',par8,', d=',par3,', D=',par4,', CI=', par7, ', CI type=',par6,')',sep='')
}
plot(x,type='l', main=mytitle,xlab='time',ylab='value')
par(op)
dev.off()
bitmap(file='pic1.png')
racf <- acf(x, par1, main='Autocorrelation', xlab='time lag', ylab='ACF', ci.type=par6, ci=par7, sub=mysub)
dev.off()
bitmap(file='pic2.png')
rpacf <- pacf(x,par1,main='Partial Autocorrelation',xlab='lags',ylab='PACF',sub=mysub)
dev.off()
(myacf <- c(racf$acf))
(mypacf <- c(rpacf$acf))
lengthx <- length(x)
sqrtn <- sqrt(lengthx)
load(file='createtable')
a<-table.start()
a<-table.row.start(a)
a<-table.element(a,'Autocorrelation Function',4,TRUE)
a<-table.row.end(a)
a<-table.row.start(a)
a<-table.element(a,'Time lag k',header=TRUE)
a<-table.element(a,'ACF(k)',header=TRUE)
a<-table.element(a,'T-STAT',header=TRUE)
a<-table.element(a,'P-value',header=TRUE)
a<-table.row.end(a)
for (i in 2:(par1+1)) {
a<-table.row.start(a)
a<-table.element(a,i-1,header=TRUE)
a<-table.element(a,round(myacf[i],6))
mytstat <- myacf[i]*sqrtn
a<-table.element(a,round(mytstat,4))
a<-table.element(a,round(1-pt(abs(mytstat),lengthx),6))
a<-table.row.end(a)
}
a<-table.end(a)
table.save(a,file='mytable.tab')
a<-table.start()
a<-table.row.start(a)
a<-table.element(a,'Partial Autocorrelation Function',4,TRUE)
a<-table.row.end(a)
a<-table.row.start(a)
a<-table.element(a,'Time lag k',header=TRUE)
a<-table.element(a,'PACF(k)',header=TRUE)
a<-table.element(a,'T-STAT',header=TRUE)
a<-table.element(a,'P-value',header=TRUE)
a<-table.row.end(a)
for (i in 1:par1) {
a<-table.row.start(a)
a<-table.element(a,i,header=TRUE)
a<-table.element(a,round(mypacf[i],6))
mytstat <- mypacf[i]*sqrtn
a<-table.element(a,round(mytstat,4))
a<-table.element(a,round(1-pt(abs(mytstat),lengthx),6))
a<-table.row.end(a)
}
a<-table.end(a)
table.save(a,file='mytable1.tab')