Free Statistics

of Irreproducible Research!

Author's title

Author*The author of this computation has been verified*
R Software Modulerwasp_arimabackwardselection.wasp
Title produced by softwareARIMA Backward Selection
Date of computationMon, 12 Dec 2016 21:23:25 +0100
Cite this page as followsStatistical Computations at FreeStatistics.org, Office for Research Development and Education, URL https://freestatistics.org/blog/index.php?v=date/2016/Dec/12/t1481574300v50iu0fz1m55jnu.htm/, Retrieved Fri, 01 Nov 2024 03:46:51 +0000
Statistical Computations at FreeStatistics.org, Office for Research Development and Education, URL https://freestatistics.org/blog/index.php?pk=298987, Retrieved Fri, 01 Nov 2024 03:46:51 +0000
QR Codes:

Original text written by user:
IsPrivate?No (this computation is public)
User-defined keywords
Estimated Impact102
Family? (F = Feedback message, R = changed R code, M = changed R Module, P = changed Parameters, D = changed Data)
-       [ARIMA Backward Selection] [F1 ARIMA] [2016-12-12 20:23:25] [d441656ca728cb07c490d5bfa1128042] [Current]
Feedback Forum

Post a new message
Dataseries X:
3455
3585
3675
3680
3735
3860
3765
3905
4110
4170
4110
4025
4145
4285
4370
4355
4385
4525
4375
4525
4610
4595
4500
4370
4390
4530
4590
4580
4595
4685
4490
4635
4710
4655
4665
4550
4590
4675
4645
4665
4635
4720
4565
4720
4830
4830
4765
4705
4675
4900
4945
4905
4955
5120
4860
5040
5140
5240
5145
5070
5085
5215
5255
5275
5315
5450
5205
5370
5500
5490
5440
5360
5380
5460
5450
5520
5475
5600
5250
5465
5515
5425
5325
5275
5160
5360
5435
5285
5415
5575
5265
5480
5565
5500
5280
5135
5050
5100
5070
5115
5140
5330
5080
5285
5405
5385
5255
5100
5040
5235
5310
5265
5380
5465
5225
5445


Summary of computational transaction
Raw Input view raw input (R code)
Raw Outputview raw output of R engine
Computing time7 seconds
R ServerBig Analytics Cloud Computing Center

\begin{tabular}{lllllllll}
\hline
Summary of computational transaction \tabularnewline
Raw Input view raw input (R code)  \tabularnewline
Raw Outputview raw output of R engine  \tabularnewline
Computing time7 seconds \tabularnewline
R ServerBig Analytics Cloud Computing Center \tabularnewline
\hline
\end{tabular}
%Source: https://freestatistics.org/blog/index.php?pk=298987&T=0

[TABLE]
[ROW]
Summary of computational transaction[/C][/ROW] [ROW]Raw Input[/C] view raw input (R code) [/C][/ROW] [ROW]Raw Output[/C]view raw output of R engine [/C][/ROW] [ROW]Computing time[/C]7 seconds[/C][/ROW] [ROW]R Server[/C]Big Analytics Cloud Computing Center[/C][/ROW] [/TABLE] Source: https://freestatistics.org/blog/index.php?pk=298987&T=0

Globally Unique Identifier (entire table): ba.freestatistics.org/blog/index.php?pk=298987&T=0

As an alternative you can also use a QR Code:  

The GUIDs for individual cells are displayed in the table below:

Summary of computational transaction
Raw Input view raw input (R code)
Raw Outputview raw output of R engine
Computing time7 seconds
R ServerBig Analytics Cloud Computing Center


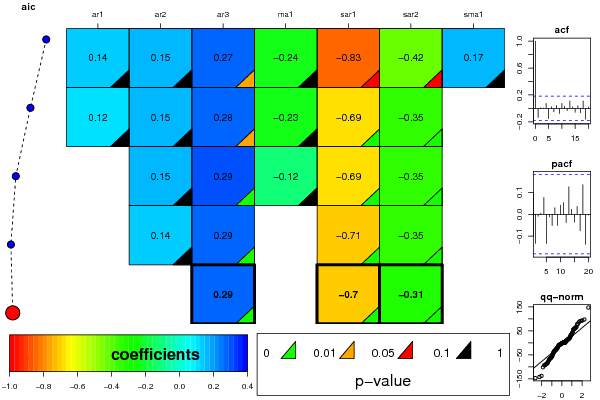
ARIMA Parameter Estimation and Backward Selection
Iterationar1ar2ar3ma1sar1sar2sma1
Estimates ( 1 )0.13510.15270.2742-0.24-0.8347-0.42070.1661
(p-val)(0.5873 )(0.124 )(0.0126 )(0.331 )(0.0676 )(0.0865 )(0.753 )
Estimates ( 2 )0.11740.15320.2756-0.2272-0.6912-0.34520
(p-val)(0.6263 )(0.1213 )(0.0113 )(0.3471 )(0 )(0.0014 )(NA )
Estimates ( 3 )00.14870.2936-0.1186-0.6873-0.34510
(p-val)(NA )(0.128 )(0.0027 )(0.2354 )(0 )(0.0014 )(NA )
Estimates ( 4 )00.14450.28580-0.7142-0.34770
(p-val)(NA )(0.1385 )(0.0037 )(NA )(0 )(0.0012 )(NA )
Estimates ( 5 )000.28650-0.7031-0.31240
(p-val)(NA )(NA )(0.0039 )(NA )(0 )(0.003 )(NA )
Estimates ( 6 )NANANANANANANA
(p-val)(NA )(NA )(NA )(NA )(NA )(NA )(NA )
Estimates ( 7 )NANANANANANANA
(p-val)(NA )(NA )(NA )(NA )(NA )(NA )(NA )
Estimates ( 8 )NANANANANANANA
(p-val)(NA )(NA )(NA )(NA )(NA )(NA )(NA )
Estimates ( 9 )NANANANANANANA
(p-val)(NA )(NA )(NA )(NA )(NA )(NA )(NA )
Estimates ( 10 )NANANANANANANA
(p-val)(NA )(NA )(NA )(NA )(NA )(NA )(NA )
Estimates ( 11 )NANANANANANANA
(p-val)(NA )(NA )(NA )(NA )(NA )(NA )(NA )
Estimates ( 12 )NANANANANANANA
(p-val)(NA )(NA )(NA )(NA )(NA )(NA )(NA )
Estimates ( 13 )NANANANANANANA
(p-val)(NA )(NA )(NA )(NA )(NA )(NA )(NA )

\begin{tabular}{lllllllll}
\hline
ARIMA Parameter Estimation and Backward Selection \tabularnewline
Iteration & ar1 & ar2 & ar3 & ma1 & sar1 & sar2 & sma1 \tabularnewline
Estimates ( 1 ) & 0.1351 & 0.1527 & 0.2742 & -0.24 & -0.8347 & -0.4207 & 0.1661 \tabularnewline
(p-val) & (0.5873 ) & (0.124 ) & (0.0126 ) & (0.331 ) & (0.0676 ) & (0.0865 ) & (0.753 ) \tabularnewline
Estimates ( 2 ) & 0.1174 & 0.1532 & 0.2756 & -0.2272 & -0.6912 & -0.3452 & 0 \tabularnewline
(p-val) & (0.6263 ) & (0.1213 ) & (0.0113 ) & (0.3471 ) & (0 ) & (0.0014 ) & (NA ) \tabularnewline
Estimates ( 3 ) & 0 & 0.1487 & 0.2936 & -0.1186 & -0.6873 & -0.3451 & 0 \tabularnewline
(p-val) & (NA ) & (0.128 ) & (0.0027 ) & (0.2354 ) & (0 ) & (0.0014 ) & (NA ) \tabularnewline
Estimates ( 4 ) & 0 & 0.1445 & 0.2858 & 0 & -0.7142 & -0.3477 & 0 \tabularnewline
(p-val) & (NA ) & (0.1385 ) & (0.0037 ) & (NA ) & (0 ) & (0.0012 ) & (NA ) \tabularnewline
Estimates ( 5 ) & 0 & 0 & 0.2865 & 0 & -0.7031 & -0.3124 & 0 \tabularnewline
(p-val) & (NA ) & (NA ) & (0.0039 ) & (NA ) & (0 ) & (0.003 ) & (NA ) \tabularnewline
Estimates ( 6 ) & NA & NA & NA & NA & NA & NA & NA \tabularnewline
(p-val) & (NA ) & (NA ) & (NA ) & (NA ) & (NA ) & (NA ) & (NA ) \tabularnewline
Estimates ( 7 ) & NA & NA & NA & NA & NA & NA & NA \tabularnewline
(p-val) & (NA ) & (NA ) & (NA ) & (NA ) & (NA ) & (NA ) & (NA ) \tabularnewline
Estimates ( 8 ) & NA & NA & NA & NA & NA & NA & NA \tabularnewline
(p-val) & (NA ) & (NA ) & (NA ) & (NA ) & (NA ) & (NA ) & (NA ) \tabularnewline
Estimates ( 9 ) & NA & NA & NA & NA & NA & NA & NA \tabularnewline
(p-val) & (NA ) & (NA ) & (NA ) & (NA ) & (NA ) & (NA ) & (NA ) \tabularnewline
Estimates ( 10 ) & NA & NA & NA & NA & NA & NA & NA \tabularnewline
(p-val) & (NA ) & (NA ) & (NA ) & (NA ) & (NA ) & (NA ) & (NA ) \tabularnewline
Estimates ( 11 ) & NA & NA & NA & NA & NA & NA & NA \tabularnewline
(p-val) & (NA ) & (NA ) & (NA ) & (NA ) & (NA ) & (NA ) & (NA ) \tabularnewline
Estimates ( 12 ) & NA & NA & NA & NA & NA & NA & NA \tabularnewline
(p-val) & (NA ) & (NA ) & (NA ) & (NA ) & (NA ) & (NA ) & (NA ) \tabularnewline
Estimates ( 13 ) & NA & NA & NA & NA & NA & NA & NA \tabularnewline
(p-val) & (NA ) & (NA ) & (NA ) & (NA ) & (NA ) & (NA ) & (NA ) \tabularnewline
\hline
\end{tabular}
%Source: https://freestatistics.org/blog/index.php?pk=298987&T=1

[TABLE]
[ROW][C]ARIMA Parameter Estimation and Backward Selection[/C][/ROW]
[ROW][C]Iteration[/C][C]ar1[/C][C]ar2[/C][C]ar3[/C][C]ma1[/C][C]sar1[/C][C]sar2[/C][C]sma1[/C][/ROW]
[ROW][C]Estimates ( 1 )[/C][C]0.1351[/C][C]0.1527[/C][C]0.2742[/C][C]-0.24[/C][C]-0.8347[/C][C]-0.4207[/C][C]0.1661[/C][/ROW]
[ROW][C](p-val)[/C][C](0.5873 )[/C][C](0.124 )[/C][C](0.0126 )[/C][C](0.331 )[/C][C](0.0676 )[/C][C](0.0865 )[/C][C](0.753 )[/C][/ROW]
[ROW][C]Estimates ( 2 )[/C][C]0.1174[/C][C]0.1532[/C][C]0.2756[/C][C]-0.2272[/C][C]-0.6912[/C][C]-0.3452[/C][C]0[/C][/ROW]
[ROW][C](p-val)[/C][C](0.6263 )[/C][C](0.1213 )[/C][C](0.0113 )[/C][C](0.3471 )[/C][C](0 )[/C][C](0.0014 )[/C][C](NA )[/C][/ROW]
[ROW][C]Estimates ( 3 )[/C][C]0[/C][C]0.1487[/C][C]0.2936[/C][C]-0.1186[/C][C]-0.6873[/C][C]-0.3451[/C][C]0[/C][/ROW]
[ROW][C](p-val)[/C][C](NA )[/C][C](0.128 )[/C][C](0.0027 )[/C][C](0.2354 )[/C][C](0 )[/C][C](0.0014 )[/C][C](NA )[/C][/ROW]
[ROW][C]Estimates ( 4 )[/C][C]0[/C][C]0.1445[/C][C]0.2858[/C][C]0[/C][C]-0.7142[/C][C]-0.3477[/C][C]0[/C][/ROW]
[ROW][C](p-val)[/C][C](NA )[/C][C](0.1385 )[/C][C](0.0037 )[/C][C](NA )[/C][C](0 )[/C][C](0.0012 )[/C][C](NA )[/C][/ROW]
[ROW][C]Estimates ( 5 )[/C][C]0[/C][C]0[/C][C]0.2865[/C][C]0[/C][C]-0.7031[/C][C]-0.3124[/C][C]0[/C][/ROW]
[ROW][C](p-val)[/C][C](NA )[/C][C](NA )[/C][C](0.0039 )[/C][C](NA )[/C][C](0 )[/C][C](0.003 )[/C][C](NA )[/C][/ROW]
[ROW][C]Estimates ( 6 )[/C][C]NA[/C][C]NA[/C][C]NA[/C][C]NA[/C][C]NA[/C][C]NA[/C][C]NA[/C][/ROW]
[ROW][C](p-val)[/C][C](NA )[/C][C](NA )[/C][C](NA )[/C][C](NA )[/C][C](NA )[/C][C](NA )[/C][C](NA )[/C][/ROW]
[ROW][C]Estimates ( 7 )[/C][C]NA[/C][C]NA[/C][C]NA[/C][C]NA[/C][C]NA[/C][C]NA[/C][C]NA[/C][/ROW]
[ROW][C](p-val)[/C][C](NA )[/C][C](NA )[/C][C](NA )[/C][C](NA )[/C][C](NA )[/C][C](NA )[/C][C](NA )[/C][/ROW]
[ROW][C]Estimates ( 8 )[/C][C]NA[/C][C]NA[/C][C]NA[/C][C]NA[/C][C]NA[/C][C]NA[/C][C]NA[/C][/ROW]
[ROW][C](p-val)[/C][C](NA )[/C][C](NA )[/C][C](NA )[/C][C](NA )[/C][C](NA )[/C][C](NA )[/C][C](NA )[/C][/ROW]
[ROW][C]Estimates ( 9 )[/C][C]NA[/C][C]NA[/C][C]NA[/C][C]NA[/C][C]NA[/C][C]NA[/C][C]NA[/C][/ROW]
[ROW][C](p-val)[/C][C](NA )[/C][C](NA )[/C][C](NA )[/C][C](NA )[/C][C](NA )[/C][C](NA )[/C][C](NA )[/C][/ROW]
[ROW][C]Estimates ( 10 )[/C][C]NA[/C][C]NA[/C][C]NA[/C][C]NA[/C][C]NA[/C][C]NA[/C][C]NA[/C][/ROW]
[ROW][C](p-val)[/C][C](NA )[/C][C](NA )[/C][C](NA )[/C][C](NA )[/C][C](NA )[/C][C](NA )[/C][C](NA )[/C][/ROW]
[ROW][C]Estimates ( 11 )[/C][C]NA[/C][C]NA[/C][C]NA[/C][C]NA[/C][C]NA[/C][C]NA[/C][C]NA[/C][/ROW]
[ROW][C](p-val)[/C][C](NA )[/C][C](NA )[/C][C](NA )[/C][C](NA )[/C][C](NA )[/C][C](NA )[/C][C](NA )[/C][/ROW]
[ROW][C]Estimates ( 12 )[/C][C]NA[/C][C]NA[/C][C]NA[/C][C]NA[/C][C]NA[/C][C]NA[/C][C]NA[/C][/ROW]
[ROW][C](p-val)[/C][C](NA )[/C][C](NA )[/C][C](NA )[/C][C](NA )[/C][C](NA )[/C][C](NA )[/C][C](NA )[/C][/ROW]
[ROW][C]Estimates ( 13 )[/C][C]NA[/C][C]NA[/C][C]NA[/C][C]NA[/C][C]NA[/C][C]NA[/C][C]NA[/C][/ROW]
[ROW][C](p-val)[/C][C](NA )[/C][C](NA )[/C][C](NA )[/C][C](NA )[/C][C](NA )[/C][C](NA )[/C][C](NA )[/C][/ROW]
[/TABLE]
Source: https://freestatistics.org/blog/index.php?pk=298987&T=1

Globally Unique Identifier (entire table): ba.freestatistics.org/blog/index.php?pk=298987&T=1

As an alternative you can also use a QR Code:  

The GUIDs for individual cells are displayed in the table below:

ARIMA Parameter Estimation and Backward Selection
Iterationar1ar2ar3ma1sar1sar2sma1
Estimates ( 1 )0.13510.15270.2742-0.24-0.8347-0.42070.1661
(p-val)(0.5873 )(0.124 )(0.0126 )(0.331 )(0.0676 )(0.0865 )(0.753 )
Estimates ( 2 )0.11740.15320.2756-0.2272-0.6912-0.34520
(p-val)(0.6263 )(0.1213 )(0.0113 )(0.3471 )(0 )(0.0014 )(NA )
Estimates ( 3 )00.14870.2936-0.1186-0.6873-0.34510
(p-val)(NA )(0.128 )(0.0027 )(0.2354 )(0 )(0.0014 )(NA )
Estimates ( 4 )00.14450.28580-0.7142-0.34770
(p-val)(NA )(0.1385 )(0.0037 )(NA )(0 )(0.0012 )(NA )
Estimates ( 5 )000.28650-0.7031-0.31240
(p-val)(NA )(NA )(0.0039 )(NA )(0 )(0.003 )(NA )
Estimates ( 6 )NANANANANANANA
(p-val)(NA )(NA )(NA )(NA )(NA )(NA )(NA )
Estimates ( 7 )NANANANANANANA
(p-val)(NA )(NA )(NA )(NA )(NA )(NA )(NA )
Estimates ( 8 )NANANANANANANA
(p-val)(NA )(NA )(NA )(NA )(NA )(NA )(NA )
Estimates ( 9 )NANANANANANANA
(p-val)(NA )(NA )(NA )(NA )(NA )(NA )(NA )
Estimates ( 10 )NANANANANANANA
(p-val)(NA )(NA )(NA )(NA )(NA )(NA )(NA )
Estimates ( 11 )NANANANANANANA
(p-val)(NA )(NA )(NA )(NA )(NA )(NA )(NA )
Estimates ( 12 )NANANANANANANA
(p-val)(NA )(NA )(NA )(NA )(NA )(NA )(NA )
Estimates ( 13 )NANANANANANANA
(p-val)(NA )(NA )(NA )(NA )(NA )(NA )(NA )


Estimated ARIMA Residuals
Value
-10.7701819234182
7.57320271116518
-4.08861067841824
-16.3023005925966
-21.5969960977475
15.3863500945102
-36.5417984940933
11.9756165608503
-92.5725260566073
-49.373538927699
-16.4475794725592
-1.22397707960633
-62.7937200550385
16.213468907441
-6.43720601963881
14.4357522714671
-24.1965929714374
-31.3307048600015
-64.4856252680902
13.5556970226727
-47.9902642770314
-55.8962492321993
91.6949040028753
21.2771300470922
-23.9023905908823
-71.8500066217499
-101.434839038102
43.5248444394174
-33.839760447261
-8.01673139584864
-9.5651505188974
33.4462870925723
-2.0945716690837
2.13956717049393
-13.0016947495878
53.9797629961145
-88.8280780380081
96.9605437813805
0.792178906512467
-25.5257059520084
13.5616961795565
63.7874697282168
-87.712284924507
9.68128594952577
7.95251660273425
147.299780212802
-57.4132882270769
8.08566260030875
-27.0784904268976
-4.94316114339108
8.55835627003035
29.0598140961693
33.0345985694457
16.4778047840628
-58.5208791205605
-6.33954382319553
34.4281328622546
-7.19281862271873
-9.37934008635784
-3.79007368399562
18.7225409535522
-68.9486458683432
-30.3171276071616
78.3298551401532
-40.5791131638398
-6.15610241892318
-142.078325142653
66.8876434261119
-42.1140870044374
-93.3420235241683
-33.037062925644
56.8412803912242
-76.3069958641227
56.2749236399204
58.219506664037
-137.737314303147
89.2892769705613
27.4541149762645
0.917846373334215
-3.69670290513204
-12.3848146227692
-66.2843078828764
-147.089656738779
-61.7914351578029
-24.3208563797098
-30.7560248788986
-30.799588687607
85.5465157477439
22.6967372129165
61.1649907327683
37.6478303643153
2.67342596304297
9.92986873511745
19.0903015553031
-19.8576886127566
-81.6841443760778
-8.63783870613679
93.077631697327
78.9069730203792
-38.5771348831232
44.4974252527036
-84.4929781919236
63.5810438765593
-3.5052784285981

\begin{tabular}{lllllllll}
\hline
Estimated ARIMA Residuals \tabularnewline
Value \tabularnewline
-10.7701819234182 \tabularnewline
7.57320271116518 \tabularnewline
-4.08861067841824 \tabularnewline
-16.3023005925966 \tabularnewline
-21.5969960977475 \tabularnewline
15.3863500945102 \tabularnewline
-36.5417984940933 \tabularnewline
11.9756165608503 \tabularnewline
-92.5725260566073 \tabularnewline
-49.373538927699 \tabularnewline
-16.4475794725592 \tabularnewline
-1.22397707960633 \tabularnewline
-62.7937200550385 \tabularnewline
16.213468907441 \tabularnewline
-6.43720601963881 \tabularnewline
14.4357522714671 \tabularnewline
-24.1965929714374 \tabularnewline
-31.3307048600015 \tabularnewline
-64.4856252680902 \tabularnewline
13.5556970226727 \tabularnewline
-47.9902642770314 \tabularnewline
-55.8962492321993 \tabularnewline
91.6949040028753 \tabularnewline
21.2771300470922 \tabularnewline
-23.9023905908823 \tabularnewline
-71.8500066217499 \tabularnewline
-101.434839038102 \tabularnewline
43.5248444394174 \tabularnewline
-33.839760447261 \tabularnewline
-8.01673139584864 \tabularnewline
-9.5651505188974 \tabularnewline
33.4462870925723 \tabularnewline
-2.0945716690837 \tabularnewline
2.13956717049393 \tabularnewline
-13.0016947495878 \tabularnewline
53.9797629961145 \tabularnewline
-88.8280780380081 \tabularnewline
96.9605437813805 \tabularnewline
0.792178906512467 \tabularnewline
-25.5257059520084 \tabularnewline
13.5616961795565 \tabularnewline
63.7874697282168 \tabularnewline
-87.712284924507 \tabularnewline
9.68128594952577 \tabularnewline
7.95251660273425 \tabularnewline
147.299780212802 \tabularnewline
-57.4132882270769 \tabularnewline
8.08566260030875 \tabularnewline
-27.0784904268976 \tabularnewline
-4.94316114339108 \tabularnewline
8.55835627003035 \tabularnewline
29.0598140961693 \tabularnewline
33.0345985694457 \tabularnewline
16.4778047840628 \tabularnewline
-58.5208791205605 \tabularnewline
-6.33954382319553 \tabularnewline
34.4281328622546 \tabularnewline
-7.19281862271873 \tabularnewline
-9.37934008635784 \tabularnewline
-3.79007368399562 \tabularnewline
18.7225409535522 \tabularnewline
-68.9486458683432 \tabularnewline
-30.3171276071616 \tabularnewline
78.3298551401532 \tabularnewline
-40.5791131638398 \tabularnewline
-6.15610241892318 \tabularnewline
-142.078325142653 \tabularnewline
66.8876434261119 \tabularnewline
-42.1140870044374 \tabularnewline
-93.3420235241683 \tabularnewline
-33.037062925644 \tabularnewline
56.8412803912242 \tabularnewline
-76.3069958641227 \tabularnewline
56.2749236399204 \tabularnewline
58.219506664037 \tabularnewline
-137.737314303147 \tabularnewline
89.2892769705613 \tabularnewline
27.4541149762645 \tabularnewline
0.917846373334215 \tabularnewline
-3.69670290513204 \tabularnewline
-12.3848146227692 \tabularnewline
-66.2843078828764 \tabularnewline
-147.089656738779 \tabularnewline
-61.7914351578029 \tabularnewline
-24.3208563797098 \tabularnewline
-30.7560248788986 \tabularnewline
-30.799588687607 \tabularnewline
85.5465157477439 \tabularnewline
22.6967372129165 \tabularnewline
61.1649907327683 \tabularnewline
37.6478303643153 \tabularnewline
2.67342596304297 \tabularnewline
9.92986873511745 \tabularnewline
19.0903015553031 \tabularnewline
-19.8576886127566 \tabularnewline
-81.6841443760778 \tabularnewline
-8.63783870613679 \tabularnewline
93.077631697327 \tabularnewline
78.9069730203792 \tabularnewline
-38.5771348831232 \tabularnewline
44.4974252527036 \tabularnewline
-84.4929781919236 \tabularnewline
63.5810438765593 \tabularnewline
-3.5052784285981 \tabularnewline
\hline
\end{tabular}
%Source: https://freestatistics.org/blog/index.php?pk=298987&T=2

[TABLE]
[ROW][C]Estimated ARIMA Residuals[/C][/ROW]
[ROW][C]Value[/C][/ROW]
[ROW][C]-10.7701819234182[/C][/ROW]
[ROW][C]7.57320271116518[/C][/ROW]
[ROW][C]-4.08861067841824[/C][/ROW]
[ROW][C]-16.3023005925966[/C][/ROW]
[ROW][C]-21.5969960977475[/C][/ROW]
[ROW][C]15.3863500945102[/C][/ROW]
[ROW][C]-36.5417984940933[/C][/ROW]
[ROW][C]11.9756165608503[/C][/ROW]
[ROW][C]-92.5725260566073[/C][/ROW]
[ROW][C]-49.373538927699[/C][/ROW]
[ROW][C]-16.4475794725592[/C][/ROW]
[ROW][C]-1.22397707960633[/C][/ROW]
[ROW][C]-62.7937200550385[/C][/ROW]
[ROW][C]16.213468907441[/C][/ROW]
[ROW][C]-6.43720601963881[/C][/ROW]
[ROW][C]14.4357522714671[/C][/ROW]
[ROW][C]-24.1965929714374[/C][/ROW]
[ROW][C]-31.3307048600015[/C][/ROW]
[ROW][C]-64.4856252680902[/C][/ROW]
[ROW][C]13.5556970226727[/C][/ROW]
[ROW][C]-47.9902642770314[/C][/ROW]
[ROW][C]-55.8962492321993[/C][/ROW]
[ROW][C]91.6949040028753[/C][/ROW]
[ROW][C]21.2771300470922[/C][/ROW]
[ROW][C]-23.9023905908823[/C][/ROW]
[ROW][C]-71.8500066217499[/C][/ROW]
[ROW][C]-101.434839038102[/C][/ROW]
[ROW][C]43.5248444394174[/C][/ROW]
[ROW][C]-33.839760447261[/C][/ROW]
[ROW][C]-8.01673139584864[/C][/ROW]
[ROW][C]-9.5651505188974[/C][/ROW]
[ROW][C]33.4462870925723[/C][/ROW]
[ROW][C]-2.0945716690837[/C][/ROW]
[ROW][C]2.13956717049393[/C][/ROW]
[ROW][C]-13.0016947495878[/C][/ROW]
[ROW][C]53.9797629961145[/C][/ROW]
[ROW][C]-88.8280780380081[/C][/ROW]
[ROW][C]96.9605437813805[/C][/ROW]
[ROW][C]0.792178906512467[/C][/ROW]
[ROW][C]-25.5257059520084[/C][/ROW]
[ROW][C]13.5616961795565[/C][/ROW]
[ROW][C]63.7874697282168[/C][/ROW]
[ROW][C]-87.712284924507[/C][/ROW]
[ROW][C]9.68128594952577[/C][/ROW]
[ROW][C]7.95251660273425[/C][/ROW]
[ROW][C]147.299780212802[/C][/ROW]
[ROW][C]-57.4132882270769[/C][/ROW]
[ROW][C]8.08566260030875[/C][/ROW]
[ROW][C]-27.0784904268976[/C][/ROW]
[ROW][C]-4.94316114339108[/C][/ROW]
[ROW][C]8.55835627003035[/C][/ROW]
[ROW][C]29.0598140961693[/C][/ROW]
[ROW][C]33.0345985694457[/C][/ROW]
[ROW][C]16.4778047840628[/C][/ROW]
[ROW][C]-58.5208791205605[/C][/ROW]
[ROW][C]-6.33954382319553[/C][/ROW]
[ROW][C]34.4281328622546[/C][/ROW]
[ROW][C]-7.19281862271873[/C][/ROW]
[ROW][C]-9.37934008635784[/C][/ROW]
[ROW][C]-3.79007368399562[/C][/ROW]
[ROW][C]18.7225409535522[/C][/ROW]
[ROW][C]-68.9486458683432[/C][/ROW]
[ROW][C]-30.3171276071616[/C][/ROW]
[ROW][C]78.3298551401532[/C][/ROW]
[ROW][C]-40.5791131638398[/C][/ROW]
[ROW][C]-6.15610241892318[/C][/ROW]
[ROW][C]-142.078325142653[/C][/ROW]
[ROW][C]66.8876434261119[/C][/ROW]
[ROW][C]-42.1140870044374[/C][/ROW]
[ROW][C]-93.3420235241683[/C][/ROW]
[ROW][C]-33.037062925644[/C][/ROW]
[ROW][C]56.8412803912242[/C][/ROW]
[ROW][C]-76.3069958641227[/C][/ROW]
[ROW][C]56.2749236399204[/C][/ROW]
[ROW][C]58.219506664037[/C][/ROW]
[ROW][C]-137.737314303147[/C][/ROW]
[ROW][C]89.2892769705613[/C][/ROW]
[ROW][C]27.4541149762645[/C][/ROW]
[ROW][C]0.917846373334215[/C][/ROW]
[ROW][C]-3.69670290513204[/C][/ROW]
[ROW][C]-12.3848146227692[/C][/ROW]
[ROW][C]-66.2843078828764[/C][/ROW]
[ROW][C]-147.089656738779[/C][/ROW]
[ROW][C]-61.7914351578029[/C][/ROW]
[ROW][C]-24.3208563797098[/C][/ROW]
[ROW][C]-30.7560248788986[/C][/ROW]
[ROW][C]-30.799588687607[/C][/ROW]
[ROW][C]85.5465157477439[/C][/ROW]
[ROW][C]22.6967372129165[/C][/ROW]
[ROW][C]61.1649907327683[/C][/ROW]
[ROW][C]37.6478303643153[/C][/ROW]
[ROW][C]2.67342596304297[/C][/ROW]
[ROW][C]9.92986873511745[/C][/ROW]
[ROW][C]19.0903015553031[/C][/ROW]
[ROW][C]-19.8576886127566[/C][/ROW]
[ROW][C]-81.6841443760778[/C][/ROW]
[ROW][C]-8.63783870613679[/C][/ROW]
[ROW][C]93.077631697327[/C][/ROW]
[ROW][C]78.9069730203792[/C][/ROW]
[ROW][C]-38.5771348831232[/C][/ROW]
[ROW][C]44.4974252527036[/C][/ROW]
[ROW][C]-84.4929781919236[/C][/ROW]
[ROW][C]63.5810438765593[/C][/ROW]
[ROW][C]-3.5052784285981[/C][/ROW]
[/TABLE]
Source: https://freestatistics.org/blog/index.php?pk=298987&T=2

Globally Unique Identifier (entire table): ba.freestatistics.org/blog/index.php?pk=298987&T=2

As an alternative you can also use a QR Code:  

The GUIDs for individual cells are displayed in the table below:

Estimated ARIMA Residuals
Value
-10.7701819234182
7.57320271116518
-4.08861067841824
-16.3023005925966
-21.5969960977475
15.3863500945102
-36.5417984940933
11.9756165608503
-92.5725260566073
-49.373538927699
-16.4475794725592
-1.22397707960633
-62.7937200550385
16.213468907441
-6.43720601963881
14.4357522714671
-24.1965929714374
-31.3307048600015
-64.4856252680902
13.5556970226727
-47.9902642770314
-55.8962492321993
91.6949040028753
21.2771300470922
-23.9023905908823
-71.8500066217499
-101.434839038102
43.5248444394174
-33.839760447261
-8.01673139584864
-9.5651505188974
33.4462870925723
-2.0945716690837
2.13956717049393
-13.0016947495878
53.9797629961145
-88.8280780380081
96.9605437813805
0.792178906512467
-25.5257059520084
13.5616961795565
63.7874697282168
-87.712284924507
9.68128594952577
7.95251660273425
147.299780212802
-57.4132882270769
8.08566260030875
-27.0784904268976
-4.94316114339108
8.55835627003035
29.0598140961693
33.0345985694457
16.4778047840628
-58.5208791205605
-6.33954382319553
34.4281328622546
-7.19281862271873
-9.37934008635784
-3.79007368399562
18.7225409535522
-68.9486458683432
-30.3171276071616
78.3298551401532
-40.5791131638398
-6.15610241892318
-142.078325142653
66.8876434261119
-42.1140870044374
-93.3420235241683
-33.037062925644
56.8412803912242
-76.3069958641227
56.2749236399204
58.219506664037
-137.737314303147
89.2892769705613
27.4541149762645
0.917846373334215
-3.69670290513204
-12.3848146227692
-66.2843078828764
-147.089656738779
-61.7914351578029
-24.3208563797098
-30.7560248788986
-30.799588687607
85.5465157477439
22.6967372129165
61.1649907327683
37.6478303643153
2.67342596304297
9.92986873511745
19.0903015553031
-19.8576886127566
-81.6841443760778
-8.63783870613679
93.077631697327
78.9069730203792
-38.5771348831232
44.4974252527036
-84.4929781919236
63.5810438765593
-3.5052784285981


Parameters (Session):
par1 = FALSE ; par2 = 1 ; par3 = 1 ; par4 = 1 ; par5 = 12 ; par6 = 3 ; par7 = 1 ; par8 = 2 ; par9 = 1 ;
Parameters (R input):
par1 = FALSE ; par2 = 1 ; par3 = 1 ; par4 = 1 ; par5 = 12 ; par6 = 3 ; par7 = 1 ; par8 = 2 ; par9 = 1 ;
R code (references can be found in the software module):
par9 <- '1'
par8 <- '2'
par7 <- '1'
par6 <- '3'
par5 <- '12'
par4 <- '1'
par3 <- '1'
par2 <- '1'
par1 <- 'FALSE'
library(lattice)
if (par1 == 'TRUE') par1 <- TRUE
if (par1 == 'FALSE') par1 <- FALSE
par2 <- as.numeric(par2) #Box-Cox lambda transformation parameter
par3 <- as.numeric(par3) #degree of non-seasonal differencing
par4 <- as.numeric(par4) #degree of seasonal differencing
par5 <- as.numeric(par5) #seasonal period
par6 <- as.numeric(par6) #degree (p) of the non-seasonal AR(p) polynomial
par7 <- as.numeric(par7) #degree (q) of the non-seasonal MA(q) polynomial
par8 <- as.numeric(par8) #degree (P) of the seasonal AR(P) polynomial
par9 <- as.numeric(par9) #degree (Q) of the seasonal MA(Q) polynomial
armaGR <- function(arima.out, names, n){
try1 <- arima.out$coef
try2 <- sqrt(diag(arima.out$var.coef))
try.data.frame <- data.frame(matrix(NA,ncol=4,nrow=length(names)))
dimnames(try.data.frame) <- list(names,c('coef','std','tstat','pv'))
try.data.frame[,1] <- try1
for(i in 1:length(try2)) try.data.frame[which(rownames(try.data.frame)==names(try2)[i]),2] <- try2[i]
try.data.frame[,3] <- try.data.frame[,1] / try.data.frame[,2]
try.data.frame[,4] <- round((1-pt(abs(try.data.frame[,3]),df=n-(length(try2)+1)))*2,5)
vector <- rep(NA,length(names))
vector[is.na(try.data.frame[,4])] <- 0
maxi <- which.max(try.data.frame[,4])
continue <- max(try.data.frame[,4],na.rm=TRUE) > .05
vector[maxi] <- 0
list(summary=try.data.frame,next.vector=vector,continue=continue)
}
arimaSelect <- function(series, order=c(13,0,0), seasonal=list(order=c(2,0,0),period=12), include.mean=F){
nrc <- order[1]+order[3]+seasonal$order[1]+seasonal$order[3]
coeff <- matrix(NA, nrow=nrc*2, ncol=nrc)
pval <- matrix(NA, nrow=nrc*2, ncol=nrc)
mylist <- rep(list(NULL), nrc)
names <- NULL
if(order[1] > 0) names <- paste('ar',1:order[1],sep='')
if(order[3] > 0) names <- c( names , paste('ma',1:order[3],sep='') )
if(seasonal$order[1] > 0) names <- c(names, paste('sar',1:seasonal$order[1],sep=''))
if(seasonal$order[3] > 0) names <- c(names, paste('sma',1:seasonal$order[3],sep=''))
arima.out <- arima(series, order=order, seasonal=seasonal, include.mean=include.mean, method='ML')
mylist[[1]] <- arima.out
last.arma <- armaGR(arima.out, names, length(series))
mystop <- FALSE
i <- 1
coeff[i,] <- last.arma[[1]][,1]
pval [i,] <- last.arma[[1]][,4]
i <- 2
aic <- arima.out$aic
while(!mystop){
mylist[[i]] <- arima.out
arima.out <- arima(series, order=order, seasonal=seasonal, include.mean=include.mean, method='ML', fixed=last.arma$next.vector)
aic <- c(aic, arima.out$aic)
last.arma <- armaGR(arima.out, names, length(series))
mystop <- !last.arma$continue
coeff[i,] <- last.arma[[1]][,1]
pval [i,] <- last.arma[[1]][,4]
i <- i+1
}
list(coeff, pval, mylist, aic=aic)
}
arimaSelectplot <- function(arimaSelect.out,noms,choix){
noms <- names(arimaSelect.out[[3]][[1]]$coef)
coeff <- arimaSelect.out[[1]]
k <- min(which(is.na(coeff[,1])))-1
coeff <- coeff[1:k,]
pval <- arimaSelect.out[[2]][1:k,]
aic <- arimaSelect.out$aic[1:k]
coeff[coeff==0] <- NA
n <- ncol(coeff)
if(missing(choix)) choix <- k
layout(matrix(c(1,1,1,2,
3,3,3,2,
3,3,3,4,
5,6,7,7),nr=4),
widths=c(10,35,45,15),
heights=c(30,30,15,15))
couleurs <- rainbow(75)[1:50]#(50)
ticks <- pretty(coeff)
par(mar=c(1,1,3,1))
plot(aic,k:1-.5,type='o',pch=21,bg='blue',cex=2,axes=F,lty=2,xpd=NA)
points(aic[choix],k-choix+.5,pch=21,cex=4,bg=2,xpd=NA)
title('aic',line=2)
par(mar=c(3,0,0,0))
plot(0,axes=F,xlab='',ylab='',xlim=range(ticks),ylim=c(.1,1))
rect(xleft = min(ticks) + (0:49)/50*(max(ticks)-min(ticks)),
xright = min(ticks) + (1:50)/50*(max(ticks)-min(ticks)),
ytop = rep(1,50),
ybottom= rep(0,50),col=couleurs,border=NA)
axis(1,ticks)
rect(xleft=min(ticks),xright=max(ticks),ytop=1,ybottom=0)
text(mean(coeff,na.rm=T),.5,'coefficients',cex=2,font=2)
par(mar=c(1,1,3,1))
image(1:n,1:k,t(coeff[k:1,]),axes=F,col=couleurs,zlim=range(ticks))
for(i in 1:n) for(j in 1:k) if(!is.na(coeff[j,i])) {
if(pval[j,i]<.01) symb = 'green'
else if( (pval[j,i]<.05) & (pval[j,i]>=.01)) symb = 'orange'
else if( (pval[j,i]<.1) & (pval[j,i]>=.05)) symb = 'red'
else symb = 'black'
polygon(c(i+.5 ,i+.2 ,i+.5 ,i+.5),
c(k-j+0.5,k-j+0.5,k-j+0.8,k-j+0.5),
col=symb)
if(j==choix) {
rect(xleft=i-.5,
xright=i+.5,
ybottom=k-j+1.5,
ytop=k-j+.5,
lwd=4)
text(i,
k-j+1,
round(coeff[j,i],2),
cex=1.2,
font=2)
}
else{
rect(xleft=i-.5,xright=i+.5,ybottom=k-j+1.5,ytop=k-j+.5)
text(i,k-j+1,round(coeff[j,i],2),cex=1.2,font=1)
}
}
axis(3,1:n,noms)
par(mar=c(0.5,0,0,0.5))
plot(0,axes=F,xlab='',ylab='',type='n',xlim=c(0,8),ylim=c(-.2,.8))
cols <- c('green','orange','red','black')
niv <- c('0','0.01','0.05','0.1')
for(i in 0:3){
polygon(c(1+2*i ,1+2*i ,1+2*i-.5 ,1+2*i),
c(.4 ,.7 , .4 , .4),
col=cols[i+1])
text(2*i,0.5,niv[i+1],cex=1.5)
}
text(8,.5,1,cex=1.5)
text(4,0,'p-value',cex=2)
box()
residus <- arimaSelect.out[[3]][[choix]]$res
par(mar=c(1,2,4,1))
acf(residus,main='')
title('acf',line=.5)
par(mar=c(1,2,4,1))
pacf(residus,main='')
title('pacf',line=.5)
par(mar=c(2,2,4,1))
qqnorm(residus,main='')
title('qq-norm',line=.5)
qqline(residus)
residus
}
if (par2 == 0) x <- log(x)
if (par2 != 0) x <- x^par2
(selection <- arimaSelect(x, order=c(par6,par3,par7), seasonal=list(order=c(par8,par4,par9), period=par5)))
bitmap(file='test1.png')
resid <- arimaSelectplot(selection)
dev.off()
resid
bitmap(file='test2.png')
acf(resid,length(resid)/2, main='Residual Autocorrelation Function')
dev.off()
bitmap(file='test3.png')
pacf(resid,length(resid)/2, main='Residual Partial Autocorrelation Function')
dev.off()
bitmap(file='test4.png')
cpgram(resid, main='Residual Cumulative Periodogram')
dev.off()
bitmap(file='test5.png')
hist(resid, main='Residual Histogram', xlab='values of Residuals')
dev.off()
bitmap(file='test6.png')
densityplot(~resid,col='black',main='Residual Density Plot', xlab='values of Residuals')
dev.off()
bitmap(file='test7.png')
qqnorm(resid, main='Residual Normal Q-Q Plot')
qqline(resid)
dev.off()
ncols <- length(selection[[1]][1,])
nrows <- length(selection[[2]][,1])-1
load(file='createtable')
a<-table.start()
a<-table.row.start(a)
a<-table.element(a,'ARIMA Parameter Estimation and Backward Selection', ncols+1,TRUE)
a<-table.row.end(a)
a<-table.row.start(a)
a<-table.element(a,'Iteration', header=TRUE)
for (i in 1:ncols) {
a<-table.element(a,names(selection[[3]][[1]]$coef)[i],header=TRUE)
}
a<-table.row.end(a)
for (j in 1:nrows) {
a<-table.row.start(a)
mydum <- 'Estimates ('
mydum <- paste(mydum,j)
mydum <- paste(mydum,')')
a<-table.element(a,mydum, header=TRUE)
for (i in 1:ncols) {
a<-table.element(a,round(selection[[1]][j,i],4))
}
a<-table.row.end(a)
a<-table.row.start(a)
a<-table.element(a,'(p-val)', header=TRUE)
for (i in 1:ncols) {
mydum <- '('
mydum <- paste(mydum,round(selection[[2]][j,i],4),sep='')
mydum <- paste(mydum,')')
a<-table.element(a,mydum)
}
a<-table.row.end(a)
}
a<-table.end(a)
table.save(a,file='mytable.tab')
a<-table.start()
a<-table.row.start(a)
a<-table.element(a,'Estimated ARIMA Residuals', 1,TRUE)
a<-table.row.end(a)
a<-table.row.start(a)
a<-table.element(a,'Value', 1,TRUE)
a<-table.row.end(a)
for (i in (par4*par5+par3):length(resid)) {
a<-table.row.start(a)
a<-table.element(a,resid[i])
a<-table.row.end(a)
}
a<-table.end(a)
table.save(a,file='mytable1.tab')