Free Statistics

of Irreproducible Research!

Author's title

Author*The author of this computation has been verified*
R Software Modulerwasp_decompose.wasp
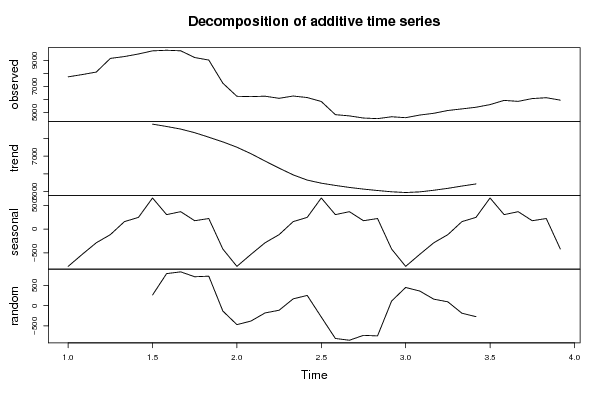
Title produced by softwareClassical Decomposition
Date of computationMon, 12 Dec 2016 19:53:21 +0100
Cite this page as followsStatistical Computations at FreeStatistics.org, Office for Research Development and Education, URL https://freestatistics.org/blog/index.php?v=date/2016/Dec/12/t1481568879ym8j238a1okiv43.htm/, Retrieved Fri, 01 Nov 2024 03:44:29 +0000
Statistical Computations at FreeStatistics.org, Office for Research Development and Education, URL https://freestatistics.org/blog/index.php?pk=298975, Retrieved Fri, 01 Nov 2024 03:44:29 +0000
QR Codes:

Original text written by user:
IsPrivate?No (this computation is public)
User-defined keywords
Estimated Impact102
Family? (F = Feedback message, R = changed R code, M = changed R Module, P = changed Parameters, D = changed Data)
-       [Classical Decomposition] [time series kolom...] [2016-12-12 18:53:21] [74a1aee5dc3270c40ddc0c460955e440] [Current]
Feedback Forum

Post a new message
Dataseries X:
7732.01
7905.27
8098.32
9143.32
9283.07
9480.25
9720.24
9765.41
9724.25
9207.97
9015.39
7244.45
6243.13
6218.68
6251.37
6088.65
6265.25
6146.75
5846.79
4839.25
4744.82
4581.5
4534.04
4678.62
4607.46
4808.33
4944.31
5157.91
5280.66
5405.02
5609.6
5930.32
5855.98
6069.38
6135.39
5949.96


Summary of computational transaction
Raw Input view raw input (R code)
Raw Outputview raw output of R engine
Computing time1 seconds
R ServerBig Analytics Cloud Computing Center

\begin{tabular}{lllllllll}
\hline
Summary of computational transaction \tabularnewline
Raw Input view raw input (R code)  \tabularnewline
Raw Outputview raw output of R engine  \tabularnewline
Computing time1 seconds \tabularnewline
R ServerBig Analytics Cloud Computing Center \tabularnewline
\hline
\end{tabular}
%Source: https://freestatistics.org/blog/index.php?pk=298975&T=0

[TABLE]
[ROW]
Summary of computational transaction[/C][/ROW] [ROW]Raw Input[/C] view raw input (R code) [/C][/ROW] [ROW]Raw Output[/C]view raw output of R engine [/C][/ROW] [ROW]Computing time[/C]1 seconds[/C][/ROW] [ROW]R Server[/C]Big Analytics Cloud Computing Center[/C][/ROW] [/TABLE] Source: https://freestatistics.org/blog/index.php?pk=298975&T=0

Globally Unique Identifier (entire table): ba.freestatistics.org/blog/index.php?pk=298975&T=0

As an alternative you can also use a QR Code:  

The GUIDs for individual cells are displayed in the table below:

Summary of computational transaction
Raw Input view raw input (R code)
Raw Outputview raw output of R engine
Computing time1 seconds
R ServerBig Analytics Cloud Computing Center


Classical Decomposition by Moving Averages
tObservationsFitTrendSeasonalRandom
17732.01NANA-786.274NA
27905.27NANA-532.528NA
38098.32NANA-287.707NA
49143.32NANA-116.29NA
59283.07NANA158.772NA
69480.25NANA248.67NA
79720.249456.098797.96658.129264.152
89765.418972.218665.65306.558793.204
99724.258887.418518.42368.992836.841
109207.978492.118314.18177.93715.858
119015.398285.488061.16224.322729.905
127244.457375.957796.52-420.573-131.501
136243.136709.967496.23-786.274-466.83
146218.686597.067129.58-532.528-378.376
156251.376429.146716.85-287.707-177.775
166088.656200.316316.61-116.29-111.665
176265.256095.885937.11158.772169.365
186146.755892.155643.48248.67254.599
195846.796126.555468.42658.129-279.757
204839.255648.065341.5306.558-808.809
214744.825597.275228.27368.992-852.447
224581.55312.965135.03177.93-731.463
234534.045279.555055.23224.322-745.51
244678.624562.724983.3-420.573115.895
254607.464156.244942.51-786.274451.225
264808.334445.564978.09-532.528362.77
274944.314782.145069.85-287.707162.169
285157.915061.855178.14-116.2996.0596
295280.665465.635306.86158.772-184.971
305405.025675.225426.55248.67-270.205
315609.6NANA658.129NA
325930.32NANA306.558NA
335855.98NANA368.992NA
346069.38NANA177.93NA
356135.39NANA224.322NA
365949.96NANA-420.573NA

\begin{tabular}{lllllllll}
\hline
Classical Decomposition by Moving Averages \tabularnewline
t & Observations & Fit & Trend & Seasonal & Random \tabularnewline
1 & 7732.01 & NA & NA & -786.274 & NA \tabularnewline
2 & 7905.27 & NA & NA & -532.528 & NA \tabularnewline
3 & 8098.32 & NA & NA & -287.707 & NA \tabularnewline
4 & 9143.32 & NA & NA & -116.29 & NA \tabularnewline
5 & 9283.07 & NA & NA & 158.772 & NA \tabularnewline
6 & 9480.25 & NA & NA & 248.67 & NA \tabularnewline
7 & 9720.24 & 9456.09 & 8797.96 & 658.129 & 264.152 \tabularnewline
8 & 9765.41 & 8972.21 & 8665.65 & 306.558 & 793.204 \tabularnewline
9 & 9724.25 & 8887.41 & 8518.42 & 368.992 & 836.841 \tabularnewline
10 & 9207.97 & 8492.11 & 8314.18 & 177.93 & 715.858 \tabularnewline
11 & 9015.39 & 8285.48 & 8061.16 & 224.322 & 729.905 \tabularnewline
12 & 7244.45 & 7375.95 & 7796.52 & -420.573 & -131.501 \tabularnewline
13 & 6243.13 & 6709.96 & 7496.23 & -786.274 & -466.83 \tabularnewline
14 & 6218.68 & 6597.06 & 7129.58 & -532.528 & -378.376 \tabularnewline
15 & 6251.37 & 6429.14 & 6716.85 & -287.707 & -177.775 \tabularnewline
16 & 6088.65 & 6200.31 & 6316.61 & -116.29 & -111.665 \tabularnewline
17 & 6265.25 & 6095.88 & 5937.11 & 158.772 & 169.365 \tabularnewline
18 & 6146.75 & 5892.15 & 5643.48 & 248.67 & 254.599 \tabularnewline
19 & 5846.79 & 6126.55 & 5468.42 & 658.129 & -279.757 \tabularnewline
20 & 4839.25 & 5648.06 & 5341.5 & 306.558 & -808.809 \tabularnewline
21 & 4744.82 & 5597.27 & 5228.27 & 368.992 & -852.447 \tabularnewline
22 & 4581.5 & 5312.96 & 5135.03 & 177.93 & -731.463 \tabularnewline
23 & 4534.04 & 5279.55 & 5055.23 & 224.322 & -745.51 \tabularnewline
24 & 4678.62 & 4562.72 & 4983.3 & -420.573 & 115.895 \tabularnewline
25 & 4607.46 & 4156.24 & 4942.51 & -786.274 & 451.225 \tabularnewline
26 & 4808.33 & 4445.56 & 4978.09 & -532.528 & 362.77 \tabularnewline
27 & 4944.31 & 4782.14 & 5069.85 & -287.707 & 162.169 \tabularnewline
28 & 5157.91 & 5061.85 & 5178.14 & -116.29 & 96.0596 \tabularnewline
29 & 5280.66 & 5465.63 & 5306.86 & 158.772 & -184.971 \tabularnewline
30 & 5405.02 & 5675.22 & 5426.55 & 248.67 & -270.205 \tabularnewline
31 & 5609.6 & NA & NA & 658.129 & NA \tabularnewline
32 & 5930.32 & NA & NA & 306.558 & NA \tabularnewline
33 & 5855.98 & NA & NA & 368.992 & NA \tabularnewline
34 & 6069.38 & NA & NA & 177.93 & NA \tabularnewline
35 & 6135.39 & NA & NA & 224.322 & NA \tabularnewline
36 & 5949.96 & NA & NA & -420.573 & NA \tabularnewline
\hline
\end{tabular}
%Source: https://freestatistics.org/blog/index.php?pk=298975&T=1

[TABLE]
[ROW][C]Classical Decomposition by Moving Averages[/C][/ROW]
[ROW][C]t[/C][C]Observations[/C][C]Fit[/C][C]Trend[/C][C]Seasonal[/C][C]Random[/C][/ROW]
[ROW][C]1[/C][C]7732.01[/C][C]NA[/C][C]NA[/C][C]-786.274[/C][C]NA[/C][/ROW]
[ROW][C]2[/C][C]7905.27[/C][C]NA[/C][C]NA[/C][C]-532.528[/C][C]NA[/C][/ROW]
[ROW][C]3[/C][C]8098.32[/C][C]NA[/C][C]NA[/C][C]-287.707[/C][C]NA[/C][/ROW]
[ROW][C]4[/C][C]9143.32[/C][C]NA[/C][C]NA[/C][C]-116.29[/C][C]NA[/C][/ROW]
[ROW][C]5[/C][C]9283.07[/C][C]NA[/C][C]NA[/C][C]158.772[/C][C]NA[/C][/ROW]
[ROW][C]6[/C][C]9480.25[/C][C]NA[/C][C]NA[/C][C]248.67[/C][C]NA[/C][/ROW]
[ROW][C]7[/C][C]9720.24[/C][C]9456.09[/C][C]8797.96[/C][C]658.129[/C][C]264.152[/C][/ROW]
[ROW][C]8[/C][C]9765.41[/C][C]8972.21[/C][C]8665.65[/C][C]306.558[/C][C]793.204[/C][/ROW]
[ROW][C]9[/C][C]9724.25[/C][C]8887.41[/C][C]8518.42[/C][C]368.992[/C][C]836.841[/C][/ROW]
[ROW][C]10[/C][C]9207.97[/C][C]8492.11[/C][C]8314.18[/C][C]177.93[/C][C]715.858[/C][/ROW]
[ROW][C]11[/C][C]9015.39[/C][C]8285.48[/C][C]8061.16[/C][C]224.322[/C][C]729.905[/C][/ROW]
[ROW][C]12[/C][C]7244.45[/C][C]7375.95[/C][C]7796.52[/C][C]-420.573[/C][C]-131.501[/C][/ROW]
[ROW][C]13[/C][C]6243.13[/C][C]6709.96[/C][C]7496.23[/C][C]-786.274[/C][C]-466.83[/C][/ROW]
[ROW][C]14[/C][C]6218.68[/C][C]6597.06[/C][C]7129.58[/C][C]-532.528[/C][C]-378.376[/C][/ROW]
[ROW][C]15[/C][C]6251.37[/C][C]6429.14[/C][C]6716.85[/C][C]-287.707[/C][C]-177.775[/C][/ROW]
[ROW][C]16[/C][C]6088.65[/C][C]6200.31[/C][C]6316.61[/C][C]-116.29[/C][C]-111.665[/C][/ROW]
[ROW][C]17[/C][C]6265.25[/C][C]6095.88[/C][C]5937.11[/C][C]158.772[/C][C]169.365[/C][/ROW]
[ROW][C]18[/C][C]6146.75[/C][C]5892.15[/C][C]5643.48[/C][C]248.67[/C][C]254.599[/C][/ROW]
[ROW][C]19[/C][C]5846.79[/C][C]6126.55[/C][C]5468.42[/C][C]658.129[/C][C]-279.757[/C][/ROW]
[ROW][C]20[/C][C]4839.25[/C][C]5648.06[/C][C]5341.5[/C][C]306.558[/C][C]-808.809[/C][/ROW]
[ROW][C]21[/C][C]4744.82[/C][C]5597.27[/C][C]5228.27[/C][C]368.992[/C][C]-852.447[/C][/ROW]
[ROW][C]22[/C][C]4581.5[/C][C]5312.96[/C][C]5135.03[/C][C]177.93[/C][C]-731.463[/C][/ROW]
[ROW][C]23[/C][C]4534.04[/C][C]5279.55[/C][C]5055.23[/C][C]224.322[/C][C]-745.51[/C][/ROW]
[ROW][C]24[/C][C]4678.62[/C][C]4562.72[/C][C]4983.3[/C][C]-420.573[/C][C]115.895[/C][/ROW]
[ROW][C]25[/C][C]4607.46[/C][C]4156.24[/C][C]4942.51[/C][C]-786.274[/C][C]451.225[/C][/ROW]
[ROW][C]26[/C][C]4808.33[/C][C]4445.56[/C][C]4978.09[/C][C]-532.528[/C][C]362.77[/C][/ROW]
[ROW][C]27[/C][C]4944.31[/C][C]4782.14[/C][C]5069.85[/C][C]-287.707[/C][C]162.169[/C][/ROW]
[ROW][C]28[/C][C]5157.91[/C][C]5061.85[/C][C]5178.14[/C][C]-116.29[/C][C]96.0596[/C][/ROW]
[ROW][C]29[/C][C]5280.66[/C][C]5465.63[/C][C]5306.86[/C][C]158.772[/C][C]-184.971[/C][/ROW]
[ROW][C]30[/C][C]5405.02[/C][C]5675.22[/C][C]5426.55[/C][C]248.67[/C][C]-270.205[/C][/ROW]
[ROW][C]31[/C][C]5609.6[/C][C]NA[/C][C]NA[/C][C]658.129[/C][C]NA[/C][/ROW]
[ROW][C]32[/C][C]5930.32[/C][C]NA[/C][C]NA[/C][C]306.558[/C][C]NA[/C][/ROW]
[ROW][C]33[/C][C]5855.98[/C][C]NA[/C][C]NA[/C][C]368.992[/C][C]NA[/C][/ROW]
[ROW][C]34[/C][C]6069.38[/C][C]NA[/C][C]NA[/C][C]177.93[/C][C]NA[/C][/ROW]
[ROW][C]35[/C][C]6135.39[/C][C]NA[/C][C]NA[/C][C]224.322[/C][C]NA[/C][/ROW]
[ROW][C]36[/C][C]5949.96[/C][C]NA[/C][C]NA[/C][C]-420.573[/C][C]NA[/C][/ROW]
[/TABLE]
Source: https://freestatistics.org/blog/index.php?pk=298975&T=1

Globally Unique Identifier (entire table): ba.freestatistics.org/blog/index.php?pk=298975&T=1

As an alternative you can also use a QR Code:  

The GUIDs for individual cells are displayed in the table below:

Classical Decomposition by Moving Averages
tObservationsFitTrendSeasonalRandom
17732.01NANA-786.274NA
27905.27NANA-532.528NA
38098.32NANA-287.707NA
49143.32NANA-116.29NA
59283.07NANA158.772NA
69480.25NANA248.67NA
79720.249456.098797.96658.129264.152
89765.418972.218665.65306.558793.204
99724.258887.418518.42368.992836.841
109207.978492.118314.18177.93715.858
119015.398285.488061.16224.322729.905
127244.457375.957796.52-420.573-131.501
136243.136709.967496.23-786.274-466.83
146218.686597.067129.58-532.528-378.376
156251.376429.146716.85-287.707-177.775
166088.656200.316316.61-116.29-111.665
176265.256095.885937.11158.772169.365
186146.755892.155643.48248.67254.599
195846.796126.555468.42658.129-279.757
204839.255648.065341.5306.558-808.809
214744.825597.275228.27368.992-852.447
224581.55312.965135.03177.93-731.463
234534.045279.555055.23224.322-745.51
244678.624562.724983.3-420.573115.895
254607.464156.244942.51-786.274451.225
264808.334445.564978.09-532.528362.77
274944.314782.145069.85-287.707162.169
285157.915061.855178.14-116.2996.0596
295280.665465.635306.86158.772-184.971
305405.025675.225426.55248.67-270.205
315609.6NANA658.129NA
325930.32NANA306.558NA
335855.98NANA368.992NA
346069.38NANA177.93NA
356135.39NANA224.322NA
365949.96NANA-420.573NA


Parameters (Session):
par1 = additive ; par2 = 12 ;
Parameters (R input):
par1 = additive ; par2 = 12 ;
R code (references can be found in the software module):
par2 <- as.numeric(par2)
x <- ts(x,freq=par2)
m <- decompose(x,type=par1)
m$figure
bitmap(file='test1.png')
plot(m)
dev.off()
mylagmax <- length(x)/2
bitmap(file='test2.png')
op <- par(mfrow = c(2,2))
acf(as.numeric(x),lag.max = mylagmax,main='Observed')
acf(as.numeric(m$trend),na.action=na.pass,lag.max = mylagmax,main='Trend')
acf(as.numeric(m$seasonal),na.action=na.pass,lag.max = mylagmax,main='Seasonal')
acf(as.numeric(m$random),na.action=na.pass,lag.max = mylagmax,main='Random')
par(op)
dev.off()
bitmap(file='test3.png')
op <- par(mfrow = c(2,2))
spectrum(as.numeric(x),main='Observed')
spectrum(as.numeric(m$trend[!is.na(m$trend)]),main='Trend')
spectrum(as.numeric(m$seasonal[!is.na(m$seasonal)]),main='Seasonal')
spectrum(as.numeric(m$random[!is.na(m$random)]),main='Random')
par(op)
dev.off()
bitmap(file='test4.png')
op <- par(mfrow = c(2,2))
cpgram(as.numeric(x),main='Observed')
cpgram(as.numeric(m$trend[!is.na(m$trend)]),main='Trend')
cpgram(as.numeric(m$seasonal[!is.na(m$seasonal)]),main='Seasonal')
cpgram(as.numeric(m$random[!is.na(m$random)]),main='Random')
par(op)
dev.off()
load(file='createtable')
a<-table.start()
a<-table.row.start(a)
a<-table.element(a,'Classical Decomposition by Moving Averages',6,TRUE)
a<-table.row.end(a)
a<-table.row.start(a)
a<-table.element(a,'t',header=TRUE)
a<-table.element(a,'Observations',header=TRUE)
a<-table.element(a,'Fit',header=TRUE)
a<-table.element(a,'Trend',header=TRUE)
a<-table.element(a,'Seasonal',header=TRUE)
a<-table.element(a,'Random',header=TRUE)
a<-table.row.end(a)
for (i in 1:length(m$trend)) {
a<-table.row.start(a)
a<-table.element(a,i,header=TRUE)
a<-table.element(a,x[i])
if (par1 == 'additive') a<-table.element(a,signif(m$trend[i]+m$seasonal[i],6)) else a<-table.element(a,signif(m$trend[i]*m$seasonal[i],6))
a<-table.element(a,signif(m$trend[i],6))
a<-table.element(a,signif(m$seasonal[i],6))
a<-table.element(a,signif(m$random[i],6))
a<-table.row.end(a)
}
a<-table.end(a)
table.save(a,file='mytable.tab')