Free Statistics

of Irreproducible Research!

Author's title

Author*The author of this computation has been verified*
R Software Modulerwasp_decompose.wasp
Title produced by softwareClassical Decomposition
Date of computationMon, 12 Dec 2016 19:54:22 +0100
Cite this page as followsStatistical Computations at FreeStatistics.org, Office for Research Development and Education, URL https://freestatistics.org/blog/index.php?v=date/2016/Dec/12/t1481568874gyouwszuelg85gn.htm/, Retrieved Fri, 01 Nov 2024 03:47:16 +0000
Statistical Computations at FreeStatistics.org, Office for Research Development and Education, URL https://freestatistics.org/blog/index.php?pk=298974, Retrieved Fri, 01 Nov 2024 03:47:16 +0000
QR Codes:

Original text written by user:
IsPrivate?No (this computation is public)
User-defined keywords
Estimated Impact92
Family? (F = Feedback message, R = changed R code, M = changed R Module, P = changed Parameters, D = changed Data)
-       [Classical Decomposition] [classical decompo...] [2016-12-12 18:54:22] [130d73899007e5ff8a4f636b9bcfb397] [Current]
Feedback Forum

Post a new message
Dataseries X:
2561
2958
3257
3627
4350
4600
5072
5399
5561
5707
5648
6332
6818
7110
7781
8225
8385
8446
6484


Summary of computational transaction
Raw Input view raw input (R code)
Raw Outputview raw output of R engine
Computing time2 seconds
R ServerBig Analytics Cloud Computing Center

\begin{tabular}{lllllllll}
\hline
Summary of computational transaction \tabularnewline
Raw Input view raw input (R code)  \tabularnewline
Raw Outputview raw output of R engine  \tabularnewline
Computing time2 seconds \tabularnewline
R ServerBig Analytics Cloud Computing Center \tabularnewline
\hline
\end{tabular}
%Source: https://freestatistics.org/blog/index.php?pk=298974&T=0

[TABLE]
[ROW]
Summary of computational transaction[/C][/ROW] [ROW]Raw Input[/C] view raw input (R code) [/C][/ROW] [ROW]Raw Output[/C]view raw output of R engine [/C][/ROW] [ROW]Computing time[/C]2 seconds[/C][/ROW] [ROW]R Server[/C]Big Analytics Cloud Computing Center[/C][/ROW] [/TABLE] Source: https://freestatistics.org/blog/index.php?pk=298974&T=0

Globally Unique Identifier (entire table): ba.freestatistics.org/blog/index.php?pk=298974&T=0

As an alternative you can also use a QR Code:  

The GUIDs for individual cells are displayed in the table below:

Summary of computational transaction
Raw Input view raw input (R code)
Raw Outputview raw output of R engine
Computing time2 seconds
R ServerBig Analytics Cloud Computing Center


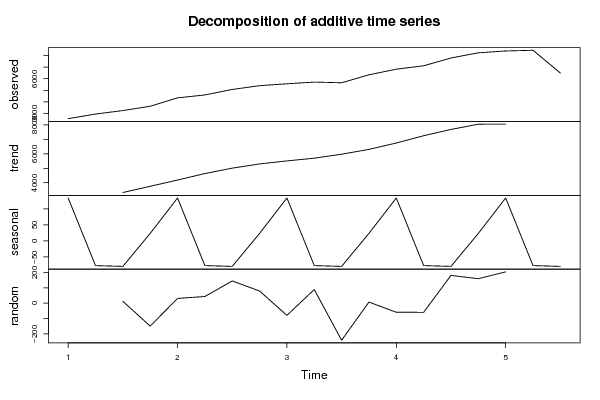
Classical Decomposition by Moving Averages
tObservationsFitTrendSeasonalRandom
12561NANA133.586NA
22958NANA-77.1953NA
332573244.83324.38-79.570312.1953
436273776.433753.2523.1797-149.43
543504318.964185.38133.58631.0391
646004556.554633.75-77.195343.4453
750724927.055006.62-79.5703144.945
853995319.555296.3823.179779.4453
955615640.345506.75133.586-79.3359
1057075618.185695.38-77.195388.8203
1156485889.555969.12-79.5703-241.555
1263326324.86301.6223.17977.19531
1368186877.216743.62133.586-59.2109
1471107169.687246.88-77.1953-59.6797
1577817599.87679.38-79.5703181.195
1682258065.438042.2523.1797159.57
1783858180.718047.12133.586204.289
188446NANA-77.1953NA
196484NANA-79.5703NA

\begin{tabular}{lllllllll}
\hline
Classical Decomposition by Moving Averages \tabularnewline
t & Observations & Fit & Trend & Seasonal & Random \tabularnewline
1 & 2561 & NA & NA & 133.586 & NA \tabularnewline
2 & 2958 & NA & NA & -77.1953 & NA \tabularnewline
3 & 3257 & 3244.8 & 3324.38 & -79.5703 & 12.1953 \tabularnewline
4 & 3627 & 3776.43 & 3753.25 & 23.1797 & -149.43 \tabularnewline
5 & 4350 & 4318.96 & 4185.38 & 133.586 & 31.0391 \tabularnewline
6 & 4600 & 4556.55 & 4633.75 & -77.1953 & 43.4453 \tabularnewline
7 & 5072 & 4927.05 & 5006.62 & -79.5703 & 144.945 \tabularnewline
8 & 5399 & 5319.55 & 5296.38 & 23.1797 & 79.4453 \tabularnewline
9 & 5561 & 5640.34 & 5506.75 & 133.586 & -79.3359 \tabularnewline
10 & 5707 & 5618.18 & 5695.38 & -77.1953 & 88.8203 \tabularnewline
11 & 5648 & 5889.55 & 5969.12 & -79.5703 & -241.555 \tabularnewline
12 & 6332 & 6324.8 & 6301.62 & 23.1797 & 7.19531 \tabularnewline
13 & 6818 & 6877.21 & 6743.62 & 133.586 & -59.2109 \tabularnewline
14 & 7110 & 7169.68 & 7246.88 & -77.1953 & -59.6797 \tabularnewline
15 & 7781 & 7599.8 & 7679.38 & -79.5703 & 181.195 \tabularnewline
16 & 8225 & 8065.43 & 8042.25 & 23.1797 & 159.57 \tabularnewline
17 & 8385 & 8180.71 & 8047.12 & 133.586 & 204.289 \tabularnewline
18 & 8446 & NA & NA & -77.1953 & NA \tabularnewline
19 & 6484 & NA & NA & -79.5703 & NA \tabularnewline
\hline
\end{tabular}
%Source: https://freestatistics.org/blog/index.php?pk=298974&T=1

[TABLE]
[ROW][C]Classical Decomposition by Moving Averages[/C][/ROW]
[ROW][C]t[/C][C]Observations[/C][C]Fit[/C][C]Trend[/C][C]Seasonal[/C][C]Random[/C][/ROW]
[ROW][C]1[/C][C]2561[/C][C]NA[/C][C]NA[/C][C]133.586[/C][C]NA[/C][/ROW]
[ROW][C]2[/C][C]2958[/C][C]NA[/C][C]NA[/C][C]-77.1953[/C][C]NA[/C][/ROW]
[ROW][C]3[/C][C]3257[/C][C]3244.8[/C][C]3324.38[/C][C]-79.5703[/C][C]12.1953[/C][/ROW]
[ROW][C]4[/C][C]3627[/C][C]3776.43[/C][C]3753.25[/C][C]23.1797[/C][C]-149.43[/C][/ROW]
[ROW][C]5[/C][C]4350[/C][C]4318.96[/C][C]4185.38[/C][C]133.586[/C][C]31.0391[/C][/ROW]
[ROW][C]6[/C][C]4600[/C][C]4556.55[/C][C]4633.75[/C][C]-77.1953[/C][C]43.4453[/C][/ROW]
[ROW][C]7[/C][C]5072[/C][C]4927.05[/C][C]5006.62[/C][C]-79.5703[/C][C]144.945[/C][/ROW]
[ROW][C]8[/C][C]5399[/C][C]5319.55[/C][C]5296.38[/C][C]23.1797[/C][C]79.4453[/C][/ROW]
[ROW][C]9[/C][C]5561[/C][C]5640.34[/C][C]5506.75[/C][C]133.586[/C][C]-79.3359[/C][/ROW]
[ROW][C]10[/C][C]5707[/C][C]5618.18[/C][C]5695.38[/C][C]-77.1953[/C][C]88.8203[/C][/ROW]
[ROW][C]11[/C][C]5648[/C][C]5889.55[/C][C]5969.12[/C][C]-79.5703[/C][C]-241.555[/C][/ROW]
[ROW][C]12[/C][C]6332[/C][C]6324.8[/C][C]6301.62[/C][C]23.1797[/C][C]7.19531[/C][/ROW]
[ROW][C]13[/C][C]6818[/C][C]6877.21[/C][C]6743.62[/C][C]133.586[/C][C]-59.2109[/C][/ROW]
[ROW][C]14[/C][C]7110[/C][C]7169.68[/C][C]7246.88[/C][C]-77.1953[/C][C]-59.6797[/C][/ROW]
[ROW][C]15[/C][C]7781[/C][C]7599.8[/C][C]7679.38[/C][C]-79.5703[/C][C]181.195[/C][/ROW]
[ROW][C]16[/C][C]8225[/C][C]8065.43[/C][C]8042.25[/C][C]23.1797[/C][C]159.57[/C][/ROW]
[ROW][C]17[/C][C]8385[/C][C]8180.71[/C][C]8047.12[/C][C]133.586[/C][C]204.289[/C][/ROW]
[ROW][C]18[/C][C]8446[/C][C]NA[/C][C]NA[/C][C]-77.1953[/C][C]NA[/C][/ROW]
[ROW][C]19[/C][C]6484[/C][C]NA[/C][C]NA[/C][C]-79.5703[/C][C]NA[/C][/ROW]
[/TABLE]
Source: https://freestatistics.org/blog/index.php?pk=298974&T=1

Globally Unique Identifier (entire table): ba.freestatistics.org/blog/index.php?pk=298974&T=1

As an alternative you can also use a QR Code:  

The GUIDs for individual cells are displayed in the table below:

Classical Decomposition by Moving Averages
tObservationsFitTrendSeasonalRandom
12561NANA133.586NA
22958NANA-77.1953NA
332573244.83324.38-79.570312.1953
436273776.433753.2523.1797-149.43
543504318.964185.38133.58631.0391
646004556.554633.75-77.195343.4453
750724927.055006.62-79.5703144.945
853995319.555296.3823.179779.4453
955615640.345506.75133.586-79.3359
1057075618.185695.38-77.195388.8203
1156485889.555969.12-79.5703-241.555
1263326324.86301.6223.17977.19531
1368186877.216743.62133.586-59.2109
1471107169.687246.88-77.1953-59.6797
1577817599.87679.38-79.5703181.195
1682258065.438042.2523.1797159.57
1783858180.718047.12133.586204.289
188446NANA-77.1953NA
196484NANA-79.5703NA


Parameters (Session):
par1 = additive ; par2 = 12 ;
Parameters (R input):
par1 = additive ; par2 = 4 ;
R code (references can be found in the software module):
par2 <- as.numeric(par2)
x <- ts(x,freq=par2)
m <- decompose(x,type=par1)
m$figure
bitmap(file='test1.png')
plot(m)
dev.off()
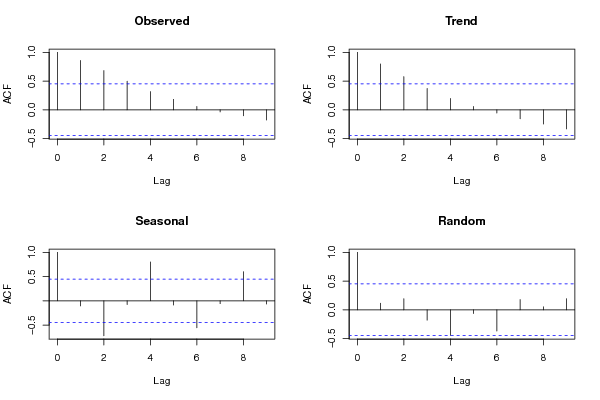
mylagmax <- length(x)/2
bitmap(file='test2.png')
op <- par(mfrow = c(2,2))
acf(as.numeric(x),lag.max = mylagmax,main='Observed')
acf(as.numeric(m$trend),na.action=na.pass,lag.max = mylagmax,main='Trend')
acf(as.numeric(m$seasonal),na.action=na.pass,lag.max = mylagmax,main='Seasonal')
acf(as.numeric(m$random),na.action=na.pass,lag.max = mylagmax,main='Random')
par(op)
dev.off()
bitmap(file='test3.png')
op <- par(mfrow = c(2,2))
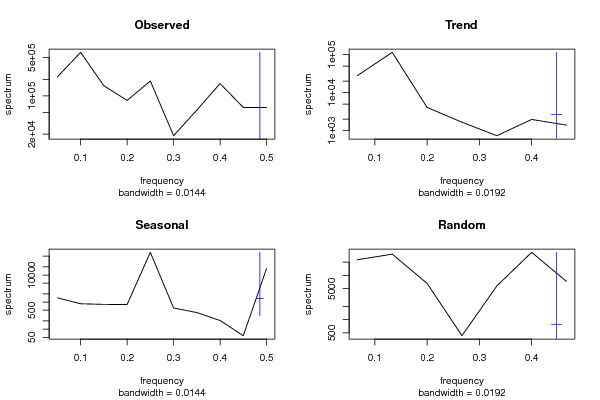
spectrum(as.numeric(x),main='Observed')
spectrum(as.numeric(m$trend[!is.na(m$trend)]),main='Trend')
spectrum(as.numeric(m$seasonal[!is.na(m$seasonal)]),main='Seasonal')
spectrum(as.numeric(m$random[!is.na(m$random)]),main='Random')
par(op)
dev.off()
bitmap(file='test4.png')
op <- par(mfrow = c(2,2))
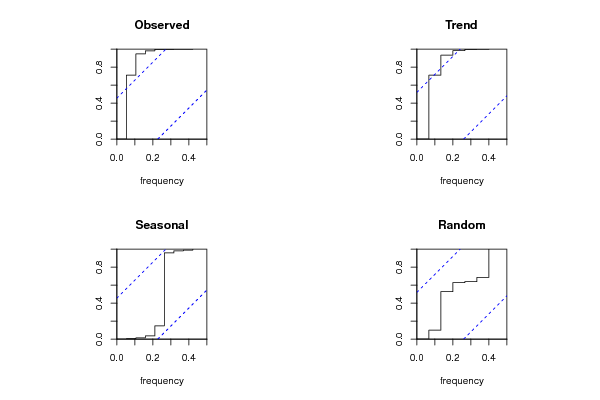
cpgram(as.numeric(x),main='Observed')
cpgram(as.numeric(m$trend[!is.na(m$trend)]),main='Trend')
cpgram(as.numeric(m$seasonal[!is.na(m$seasonal)]),main='Seasonal')
cpgram(as.numeric(m$random[!is.na(m$random)]),main='Random')
par(op)
dev.off()
load(file='createtable')
a<-table.start()
a<-table.row.start(a)
a<-table.element(a,'Classical Decomposition by Moving Averages',6,TRUE)
a<-table.row.end(a)
a<-table.row.start(a)
a<-table.element(a,'t',header=TRUE)
a<-table.element(a,'Observations',header=TRUE)
a<-table.element(a,'Fit',header=TRUE)
a<-table.element(a,'Trend',header=TRUE)
a<-table.element(a,'Seasonal',header=TRUE)
a<-table.element(a,'Random',header=TRUE)
a<-table.row.end(a)
for (i in 1:length(m$trend)) {
a<-table.row.start(a)
a<-table.element(a,i,header=TRUE)
a<-table.element(a,x[i])
if (par1 == 'additive') a<-table.element(a,signif(m$trend[i]+m$seasonal[i],6)) else a<-table.element(a,signif(m$trend[i]*m$seasonal[i],6))
a<-table.element(a,signif(m$trend[i],6))
a<-table.element(a,signif(m$seasonal[i],6))
a<-table.element(a,signif(m$random[i],6))
a<-table.row.end(a)
}
a<-table.end(a)
table.save(a,file='mytable.tab')