Free Statistics

of Irreproducible Research!

Author's title

Author*The author of this computation has been verified*
R Software Modulerwasp_decompose.wasp
Title produced by softwareClassical Decomposition
Date of computationMon, 12 Dec 2016 19:53:15 +0100
Cite this page as followsStatistical Computations at FreeStatistics.org, Office for Research Development and Education, URL https://freestatistics.org/blog/index.php?v=date/2016/Dec/12/t1481568823znobimcux3dknfi.htm/, Retrieved Fri, 01 Nov 2024 03:40:43 +0000
Statistical Computations at FreeStatistics.org, Office for Research Development and Education, URL https://freestatistics.org/blog/index.php?pk=298973, Retrieved Fri, 01 Nov 2024 03:40:43 +0000
QR Codes:

Original text written by user:
IsPrivate?No (this computation is public)
User-defined keywords
Estimated Impact102
Family? (F = Feedback message, R = changed R code, M = changed R Module, P = changed Parameters, D = changed Data)
-       [Classical Decomposition] [classical decompo...] [2016-12-12 18:53:15] [130d73899007e5ff8a4f636b9bcfb397] [Current]
Feedback Forum

Post a new message
Dataseries X:
1623.25
2140.55
2451.15
2964.45
3619.1
3764.25
4156
3374.55
4268.55
5290.7
5635.2
5845.9
7286.05
7686.95


Summary of computational transaction
Raw Input view raw input (R code)
Raw Outputview raw output of R engine
Computing time1 seconds
R ServerBig Analytics Cloud Computing Center

\begin{tabular}{lllllllll}
\hline
Summary of computational transaction \tabularnewline
Raw Input view raw input (R code)  \tabularnewline
Raw Outputview raw output of R engine  \tabularnewline
Computing time1 seconds \tabularnewline
R ServerBig Analytics Cloud Computing Center \tabularnewline
\hline
\end{tabular}
%Source: https://freestatistics.org/blog/index.php?pk=298973&T=0

[TABLE]
[ROW]
Summary of computational transaction[/C][/ROW] [ROW]Raw Input[/C] view raw input (R code) [/C][/ROW] [ROW]Raw Output[/C]view raw output of R engine [/C][/ROW] [ROW]Computing time[/C]1 seconds[/C][/ROW] [ROW]R Server[/C]Big Analytics Cloud Computing Center[/C][/ROW] [/TABLE] Source: https://freestatistics.org/blog/index.php?pk=298973&T=0

Globally Unique Identifier (entire table): ba.freestatistics.org/blog/index.php?pk=298973&T=0

As an alternative you can also use a QR Code:  

The GUIDs for individual cells are displayed in the table below:

Summary of computational transaction
Raw Input view raw input (R code)
Raw Outputview raw output of R engine
Computing time1 seconds
R ServerBig Analytics Cloud Computing Center


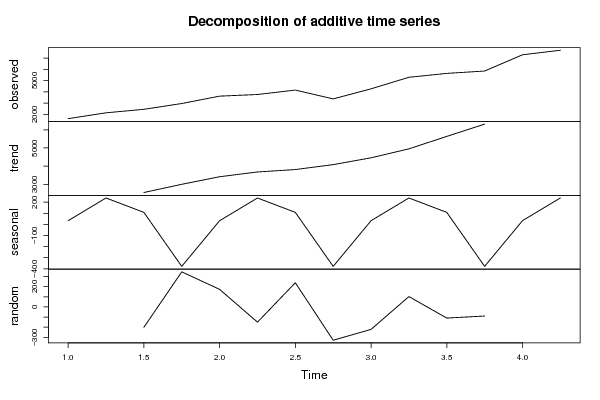
Classical Decomposition by Moving Averages
tObservationsFitTrendSeasonalRandom
11623.25NANA32.9271NA
22140.55NANA237.483NA
32451.152652.232544.33107.895-201.076
42964.452618.472996.77-378.305345.98
53619.13445.773412.8432.9271173.329
63764.253914.73677.21237.483-150.446
741563917.553809.66107.895238.449
83374.553703.344081.64-378.305-328.789
94268.554490.284457.3532.9271-221.727
105290.75188.654951.17237.483102.048
115635.25745.175637.28107.895-109.97
125845.95935.696313.99-378.305-89.7885
137286.05NANA32.9271NA
147686.95NANA237.483NA

\begin{tabular}{lllllllll}
\hline
Classical Decomposition by Moving Averages \tabularnewline
t & Observations & Fit & Trend & Seasonal & Random \tabularnewline
1 & 1623.25 & NA & NA & 32.9271 & NA \tabularnewline
2 & 2140.55 & NA & NA & 237.483 & NA \tabularnewline
3 & 2451.15 & 2652.23 & 2544.33 & 107.895 & -201.076 \tabularnewline
4 & 2964.45 & 2618.47 & 2996.77 & -378.305 & 345.98 \tabularnewline
5 & 3619.1 & 3445.77 & 3412.84 & 32.9271 & 173.329 \tabularnewline
6 & 3764.25 & 3914.7 & 3677.21 & 237.483 & -150.446 \tabularnewline
7 & 4156 & 3917.55 & 3809.66 & 107.895 & 238.449 \tabularnewline
8 & 3374.55 & 3703.34 & 4081.64 & -378.305 & -328.789 \tabularnewline
9 & 4268.55 & 4490.28 & 4457.35 & 32.9271 & -221.727 \tabularnewline
10 & 5290.7 & 5188.65 & 4951.17 & 237.483 & 102.048 \tabularnewline
11 & 5635.2 & 5745.17 & 5637.28 & 107.895 & -109.97 \tabularnewline
12 & 5845.9 & 5935.69 & 6313.99 & -378.305 & -89.7885 \tabularnewline
13 & 7286.05 & NA & NA & 32.9271 & NA \tabularnewline
14 & 7686.95 & NA & NA & 237.483 & NA \tabularnewline
\hline
\end{tabular}
%Source: https://freestatistics.org/blog/index.php?pk=298973&T=1

[TABLE]
[ROW][C]Classical Decomposition by Moving Averages[/C][/ROW]
[ROW][C]t[/C][C]Observations[/C][C]Fit[/C][C]Trend[/C][C]Seasonal[/C][C]Random[/C][/ROW]
[ROW][C]1[/C][C]1623.25[/C][C]NA[/C][C]NA[/C][C]32.9271[/C][C]NA[/C][/ROW]
[ROW][C]2[/C][C]2140.55[/C][C]NA[/C][C]NA[/C][C]237.483[/C][C]NA[/C][/ROW]
[ROW][C]3[/C][C]2451.15[/C][C]2652.23[/C][C]2544.33[/C][C]107.895[/C][C]-201.076[/C][/ROW]
[ROW][C]4[/C][C]2964.45[/C][C]2618.47[/C][C]2996.77[/C][C]-378.305[/C][C]345.98[/C][/ROW]
[ROW][C]5[/C][C]3619.1[/C][C]3445.77[/C][C]3412.84[/C][C]32.9271[/C][C]173.329[/C][/ROW]
[ROW][C]6[/C][C]3764.25[/C][C]3914.7[/C][C]3677.21[/C][C]237.483[/C][C]-150.446[/C][/ROW]
[ROW][C]7[/C][C]4156[/C][C]3917.55[/C][C]3809.66[/C][C]107.895[/C][C]238.449[/C][/ROW]
[ROW][C]8[/C][C]3374.55[/C][C]3703.34[/C][C]4081.64[/C][C]-378.305[/C][C]-328.789[/C][/ROW]
[ROW][C]9[/C][C]4268.55[/C][C]4490.28[/C][C]4457.35[/C][C]32.9271[/C][C]-221.727[/C][/ROW]
[ROW][C]10[/C][C]5290.7[/C][C]5188.65[/C][C]4951.17[/C][C]237.483[/C][C]102.048[/C][/ROW]
[ROW][C]11[/C][C]5635.2[/C][C]5745.17[/C][C]5637.28[/C][C]107.895[/C][C]-109.97[/C][/ROW]
[ROW][C]12[/C][C]5845.9[/C][C]5935.69[/C][C]6313.99[/C][C]-378.305[/C][C]-89.7885[/C][/ROW]
[ROW][C]13[/C][C]7286.05[/C][C]NA[/C][C]NA[/C][C]32.9271[/C][C]NA[/C][/ROW]
[ROW][C]14[/C][C]7686.95[/C][C]NA[/C][C]NA[/C][C]237.483[/C][C]NA[/C][/ROW]
[/TABLE]
Source: https://freestatistics.org/blog/index.php?pk=298973&T=1

Globally Unique Identifier (entire table): ba.freestatistics.org/blog/index.php?pk=298973&T=1

As an alternative you can also use a QR Code:  

The GUIDs for individual cells are displayed in the table below:

Classical Decomposition by Moving Averages
tObservationsFitTrendSeasonalRandom
11623.25NANA32.9271NA
22140.55NANA237.483NA
32451.152652.232544.33107.895-201.076
42964.452618.472996.77-378.305345.98
53619.13445.773412.8432.9271173.329
63764.253914.73677.21237.483-150.446
741563917.553809.66107.895238.449
83374.553703.344081.64-378.305-328.789
94268.554490.284457.3532.9271-221.727
105290.75188.654951.17237.483102.048
115635.25745.175637.28107.895-109.97
125845.95935.696313.99-378.305-89.7885
137286.05NANA32.9271NA
147686.95NANA237.483NA


Parameters (Session):
par1 = additive ; par2 = 12 ;
Parameters (R input):
par1 = additive ; par2 = 4 ;
R code (references can be found in the software module):
par2 <- as.numeric(par2)
x <- ts(x,freq=par2)
m <- decompose(x,type=par1)
m$figure
bitmap(file='test1.png')
plot(m)
dev.off()
mylagmax <- length(x)/2
bitmap(file='test2.png')
op <- par(mfrow = c(2,2))
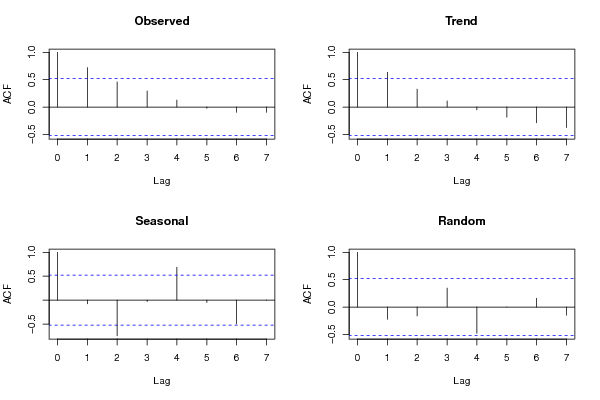
acf(as.numeric(x),lag.max = mylagmax,main='Observed')
acf(as.numeric(m$trend),na.action=na.pass,lag.max = mylagmax,main='Trend')
acf(as.numeric(m$seasonal),na.action=na.pass,lag.max = mylagmax,main='Seasonal')
acf(as.numeric(m$random),na.action=na.pass,lag.max = mylagmax,main='Random')
par(op)
dev.off()
bitmap(file='test3.png')
op <- par(mfrow = c(2,2))
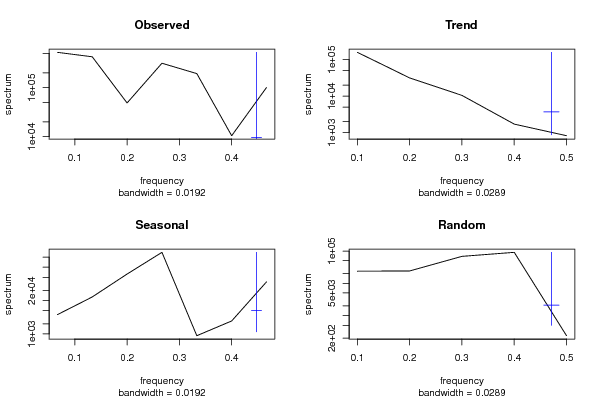
spectrum(as.numeric(x),main='Observed')
spectrum(as.numeric(m$trend[!is.na(m$trend)]),main='Trend')
spectrum(as.numeric(m$seasonal[!is.na(m$seasonal)]),main='Seasonal')
spectrum(as.numeric(m$random[!is.na(m$random)]),main='Random')
par(op)
dev.off()
bitmap(file='test4.png')
op <- par(mfrow = c(2,2))
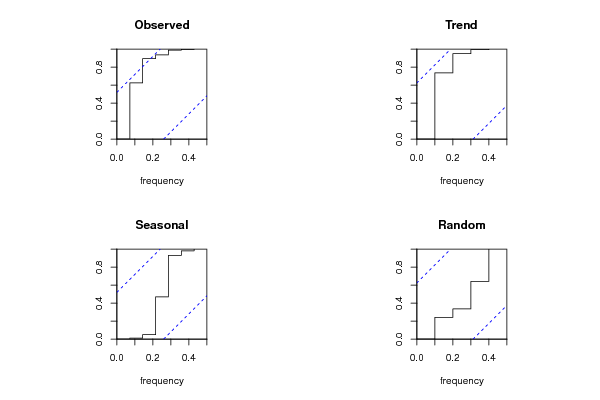
cpgram(as.numeric(x),main='Observed')
cpgram(as.numeric(m$trend[!is.na(m$trend)]),main='Trend')
cpgram(as.numeric(m$seasonal[!is.na(m$seasonal)]),main='Seasonal')
cpgram(as.numeric(m$random[!is.na(m$random)]),main='Random')
par(op)
dev.off()
load(file='createtable')
a<-table.start()
a<-table.row.start(a)
a<-table.element(a,'Classical Decomposition by Moving Averages',6,TRUE)
a<-table.row.end(a)
a<-table.row.start(a)
a<-table.element(a,'t',header=TRUE)
a<-table.element(a,'Observations',header=TRUE)
a<-table.element(a,'Fit',header=TRUE)
a<-table.element(a,'Trend',header=TRUE)
a<-table.element(a,'Seasonal',header=TRUE)
a<-table.element(a,'Random',header=TRUE)
a<-table.row.end(a)
for (i in 1:length(m$trend)) {
a<-table.row.start(a)
a<-table.element(a,i,header=TRUE)
a<-table.element(a,x[i])
if (par1 == 'additive') a<-table.element(a,signif(m$trend[i]+m$seasonal[i],6)) else a<-table.element(a,signif(m$trend[i]*m$seasonal[i],6))
a<-table.element(a,signif(m$trend[i],6))
a<-table.element(a,signif(m$seasonal[i],6))
a<-table.element(a,signif(m$random[i],6))
a<-table.row.end(a)
}
a<-table.end(a)
table.save(a,file='mytable.tab')