Free Statistics

of Irreproducible Research!

Author's title

Author*The author of this computation has been verified*
R Software Modulerwasp_exponentialsmoothing.wasp
Title produced by softwareExponential Smoothing
Date of computationSun, 11 Dec 2016 20:43:24 +0100
Cite this page as followsStatistical Computations at FreeStatistics.org, Office for Research Development and Education, URL https://freestatistics.org/blog/index.php?v=date/2016/Dec/11/t1481485422mythlt0ip09h7xd.htm/, Retrieved Fri, 01 Nov 2024 03:41:57 +0000
Statistical Computations at FreeStatistics.org, Office for Research Development and Education, URL https://freestatistics.org/blog/index.php?pk=298854, Retrieved Fri, 01 Nov 2024 03:41:57 +0000
QR Codes:

Original text written by user:
IsPrivate?No (this computation is public)
User-defined keywords
Estimated Impact112
Family? (F = Feedback message, R = changed R code, M = changed R Module, P = changed Parameters, D = changed Data)
-       [Exponential Smoothing] [Exponential Smoot...] [2016-12-11 19:43:24] [2322cf848a5cbdeb3105c2829b69db5d] [Current]
Feedback Forum

Post a new message
Dataseries X:
5692.4
5634.45
5555.38
5352.26
5233.07
4880.16
4861.88
4661.93
4330.68
3681.56
3540.08
3328.03
3254.92
3217.27
3301.29
4272.3
4424.8
4449.8
4678
4722.2
4708.9
4121.4
4230.6
4263
4241.9
4309.8
4457.9
4543.9
4937
4917.9
5041.1
5017.2
4833.9
4815.4
4785.9


Summary of computational transaction
Raw Input view raw input (R code)
Raw Outputview raw output of R engine
Computing time1 seconds
R ServerBig Analytics Cloud Computing Center

\begin{tabular}{lllllllll}
\hline
Summary of computational transaction \tabularnewline
Raw Input view raw input (R code)  \tabularnewline
Raw Outputview raw output of R engine  \tabularnewline
Computing time1 seconds \tabularnewline
R ServerBig Analytics Cloud Computing Center \tabularnewline
\hline
\end{tabular}
%Source: https://freestatistics.org/blog/index.php?pk=298854&T=0

[TABLE]
[ROW]
Summary of computational transaction[/C][/ROW] [ROW]Raw Input[/C] view raw input (R code) [/C][/ROW] [ROW]Raw Output[/C]view raw output of R engine [/C][/ROW] [ROW]Computing time[/C]1 seconds[/C][/ROW] [ROW]R Server[/C]Big Analytics Cloud Computing Center[/C][/ROW] [/TABLE] Source: https://freestatistics.org/blog/index.php?pk=298854&T=0

Globally Unique Identifier (entire table): ba.freestatistics.org/blog/index.php?pk=298854&T=0

As an alternative you can also use a QR Code:  

The GUIDs for individual cells are displayed in the table below:

Summary of computational transaction
Raw Input view raw input (R code)
Raw Outputview raw output of R engine
Computing time1 seconds
R ServerBig Analytics Cloud Computing Center


Estimated Parameters of Exponential Smoothing
ParameterValue
alpha0.891397415842605
beta0.0509650449148186
gamma0

\begin{tabular}{lllllllll}
\hline
Estimated Parameters of Exponential Smoothing \tabularnewline
Parameter & Value \tabularnewline
alpha & 0.891397415842605 \tabularnewline
beta & 0.0509650449148186 \tabularnewline
gamma & 0 \tabularnewline
\hline
\end{tabular}
%Source: https://freestatistics.org/blog/index.php?pk=298854&T=1

[TABLE]
[ROW][C]Estimated Parameters of Exponential Smoothing[/C][/ROW]
[ROW][C]Parameter[/C][C]Value[/C][/ROW]
[ROW][C]alpha[/C][C]0.891397415842605[/C][/ROW]
[ROW][C]beta[/C][C]0.0509650449148186[/C][/ROW]
[ROW][C]gamma[/C][C]0[/C][/ROW]
[/TABLE]
Source: https://freestatistics.org/blog/index.php?pk=298854&T=1

Globally Unique Identifier (entire table): ba.freestatistics.org/blog/index.php?pk=298854&T=1

As an alternative you can also use a QR Code:  

The GUIDs for individual cells are displayed in the table below:

Estimated Parameters of Exponential Smoothing
ParameterValue
alpha0.891397415842605
beta0.0509650449148186
gamma0


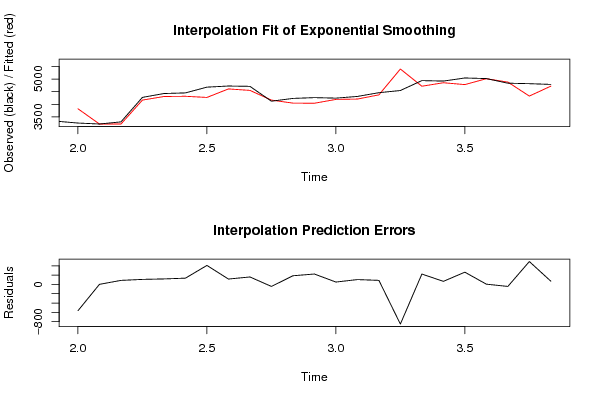
Interpolation Forecasts of Exponential Smoothing
tObservedFittedResiduals
133254.923821.01547008547-566.095470085472
143217.273215.866578987011.40342101298529
153301.293214.8976571439986.3923428560056
164272.34164.78703752211107.512962477887
174424.84306.86510929251117.93489070749
184449.84315.4606392675134.339360732499
1946784269.91212327718408.087876722824
204722.24606.84805388933115.351946110668
214708.94549.13913395339159.760866046613
224121.44164.68666410072-43.2866641007158
234230.64044.66913269863185.930867301368
2442634039.78570941784223.214290582157
254241.94191.2010329296850.6989670703197
264309.84206.15698582034103.643014179656
274457.94371.2648056212186.6351943787859
284543.95396.32232848873-852.422328488726
2949374714.05826256142222.941737438577
304917.94852.368796932365.5312030677005
315041.14778.47107745882262.628922541181
325017.25012.123266458155.07673354185317
334833.94877.48348629874-43.5834862987394
344815.44323.90060937133491.499390628674
354785.94717.0155972531668.8844027468349

\begin{tabular}{lllllllll}
\hline
Interpolation Forecasts of Exponential Smoothing \tabularnewline
t & Observed & Fitted & Residuals \tabularnewline
13 & 3254.92 & 3821.01547008547 & -566.095470085472 \tabularnewline
14 & 3217.27 & 3215.86657898701 & 1.40342101298529 \tabularnewline
15 & 3301.29 & 3214.89765714399 & 86.3923428560056 \tabularnewline
16 & 4272.3 & 4164.78703752211 & 107.512962477887 \tabularnewline
17 & 4424.8 & 4306.86510929251 & 117.93489070749 \tabularnewline
18 & 4449.8 & 4315.4606392675 & 134.339360732499 \tabularnewline
19 & 4678 & 4269.91212327718 & 408.087876722824 \tabularnewline
20 & 4722.2 & 4606.84805388933 & 115.351946110668 \tabularnewline
21 & 4708.9 & 4549.13913395339 & 159.760866046613 \tabularnewline
22 & 4121.4 & 4164.68666410072 & -43.2866641007158 \tabularnewline
23 & 4230.6 & 4044.66913269863 & 185.930867301368 \tabularnewline
24 & 4263 & 4039.78570941784 & 223.214290582157 \tabularnewline
25 & 4241.9 & 4191.20103292968 & 50.6989670703197 \tabularnewline
26 & 4309.8 & 4206.15698582034 & 103.643014179656 \tabularnewline
27 & 4457.9 & 4371.26480562121 & 86.6351943787859 \tabularnewline
28 & 4543.9 & 5396.32232848873 & -852.422328488726 \tabularnewline
29 & 4937 & 4714.05826256142 & 222.941737438577 \tabularnewline
30 & 4917.9 & 4852.3687969323 & 65.5312030677005 \tabularnewline
31 & 5041.1 & 4778.47107745882 & 262.628922541181 \tabularnewline
32 & 5017.2 & 5012.12326645815 & 5.07673354185317 \tabularnewline
33 & 4833.9 & 4877.48348629874 & -43.5834862987394 \tabularnewline
34 & 4815.4 & 4323.90060937133 & 491.499390628674 \tabularnewline
35 & 4785.9 & 4717.01559725316 & 68.8844027468349 \tabularnewline
\hline
\end{tabular}
%Source: https://freestatistics.org/blog/index.php?pk=298854&T=2

[TABLE]
[ROW][C]Interpolation Forecasts of Exponential Smoothing[/C][/ROW]
[ROW][C]t[/C][C]Observed[/C][C]Fitted[/C][C]Residuals[/C][/ROW]
[ROW][C]13[/C][C]3254.92[/C][C]3821.01547008547[/C][C]-566.095470085472[/C][/ROW]
[ROW][C]14[/C][C]3217.27[/C][C]3215.86657898701[/C][C]1.40342101298529[/C][/ROW]
[ROW][C]15[/C][C]3301.29[/C][C]3214.89765714399[/C][C]86.3923428560056[/C][/ROW]
[ROW][C]16[/C][C]4272.3[/C][C]4164.78703752211[/C][C]107.512962477887[/C][/ROW]
[ROW][C]17[/C][C]4424.8[/C][C]4306.86510929251[/C][C]117.93489070749[/C][/ROW]
[ROW][C]18[/C][C]4449.8[/C][C]4315.4606392675[/C][C]134.339360732499[/C][/ROW]
[ROW][C]19[/C][C]4678[/C][C]4269.91212327718[/C][C]408.087876722824[/C][/ROW]
[ROW][C]20[/C][C]4722.2[/C][C]4606.84805388933[/C][C]115.351946110668[/C][/ROW]
[ROW][C]21[/C][C]4708.9[/C][C]4549.13913395339[/C][C]159.760866046613[/C][/ROW]
[ROW][C]22[/C][C]4121.4[/C][C]4164.68666410072[/C][C]-43.2866641007158[/C][/ROW]
[ROW][C]23[/C][C]4230.6[/C][C]4044.66913269863[/C][C]185.930867301368[/C][/ROW]
[ROW][C]24[/C][C]4263[/C][C]4039.78570941784[/C][C]223.214290582157[/C][/ROW]
[ROW][C]25[/C][C]4241.9[/C][C]4191.20103292968[/C][C]50.6989670703197[/C][/ROW]
[ROW][C]26[/C][C]4309.8[/C][C]4206.15698582034[/C][C]103.643014179656[/C][/ROW]
[ROW][C]27[/C][C]4457.9[/C][C]4371.26480562121[/C][C]86.6351943787859[/C][/ROW]
[ROW][C]28[/C][C]4543.9[/C][C]5396.32232848873[/C][C]-852.422328488726[/C][/ROW]
[ROW][C]29[/C][C]4937[/C][C]4714.05826256142[/C][C]222.941737438577[/C][/ROW]
[ROW][C]30[/C][C]4917.9[/C][C]4852.3687969323[/C][C]65.5312030677005[/C][/ROW]
[ROW][C]31[/C][C]5041.1[/C][C]4778.47107745882[/C][C]262.628922541181[/C][/ROW]
[ROW][C]32[/C][C]5017.2[/C][C]5012.12326645815[/C][C]5.07673354185317[/C][/ROW]
[ROW][C]33[/C][C]4833.9[/C][C]4877.48348629874[/C][C]-43.5834862987394[/C][/ROW]
[ROW][C]34[/C][C]4815.4[/C][C]4323.90060937133[/C][C]491.499390628674[/C][/ROW]
[ROW][C]35[/C][C]4785.9[/C][C]4717.01559725316[/C][C]68.8844027468349[/C][/ROW]
[/TABLE]
Source: https://freestatistics.org/blog/index.php?pk=298854&T=2

Globally Unique Identifier (entire table): ba.freestatistics.org/blog/index.php?pk=298854&T=2

As an alternative you can also use a QR Code:  

The GUIDs for individual cells are displayed in the table below:

Interpolation Forecasts of Exponential Smoothing
tObservedFittedResiduals
133254.923821.01547008547-566.095470085472
143217.273215.866578987011.40342101298529
153301.293214.8976571439986.3923428560056
164272.34164.78703752211107.512962477887
174424.84306.86510929251117.93489070749
184449.84315.4606392675134.339360732499
1946784269.91212327718408.087876722824
204722.24606.84805388933115.351946110668
214708.94549.13913395339159.760866046613
224121.44164.68666410072-43.2866641007158
234230.64044.66913269863185.930867301368
2442634039.78570941784223.214290582157
254241.94191.2010329296850.6989670703197
264309.84206.15698582034103.643014179656
274457.94371.2648056212186.6351943787859
284543.95396.32232848873-852.422328488726
2949374714.05826256142222.941737438577
304917.94852.368796932365.5312030677005
315041.14778.47107745882262.628922541181
325017.25012.123266458155.07673354185317
334833.94877.48348629874-43.5834862987394
344815.44323.90060937133491.499390628674
354785.94717.0155972531668.8844027468349


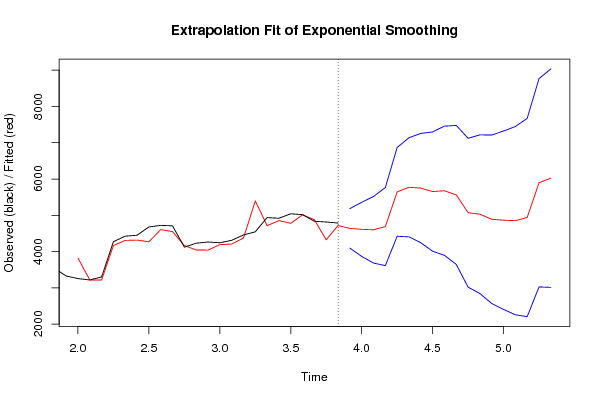
Extrapolation Forecasts of Exponential Smoothing
tForecast95% Lower Bound95% Upper Bound
364638.90543632244094.479562071615183.3313105732
374612.315646791253866.304024255875358.32726932663
384600.742940593433682.860311984765518.62556920211
394687.419401062283612.454962435095762.38383968948
405645.270444864464421.801242505626868.73964722331
415771.598988666654404.954547250997138.2434300823
425749.797115802164243.380028924687256.21420267964
435653.125242937674009.097689883537297.15279599182
445676.379620073193896.058589788267456.70065035812
455560.69274720873644.794774563657476.59071985376
465071.418374344223020.21963159377122.61711709474
475029.541501479732842.987096066817216.09590689265
484890.027961948582567.809158041067212.2467658561
494863.438172417432405.04850164467321.82784319026
504851.865466219612256.642461701217447.08847073801
514938.541926688462205.698781243277671.38507213365
525896.392970490643025.04295846388767.74298251748
536022.721514292823011.897105598599033.54592298706

\begin{tabular}{lllllllll}
\hline
Extrapolation Forecasts of Exponential Smoothing \tabularnewline
t & Forecast & 95% Lower Bound & 95% Upper Bound \tabularnewline
36 & 4638.9054363224 & 4094.47956207161 & 5183.3313105732 \tabularnewline
37 & 4612.31564679125 & 3866.30402425587 & 5358.32726932663 \tabularnewline
38 & 4600.74294059343 & 3682.86031198476 & 5518.62556920211 \tabularnewline
39 & 4687.41940106228 & 3612.45496243509 & 5762.38383968948 \tabularnewline
40 & 5645.27044486446 & 4421.80124250562 & 6868.73964722331 \tabularnewline
41 & 5771.59898866665 & 4404.95454725099 & 7138.2434300823 \tabularnewline
42 & 5749.79711580216 & 4243.38002892468 & 7256.21420267964 \tabularnewline
43 & 5653.12524293767 & 4009.09768988353 & 7297.15279599182 \tabularnewline
44 & 5676.37962007319 & 3896.05858978826 & 7456.70065035812 \tabularnewline
45 & 5560.6927472087 & 3644.79477456365 & 7476.59071985376 \tabularnewline
46 & 5071.41837434422 & 3020.2196315937 & 7122.61711709474 \tabularnewline
47 & 5029.54150147973 & 2842.98709606681 & 7216.09590689265 \tabularnewline
48 & 4890.02796194858 & 2567.80915804106 & 7212.2467658561 \tabularnewline
49 & 4863.43817241743 & 2405.0485016446 & 7321.82784319026 \tabularnewline
50 & 4851.86546621961 & 2256.64246170121 & 7447.08847073801 \tabularnewline
51 & 4938.54192668846 & 2205.69878124327 & 7671.38507213365 \tabularnewline
52 & 5896.39297049064 & 3025.0429584638 & 8767.74298251748 \tabularnewline
53 & 6022.72151429282 & 3011.89710559859 & 9033.54592298706 \tabularnewline
\hline
\end{tabular}
%Source: https://freestatistics.org/blog/index.php?pk=298854&T=3

[TABLE]
[ROW][C]Extrapolation Forecasts of Exponential Smoothing[/C][/ROW]
[ROW][C]t[/C][C]Forecast[/C][C]95% Lower Bound[/C][C]95% Upper Bound[/C][/ROW]
[ROW][C]36[/C][C]4638.9054363224[/C][C]4094.47956207161[/C][C]5183.3313105732[/C][/ROW]
[ROW][C]37[/C][C]4612.31564679125[/C][C]3866.30402425587[/C][C]5358.32726932663[/C][/ROW]
[ROW][C]38[/C][C]4600.74294059343[/C][C]3682.86031198476[/C][C]5518.62556920211[/C][/ROW]
[ROW][C]39[/C][C]4687.41940106228[/C][C]3612.45496243509[/C][C]5762.38383968948[/C][/ROW]
[ROW][C]40[/C][C]5645.27044486446[/C][C]4421.80124250562[/C][C]6868.73964722331[/C][/ROW]
[ROW][C]41[/C][C]5771.59898866665[/C][C]4404.95454725099[/C][C]7138.2434300823[/C][/ROW]
[ROW][C]42[/C][C]5749.79711580216[/C][C]4243.38002892468[/C][C]7256.21420267964[/C][/ROW]
[ROW][C]43[/C][C]5653.12524293767[/C][C]4009.09768988353[/C][C]7297.15279599182[/C][/ROW]
[ROW][C]44[/C][C]5676.37962007319[/C][C]3896.05858978826[/C][C]7456.70065035812[/C][/ROW]
[ROW][C]45[/C][C]5560.6927472087[/C][C]3644.79477456365[/C][C]7476.59071985376[/C][/ROW]
[ROW][C]46[/C][C]5071.41837434422[/C][C]3020.2196315937[/C][C]7122.61711709474[/C][/ROW]
[ROW][C]47[/C][C]5029.54150147973[/C][C]2842.98709606681[/C][C]7216.09590689265[/C][/ROW]
[ROW][C]48[/C][C]4890.02796194858[/C][C]2567.80915804106[/C][C]7212.2467658561[/C][/ROW]
[ROW][C]49[/C][C]4863.43817241743[/C][C]2405.0485016446[/C][C]7321.82784319026[/C][/ROW]
[ROW][C]50[/C][C]4851.86546621961[/C][C]2256.64246170121[/C][C]7447.08847073801[/C][/ROW]
[ROW][C]51[/C][C]4938.54192668846[/C][C]2205.69878124327[/C][C]7671.38507213365[/C][/ROW]
[ROW][C]52[/C][C]5896.39297049064[/C][C]3025.0429584638[/C][C]8767.74298251748[/C][/ROW]
[ROW][C]53[/C][C]6022.72151429282[/C][C]3011.89710559859[/C][C]9033.54592298706[/C][/ROW]
[/TABLE]
Source: https://freestatistics.org/blog/index.php?pk=298854&T=3

Globally Unique Identifier (entire table): ba.freestatistics.org/blog/index.php?pk=298854&T=3

As an alternative you can also use a QR Code:  

The GUIDs for individual cells are displayed in the table below:

Extrapolation Forecasts of Exponential Smoothing
tForecast95% Lower Bound95% Upper Bound
364638.90543632244094.479562071615183.3313105732
374612.315646791253866.304024255875358.32726932663
384600.742940593433682.860311984765518.62556920211
394687.419401062283612.454962435095762.38383968948
405645.270444864464421.801242505626868.73964722331
415771.598988666654404.954547250997138.2434300823
425749.797115802164243.380028924687256.21420267964
435653.125242937674009.097689883537297.15279599182
445676.379620073193896.058589788267456.70065035812
455560.69274720873644.794774563657476.59071985376
465071.418374344223020.21963159377122.61711709474
475029.541501479732842.987096066817216.09590689265
484890.027961948582567.809158041067212.2467658561
494863.438172417432405.04850164467321.82784319026
504851.865466219612256.642461701217447.08847073801
514938.541926688462205.698781243277671.38507213365
525896.392970490643025.04295846388767.74298251748
536022.721514292823011.897105598599033.54592298706


Parameters (Session):
par1 = 12 ; par2 = Triple ; par3 = additive ; par4 = 18 ;
Parameters (R input):
par1 = 12 ; par2 = Triple ; par3 = additive ; par4 = 18 ;
R code (references can be found in the software module):
par4 <- '18'
par3 <- 'additive'
par2 <- 'Double'
par1 <- '12'
par1 <- as.numeric(par1)
par4 <- as.numeric(par4)
if (par2 == 'Single') K <- 1
if (par2 == 'Double') K <- 2
if (par2 == 'Triple') K <- par1
nx <- length(x)
nxmK <- nx - K
x <- ts(x, frequency = par1)
if (par2 == 'Single') fit <- HoltWinters(x, gamma=F, beta=F)
if (par2 == 'Double') fit <- HoltWinters(x, gamma=F)
if (par2 == 'Triple') fit <- HoltWinters(x, seasonal=par3)
fit
myresid <- x - fit$fitted[,'xhat']
bitmap(file='test1.png')
op <- par(mfrow=c(2,1))
plot(fit,ylab='Observed (black) / Fitted (red)',main='Interpolation Fit of Exponential Smoothing')
plot(myresid,ylab='Residuals',main='Interpolation Prediction Errors')
par(op)
dev.off()
bitmap(file='test2.png')
p <- predict(fit, par4, prediction.interval=TRUE)
np <- length(p[,1])
plot(fit,p,ylab='Observed (black) / Fitted (red)',main='Extrapolation Fit of Exponential Smoothing')
dev.off()
bitmap(file='test3.png')
op <- par(mfrow = c(2,2))
acf(as.numeric(myresid),lag.max = nx/2,main='Residual ACF')
spectrum(myresid,main='Residals Periodogram')
cpgram(myresid,main='Residal Cumulative Periodogram')
qqnorm(myresid,main='Residual Normal QQ Plot')
qqline(myresid)
par(op)
dev.off()
load(file='createtable')
a<-table.start()
a<-table.row.start(a)
a<-table.element(a,'Estimated Parameters of Exponential Smoothing',2,TRUE)
a<-table.row.end(a)
a<-table.row.start(a)
a<-table.element(a,'Parameter',header=TRUE)
a<-table.element(a,'Value',header=TRUE)
a<-table.row.end(a)
a<-table.row.start(a)
a<-table.element(a,'alpha',header=TRUE)
a<-table.element(a,fit$alpha)
a<-table.row.end(a)
a<-table.row.start(a)
a<-table.element(a,'beta',header=TRUE)
a<-table.element(a,fit$beta)
a<-table.row.end(a)
a<-table.row.start(a)
a<-table.element(a,'gamma',header=TRUE)
a<-table.element(a,fit$gamma)
a<-table.row.end(a)
a<-table.end(a)
table.save(a,file='mytable.tab')
a<-table.start()
a<-table.row.start(a)
a<-table.element(a,'Interpolation Forecasts of Exponential Smoothing',4,TRUE)
a<-table.row.end(a)
a<-table.row.start(a)
a<-table.element(a,'t',header=TRUE)
a<-table.element(a,'Observed',header=TRUE)
a<-table.element(a,'Fitted',header=TRUE)
a<-table.element(a,'Residuals',header=TRUE)
a<-table.row.end(a)
for (i in 1:nxmK) {
a<-table.row.start(a)
a<-table.element(a,i+K,header=TRUE)
a<-table.element(a,x[i+K])
a<-table.element(a,fit$fitted[i,'xhat'])
a<-table.element(a,myresid[i])
a<-table.row.end(a)
}
a<-table.end(a)
table.save(a,file='mytable1.tab')
a<-table.start()
a<-table.row.start(a)
a<-table.element(a,'Extrapolation Forecasts of Exponential Smoothing',4,TRUE)
a<-table.row.end(a)
a<-table.row.start(a)
a<-table.element(a,'t',header=TRUE)
a<-table.element(a,'Forecast',header=TRUE)
a<-table.element(a,'95% Lower Bound',header=TRUE)
a<-table.element(a,'95% Upper Bound',header=TRUE)
a<-table.row.end(a)
for (i in 1:np) {
a<-table.row.start(a)
a<-table.element(a,nx+i,header=TRUE)
a<-table.element(a,p[i,'fit'])
a<-table.element(a,p[i,'lwr'])
a<-table.element(a,p[i,'upr'])
a<-table.row.end(a)
}
a<-table.end(a)
table.save(a,file='mytable2.tab')