Free Statistics

of Irreproducible Research!

Author's title

Author*The author of this computation has been verified*
R Software Modulerwasp_decompose.wasp
Title produced by softwareClassical Decomposition
Date of computationSat, 10 Dec 2016 16:08:36 +0100
Cite this page as followsStatistical Computations at FreeStatistics.org, Office for Research Development and Education, URL https://freestatistics.org/blog/index.php?v=date/2016/Dec/10/t1481383033kjln9q5r7ubwntd.htm/, Retrieved Fri, 01 Nov 2024 03:32:37 +0000
Statistical Computations at FreeStatistics.org, Office for Research Development and Education, URL https://freestatistics.org/blog/index.php?pk=298700, Retrieved Fri, 01 Nov 2024 03:32:37 +0000
QR Codes:

Original text written by user:
IsPrivate?No (this computation is public)
User-defined keywords
Estimated Impact71
Family? (F = Feedback message, R = changed R code, M = changed R Module, P = changed Parameters, D = changed Data)
-       [Classical Decomposition] [Classical Decompo...] [2016-12-10 15:08:36] [59384cc4294cbecf8e09b453c4247580] [Current]
Feedback Forum

Post a new message
Dataseries X:
2622.4
2607.5
2556.6
2569.3
2533.2
2529
2577.8
2556.6
2558.7
2541.7
2473.8
2461
2435.5
2414.3
2350.6
2329.4
2278.4
2252.9
2269.9
2227.4
2195.6
2204.1
2195.6
2202
2157.4
2142.5
2125.5
2110.7
2072.4
2076.7
2095.8
2023.6
2004.5
1985.4
1953.5
1915.3
1881.3
1821.9
1775.2
1790
1758.2
1747.6
1679.6
1692.3
1675.4
1639.3
1622.3
1577.7
1581.9
1562.8
1552.2
1535.2
1507.6


Summary of computational transaction
Raw Input view raw input (R code)
Raw Outputview raw output of R engine
Computing time2 seconds
R ServerBig Analytics Cloud Computing Center

\begin{tabular}{lllllllll}
\hline
Summary of computational transaction \tabularnewline
Raw Input view raw input (R code)  \tabularnewline
Raw Outputview raw output of R engine  \tabularnewline
Computing time2 seconds \tabularnewline
R ServerBig Analytics Cloud Computing Center \tabularnewline
\hline
\end{tabular}
%Source: https://freestatistics.org/blog/index.php?pk=298700&T=0

[TABLE]
[ROW]
Summary of computational transaction[/C][/ROW] [ROW]Raw Input[/C] view raw input (R code) [/C][/ROW] [ROW]Raw Output[/C]view raw output of R engine [/C][/ROW] [ROW]Computing time[/C]2 seconds[/C][/ROW] [ROW]R Server[/C]Big Analytics Cloud Computing Center[/C][/ROW] [/TABLE] Source: https://freestatistics.org/blog/index.php?pk=298700&T=0

Globally Unique Identifier (entire table): ba.freestatistics.org/blog/index.php?pk=298700&T=0

As an alternative you can also use a QR Code:  

The GUIDs for individual cells are displayed in the table below:

Summary of computational transaction
Raw Input view raw input (R code)
Raw Outputview raw output of R engine
Computing time2 seconds
R ServerBig Analytics Cloud Computing Center


Classical Decomposition by Moving Averages
tObservationsFitTrendSeasonalRandom
12622.4NANA2.7329NA
22607.5NANA-4.62127NA
32556.6NANA-22.8157NA
42569.3NANA-5.08099NA
52533.2NANA-21.0879NA
62529NANA-7.59349NA
72577.82554.212541.1813.033923.5869
82556.62529.32525.343.9547727.3036
92558.72517.582508.718.8745741.1171
102541.72504.312490.1314.183937.3869
112473.82473.832469.524.31415-0.030816
1224612461.52447.414.1051-0.500955
132435.52425.82423.062.73299.7046
142414.32391.92396.52-4.6212722.4046
152350.62344.862367.67-22.81575.74488
162329.42333.392338.48-5.08099-3.99401
172278.42291.732312.82-21.0879-13.3287
182252.92282.842290.43-7.59349-29.9398
192269.92281.092268.0513.0339-11.1881
202227.42249.12245.143.95477-21.6964
212195.62233.312224.448.87457-37.7121
222204.12220.132205.9514.1839-16.0298
232195.62192.562188.254.314153.03585
2422022186.432172.3214.105115.5699
252157.42160.462157.732.7329-3.06207
262142.52137.362141.98-4.621275.13793
272125.52102.712125.53-22.815722.7865
282110.72103.372108.45-5.080997.32682
292072.42068.172089.25-21.08794.23377
302076.72059.632067.22-7.5934917.0727
312095.82056.82043.7713.033938.9952
322023.62022.862018.913.954770.736892
332004.51999.831990.958.874574.67127
341985.41977.18196314.18398.22023
351953.51940.861936.544.3141512.6442
361915.31923.841909.7414.1051-8.54262
371881.31881.421878.682.7329-0.116233
381821.91842.921847.54-4.62127-21.0162
391775.21797.211820.02-22.8157-22.0051
4017901786.811791.89-5.080993.19349
411758.21742.581763.67-21.087915.6213
421747.61728.211735.8-7.5934919.3935
431679.61722.291709.2613.0339-42.6923
441692.31689.941685.993.954772.35773
451675.41674.771665.98.874570.625434
461639.31660.181645.9914.1839-20.8756
471622.31629.251624.934.31415-6.94748
481577.7NANA14.1051NA
491581.9NANA2.7329NA
501562.8NANA-4.62127NA
511552.2NANA-22.8157NA
521535.2NANA-5.08099NA
531507.6NANA-21.0879NA

\begin{tabular}{lllllllll}
\hline
Classical Decomposition by Moving Averages \tabularnewline
t & Observations & Fit & Trend & Seasonal & Random \tabularnewline
1 & 2622.4 & NA & NA & 2.7329 & NA \tabularnewline
2 & 2607.5 & NA & NA & -4.62127 & NA \tabularnewline
3 & 2556.6 & NA & NA & -22.8157 & NA \tabularnewline
4 & 2569.3 & NA & NA & -5.08099 & NA \tabularnewline
5 & 2533.2 & NA & NA & -21.0879 & NA \tabularnewline
6 & 2529 & NA & NA & -7.59349 & NA \tabularnewline
7 & 2577.8 & 2554.21 & 2541.18 & 13.0339 & 23.5869 \tabularnewline
8 & 2556.6 & 2529.3 & 2525.34 & 3.95477 & 27.3036 \tabularnewline
9 & 2558.7 & 2517.58 & 2508.71 & 8.87457 & 41.1171 \tabularnewline
10 & 2541.7 & 2504.31 & 2490.13 & 14.1839 & 37.3869 \tabularnewline
11 & 2473.8 & 2473.83 & 2469.52 & 4.31415 & -0.030816 \tabularnewline
12 & 2461 & 2461.5 & 2447.4 & 14.1051 & -0.500955 \tabularnewline
13 & 2435.5 & 2425.8 & 2423.06 & 2.7329 & 9.7046 \tabularnewline
14 & 2414.3 & 2391.9 & 2396.52 & -4.62127 & 22.4046 \tabularnewline
15 & 2350.6 & 2344.86 & 2367.67 & -22.8157 & 5.74488 \tabularnewline
16 & 2329.4 & 2333.39 & 2338.48 & -5.08099 & -3.99401 \tabularnewline
17 & 2278.4 & 2291.73 & 2312.82 & -21.0879 & -13.3287 \tabularnewline
18 & 2252.9 & 2282.84 & 2290.43 & -7.59349 & -29.9398 \tabularnewline
19 & 2269.9 & 2281.09 & 2268.05 & 13.0339 & -11.1881 \tabularnewline
20 & 2227.4 & 2249.1 & 2245.14 & 3.95477 & -21.6964 \tabularnewline
21 & 2195.6 & 2233.31 & 2224.44 & 8.87457 & -37.7121 \tabularnewline
22 & 2204.1 & 2220.13 & 2205.95 & 14.1839 & -16.0298 \tabularnewline
23 & 2195.6 & 2192.56 & 2188.25 & 4.31415 & 3.03585 \tabularnewline
24 & 2202 & 2186.43 & 2172.32 & 14.1051 & 15.5699 \tabularnewline
25 & 2157.4 & 2160.46 & 2157.73 & 2.7329 & -3.06207 \tabularnewline
26 & 2142.5 & 2137.36 & 2141.98 & -4.62127 & 5.13793 \tabularnewline
27 & 2125.5 & 2102.71 & 2125.53 & -22.8157 & 22.7865 \tabularnewline
28 & 2110.7 & 2103.37 & 2108.45 & -5.08099 & 7.32682 \tabularnewline
29 & 2072.4 & 2068.17 & 2089.25 & -21.0879 & 4.23377 \tabularnewline
30 & 2076.7 & 2059.63 & 2067.22 & -7.59349 & 17.0727 \tabularnewline
31 & 2095.8 & 2056.8 & 2043.77 & 13.0339 & 38.9952 \tabularnewline
32 & 2023.6 & 2022.86 & 2018.91 & 3.95477 & 0.736892 \tabularnewline
33 & 2004.5 & 1999.83 & 1990.95 & 8.87457 & 4.67127 \tabularnewline
34 & 1985.4 & 1977.18 & 1963 & 14.1839 & 8.22023 \tabularnewline
35 & 1953.5 & 1940.86 & 1936.54 & 4.31415 & 12.6442 \tabularnewline
36 & 1915.3 & 1923.84 & 1909.74 & 14.1051 & -8.54262 \tabularnewline
37 & 1881.3 & 1881.42 & 1878.68 & 2.7329 & -0.116233 \tabularnewline
38 & 1821.9 & 1842.92 & 1847.54 & -4.62127 & -21.0162 \tabularnewline
39 & 1775.2 & 1797.21 & 1820.02 & -22.8157 & -22.0051 \tabularnewline
40 & 1790 & 1786.81 & 1791.89 & -5.08099 & 3.19349 \tabularnewline
41 & 1758.2 & 1742.58 & 1763.67 & -21.0879 & 15.6213 \tabularnewline
42 & 1747.6 & 1728.21 & 1735.8 & -7.59349 & 19.3935 \tabularnewline
43 & 1679.6 & 1722.29 & 1709.26 & 13.0339 & -42.6923 \tabularnewline
44 & 1692.3 & 1689.94 & 1685.99 & 3.95477 & 2.35773 \tabularnewline
45 & 1675.4 & 1674.77 & 1665.9 & 8.87457 & 0.625434 \tabularnewline
46 & 1639.3 & 1660.18 & 1645.99 & 14.1839 & -20.8756 \tabularnewline
47 & 1622.3 & 1629.25 & 1624.93 & 4.31415 & -6.94748 \tabularnewline
48 & 1577.7 & NA & NA & 14.1051 & NA \tabularnewline
49 & 1581.9 & NA & NA & 2.7329 & NA \tabularnewline
50 & 1562.8 & NA & NA & -4.62127 & NA \tabularnewline
51 & 1552.2 & NA & NA & -22.8157 & NA \tabularnewline
52 & 1535.2 & NA & NA & -5.08099 & NA \tabularnewline
53 & 1507.6 & NA & NA & -21.0879 & NA \tabularnewline
\hline
\end{tabular}
%Source: https://freestatistics.org/blog/index.php?pk=298700&T=1

[TABLE]
[ROW][C]Classical Decomposition by Moving Averages[/C][/ROW]
[ROW][C]t[/C][C]Observations[/C][C]Fit[/C][C]Trend[/C][C]Seasonal[/C][C]Random[/C][/ROW]
[ROW][C]1[/C][C]2622.4[/C][C]NA[/C][C]NA[/C][C]2.7329[/C][C]NA[/C][/ROW]
[ROW][C]2[/C][C]2607.5[/C][C]NA[/C][C]NA[/C][C]-4.62127[/C][C]NA[/C][/ROW]
[ROW][C]3[/C][C]2556.6[/C][C]NA[/C][C]NA[/C][C]-22.8157[/C][C]NA[/C][/ROW]
[ROW][C]4[/C][C]2569.3[/C][C]NA[/C][C]NA[/C][C]-5.08099[/C][C]NA[/C][/ROW]
[ROW][C]5[/C][C]2533.2[/C][C]NA[/C][C]NA[/C][C]-21.0879[/C][C]NA[/C][/ROW]
[ROW][C]6[/C][C]2529[/C][C]NA[/C][C]NA[/C][C]-7.59349[/C][C]NA[/C][/ROW]
[ROW][C]7[/C][C]2577.8[/C][C]2554.21[/C][C]2541.18[/C][C]13.0339[/C][C]23.5869[/C][/ROW]
[ROW][C]8[/C][C]2556.6[/C][C]2529.3[/C][C]2525.34[/C][C]3.95477[/C][C]27.3036[/C][/ROW]
[ROW][C]9[/C][C]2558.7[/C][C]2517.58[/C][C]2508.71[/C][C]8.87457[/C][C]41.1171[/C][/ROW]
[ROW][C]10[/C][C]2541.7[/C][C]2504.31[/C][C]2490.13[/C][C]14.1839[/C][C]37.3869[/C][/ROW]
[ROW][C]11[/C][C]2473.8[/C][C]2473.83[/C][C]2469.52[/C][C]4.31415[/C][C]-0.030816[/C][/ROW]
[ROW][C]12[/C][C]2461[/C][C]2461.5[/C][C]2447.4[/C][C]14.1051[/C][C]-0.500955[/C][/ROW]
[ROW][C]13[/C][C]2435.5[/C][C]2425.8[/C][C]2423.06[/C][C]2.7329[/C][C]9.7046[/C][/ROW]
[ROW][C]14[/C][C]2414.3[/C][C]2391.9[/C][C]2396.52[/C][C]-4.62127[/C][C]22.4046[/C][/ROW]
[ROW][C]15[/C][C]2350.6[/C][C]2344.86[/C][C]2367.67[/C][C]-22.8157[/C][C]5.74488[/C][/ROW]
[ROW][C]16[/C][C]2329.4[/C][C]2333.39[/C][C]2338.48[/C][C]-5.08099[/C][C]-3.99401[/C][/ROW]
[ROW][C]17[/C][C]2278.4[/C][C]2291.73[/C][C]2312.82[/C][C]-21.0879[/C][C]-13.3287[/C][/ROW]
[ROW][C]18[/C][C]2252.9[/C][C]2282.84[/C][C]2290.43[/C][C]-7.59349[/C][C]-29.9398[/C][/ROW]
[ROW][C]19[/C][C]2269.9[/C][C]2281.09[/C][C]2268.05[/C][C]13.0339[/C][C]-11.1881[/C][/ROW]
[ROW][C]20[/C][C]2227.4[/C][C]2249.1[/C][C]2245.14[/C][C]3.95477[/C][C]-21.6964[/C][/ROW]
[ROW][C]21[/C][C]2195.6[/C][C]2233.31[/C][C]2224.44[/C][C]8.87457[/C][C]-37.7121[/C][/ROW]
[ROW][C]22[/C][C]2204.1[/C][C]2220.13[/C][C]2205.95[/C][C]14.1839[/C][C]-16.0298[/C][/ROW]
[ROW][C]23[/C][C]2195.6[/C][C]2192.56[/C][C]2188.25[/C][C]4.31415[/C][C]3.03585[/C][/ROW]
[ROW][C]24[/C][C]2202[/C][C]2186.43[/C][C]2172.32[/C][C]14.1051[/C][C]15.5699[/C][/ROW]
[ROW][C]25[/C][C]2157.4[/C][C]2160.46[/C][C]2157.73[/C][C]2.7329[/C][C]-3.06207[/C][/ROW]
[ROW][C]26[/C][C]2142.5[/C][C]2137.36[/C][C]2141.98[/C][C]-4.62127[/C][C]5.13793[/C][/ROW]
[ROW][C]27[/C][C]2125.5[/C][C]2102.71[/C][C]2125.53[/C][C]-22.8157[/C][C]22.7865[/C][/ROW]
[ROW][C]28[/C][C]2110.7[/C][C]2103.37[/C][C]2108.45[/C][C]-5.08099[/C][C]7.32682[/C][/ROW]
[ROW][C]29[/C][C]2072.4[/C][C]2068.17[/C][C]2089.25[/C][C]-21.0879[/C][C]4.23377[/C][/ROW]
[ROW][C]30[/C][C]2076.7[/C][C]2059.63[/C][C]2067.22[/C][C]-7.59349[/C][C]17.0727[/C][/ROW]
[ROW][C]31[/C][C]2095.8[/C][C]2056.8[/C][C]2043.77[/C][C]13.0339[/C][C]38.9952[/C][/ROW]
[ROW][C]32[/C][C]2023.6[/C][C]2022.86[/C][C]2018.91[/C][C]3.95477[/C][C]0.736892[/C][/ROW]
[ROW][C]33[/C][C]2004.5[/C][C]1999.83[/C][C]1990.95[/C][C]8.87457[/C][C]4.67127[/C][/ROW]
[ROW][C]34[/C][C]1985.4[/C][C]1977.18[/C][C]1963[/C][C]14.1839[/C][C]8.22023[/C][/ROW]
[ROW][C]35[/C][C]1953.5[/C][C]1940.86[/C][C]1936.54[/C][C]4.31415[/C][C]12.6442[/C][/ROW]
[ROW][C]36[/C][C]1915.3[/C][C]1923.84[/C][C]1909.74[/C][C]14.1051[/C][C]-8.54262[/C][/ROW]
[ROW][C]37[/C][C]1881.3[/C][C]1881.42[/C][C]1878.68[/C][C]2.7329[/C][C]-0.116233[/C][/ROW]
[ROW][C]38[/C][C]1821.9[/C][C]1842.92[/C][C]1847.54[/C][C]-4.62127[/C][C]-21.0162[/C][/ROW]
[ROW][C]39[/C][C]1775.2[/C][C]1797.21[/C][C]1820.02[/C][C]-22.8157[/C][C]-22.0051[/C][/ROW]
[ROW][C]40[/C][C]1790[/C][C]1786.81[/C][C]1791.89[/C][C]-5.08099[/C][C]3.19349[/C][/ROW]
[ROW][C]41[/C][C]1758.2[/C][C]1742.58[/C][C]1763.67[/C][C]-21.0879[/C][C]15.6213[/C][/ROW]
[ROW][C]42[/C][C]1747.6[/C][C]1728.21[/C][C]1735.8[/C][C]-7.59349[/C][C]19.3935[/C][/ROW]
[ROW][C]43[/C][C]1679.6[/C][C]1722.29[/C][C]1709.26[/C][C]13.0339[/C][C]-42.6923[/C][/ROW]
[ROW][C]44[/C][C]1692.3[/C][C]1689.94[/C][C]1685.99[/C][C]3.95477[/C][C]2.35773[/C][/ROW]
[ROW][C]45[/C][C]1675.4[/C][C]1674.77[/C][C]1665.9[/C][C]8.87457[/C][C]0.625434[/C][/ROW]
[ROW][C]46[/C][C]1639.3[/C][C]1660.18[/C][C]1645.99[/C][C]14.1839[/C][C]-20.8756[/C][/ROW]
[ROW][C]47[/C][C]1622.3[/C][C]1629.25[/C][C]1624.93[/C][C]4.31415[/C][C]-6.94748[/C][/ROW]
[ROW][C]48[/C][C]1577.7[/C][C]NA[/C][C]NA[/C][C]14.1051[/C][C]NA[/C][/ROW]
[ROW][C]49[/C][C]1581.9[/C][C]NA[/C][C]NA[/C][C]2.7329[/C][C]NA[/C][/ROW]
[ROW][C]50[/C][C]1562.8[/C][C]NA[/C][C]NA[/C][C]-4.62127[/C][C]NA[/C][/ROW]
[ROW][C]51[/C][C]1552.2[/C][C]NA[/C][C]NA[/C][C]-22.8157[/C][C]NA[/C][/ROW]
[ROW][C]52[/C][C]1535.2[/C][C]NA[/C][C]NA[/C][C]-5.08099[/C][C]NA[/C][/ROW]
[ROW][C]53[/C][C]1507.6[/C][C]NA[/C][C]NA[/C][C]-21.0879[/C][C]NA[/C][/ROW]
[/TABLE]
Source: https://freestatistics.org/blog/index.php?pk=298700&T=1

Globally Unique Identifier (entire table): ba.freestatistics.org/blog/index.php?pk=298700&T=1

As an alternative you can also use a QR Code:  

The GUIDs for individual cells are displayed in the table below:

Classical Decomposition by Moving Averages
tObservationsFitTrendSeasonalRandom
12622.4NANA2.7329NA
22607.5NANA-4.62127NA
32556.6NANA-22.8157NA
42569.3NANA-5.08099NA
52533.2NANA-21.0879NA
62529NANA-7.59349NA
72577.82554.212541.1813.033923.5869
82556.62529.32525.343.9547727.3036
92558.72517.582508.718.8745741.1171
102541.72504.312490.1314.183937.3869
112473.82473.832469.524.31415-0.030816
1224612461.52447.414.1051-0.500955
132435.52425.82423.062.73299.7046
142414.32391.92396.52-4.6212722.4046
152350.62344.862367.67-22.81575.74488
162329.42333.392338.48-5.08099-3.99401
172278.42291.732312.82-21.0879-13.3287
182252.92282.842290.43-7.59349-29.9398
192269.92281.092268.0513.0339-11.1881
202227.42249.12245.143.95477-21.6964
212195.62233.312224.448.87457-37.7121
222204.12220.132205.9514.1839-16.0298
232195.62192.562188.254.314153.03585
2422022186.432172.3214.105115.5699
252157.42160.462157.732.7329-3.06207
262142.52137.362141.98-4.621275.13793
272125.52102.712125.53-22.815722.7865
282110.72103.372108.45-5.080997.32682
292072.42068.172089.25-21.08794.23377
302076.72059.632067.22-7.5934917.0727
312095.82056.82043.7713.033938.9952
322023.62022.862018.913.954770.736892
332004.51999.831990.958.874574.67127
341985.41977.18196314.18398.22023
351953.51940.861936.544.3141512.6442
361915.31923.841909.7414.1051-8.54262
371881.31881.421878.682.7329-0.116233
381821.91842.921847.54-4.62127-21.0162
391775.21797.211820.02-22.8157-22.0051
4017901786.811791.89-5.080993.19349
411758.21742.581763.67-21.087915.6213
421747.61728.211735.8-7.5934919.3935
431679.61722.291709.2613.0339-42.6923
441692.31689.941685.993.954772.35773
451675.41674.771665.98.874570.625434
461639.31660.181645.9914.1839-20.8756
471622.31629.251624.934.31415-6.94748
481577.7NANA14.1051NA
491581.9NANA2.7329NA
501562.8NANA-4.62127NA
511552.2NANA-22.8157NA
521535.2NANA-5.08099NA
531507.6NANA-21.0879NA


Parameters (Session):
par1 = additive ; par2 = 12 ;
Parameters (R input):
par1 = additive ; par2 = 12 ;
R code (references can be found in the software module):
par2 <- as.numeric(par2)
x <- ts(x,freq=par2)
m <- decompose(x,type=par1)
m$figure
bitmap(file='test1.png')
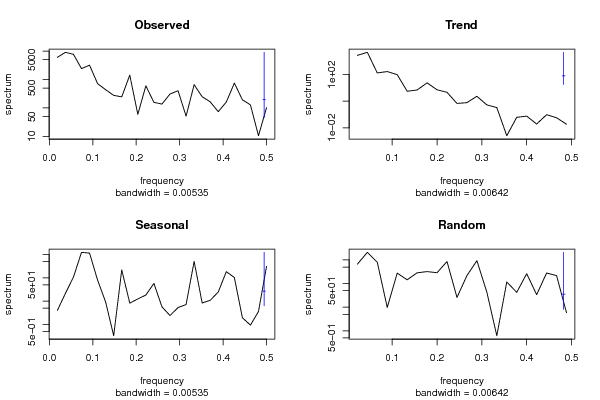
plot(m)
dev.off()
mylagmax <- length(x)/2
bitmap(file='test2.png')
op <- par(mfrow = c(2,2))
acf(as.numeric(x),lag.max = mylagmax,main='Observed')
acf(as.numeric(m$trend),na.action=na.pass,lag.max = mylagmax,main='Trend')
acf(as.numeric(m$seasonal),na.action=na.pass,lag.max = mylagmax,main='Seasonal')
acf(as.numeric(m$random),na.action=na.pass,lag.max = mylagmax,main='Random')
par(op)
dev.off()
bitmap(file='test3.png')
op <- par(mfrow = c(2,2))
spectrum(as.numeric(x),main='Observed')
spectrum(as.numeric(m$trend[!is.na(m$trend)]),main='Trend')
spectrum(as.numeric(m$seasonal[!is.na(m$seasonal)]),main='Seasonal')
spectrum(as.numeric(m$random[!is.na(m$random)]),main='Random')
par(op)
dev.off()
bitmap(file='test4.png')
op <- par(mfrow = c(2,2))
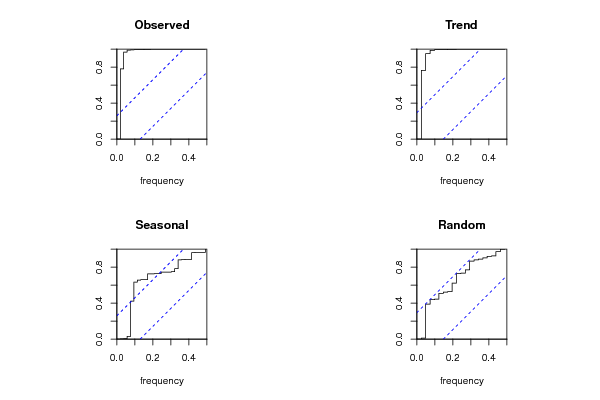
cpgram(as.numeric(x),main='Observed')
cpgram(as.numeric(m$trend[!is.na(m$trend)]),main='Trend')
cpgram(as.numeric(m$seasonal[!is.na(m$seasonal)]),main='Seasonal')
cpgram(as.numeric(m$random[!is.na(m$random)]),main='Random')
par(op)
dev.off()
load(file='createtable')
a<-table.start()
a<-table.row.start(a)
a<-table.element(a,'Classical Decomposition by Moving Averages',6,TRUE)
a<-table.row.end(a)
a<-table.row.start(a)
a<-table.element(a,'t',header=TRUE)
a<-table.element(a,'Observations',header=TRUE)
a<-table.element(a,'Fit',header=TRUE)
a<-table.element(a,'Trend',header=TRUE)
a<-table.element(a,'Seasonal',header=TRUE)
a<-table.element(a,'Random',header=TRUE)
a<-table.row.end(a)
for (i in 1:length(m$trend)) {
a<-table.row.start(a)
a<-table.element(a,i,header=TRUE)
a<-table.element(a,x[i])
if (par1 == 'additive') a<-table.element(a,signif(m$trend[i]+m$seasonal[i],6)) else a<-table.element(a,signif(m$trend[i]*m$seasonal[i],6))
a<-table.element(a,signif(m$trend[i],6))
a<-table.element(a,signif(m$seasonal[i],6))
a<-table.element(a,signif(m$random[i],6))
a<-table.row.end(a)
}
a<-table.end(a)
table.save(a,file='mytable.tab')