Free Statistics

of Irreproducible Research!

Author's title

Author*The author of this computation has been verified*
R Software Modulerwasp_arimabackwardselection.wasp
Title produced by softwareARIMA Backward Selection
Date of computationSat, 10 Dec 2016 16:15:55 +0100
Cite this page as followsStatistical Computations at FreeStatistics.org, Office for Research Development and Education, URL https://freestatistics.org/blog/index.php?v=date/2016/Dec/10/t1481383022fv969220l2ryk8k.htm/, Retrieved Fri, 01 Nov 2024 03:29:00 +0000
Statistical Computations at FreeStatistics.org, Office for Research Development and Education, URL https://freestatistics.org/blog/index.php?pk=298699, Retrieved Fri, 01 Nov 2024 03:29:00 +0000
QR Codes:

Original text written by user:
IsPrivate?No (this computation is public)
User-defined keywords
Estimated Impact84
Family? (F = Feedback message, R = changed R code, M = changed R Module, P = changed Parameters, D = changed Data)
-       [ARIMA Backward Selection] [arima backward] [2016-12-10 15:15:55] [f0fcaf0884a2ab8e55345d70fdb8db2d] [Current]
Feedback Forum

Post a new message
Dataseries X:
2888.9
2916.2
2939.5
2968.3
2986.7
3008.4
3035.3
3059
3078.4
3096.8
3125.2
3157.6
3186
3215.2
3257.8
3296
3330.6
3366.2
3402.9
3426.1
3461.3
3488
3509.5
3536
3561
3593.2
3620.4
3630.4
3643.1
3672.5
3692.2
3719.4
3744.1
3768.3
3803.5
3838.9
3860.4
3879.8
3905.5
3932.4
3959.7
3980.7
4012.8
4037.7
4065
4086.4
4106.9
4137.5
4166.3
4177.8
4176.4
4189.8
4218
4235.9
4237.9
4264.6
4295.5
4327.8
4340.1
4340.2
4375.3
4405.2
4433.3
4472
4507.4
4525.5
4562.5
4581.6
4591
4614
4643.3
4674.6
4687.4
4703.2
4728.3
4757.1
4765.2
4785.4
4810.1
4830.2
4843.3
4861.1
4875.6
4897.3
4901.5
4900.4
4914.6
4930.2
4917
4936.1
4942.3
4951.1
4975.6
4973.5
4963.4
4974.8
5001.8
5013.4
5007.9
4985.6
4967.1
4988.9
4999.8
4988.3
4975.5
4981.1
4993.4
4992.9
4994.1
5014.4
5028.6
5025.4
5021.7
5026.9
5026.6


Summary of computational transaction
Raw Input view raw input (R code)
Raw Outputview raw output of R engine
Computing time3 seconds
R ServerBig Analytics Cloud Computing Center

\begin{tabular}{lllllllll}
\hline
Summary of computational transaction \tabularnewline
Raw Input view raw input (R code)  \tabularnewline
Raw Outputview raw output of R engine  \tabularnewline
Computing time3 seconds \tabularnewline
R ServerBig Analytics Cloud Computing Center \tabularnewline
\hline
\end{tabular}
%Source: https://freestatistics.org/blog/index.php?pk=298699&T=0

[TABLE]
[ROW]
Summary of computational transaction[/C][/ROW] [ROW]Raw Input[/C] view raw input (R code) [/C][/ROW] [ROW]Raw Output[/C]view raw output of R engine [/C][/ROW] [ROW]Computing time[/C]3 seconds[/C][/ROW] [ROW]R Server[/C]Big Analytics Cloud Computing Center[/C][/ROW] [/TABLE] Source: https://freestatistics.org/blog/index.php?pk=298699&T=0

Globally Unique Identifier (entire table): ba.freestatistics.org/blog/index.php?pk=298699&T=0

As an alternative you can also use a QR Code:  

The GUIDs for individual cells are displayed in the table below:

Summary of computational transaction
Raw Input view raw input (R code)
Raw Outputview raw output of R engine
Computing time3 seconds
R ServerBig Analytics Cloud Computing Center


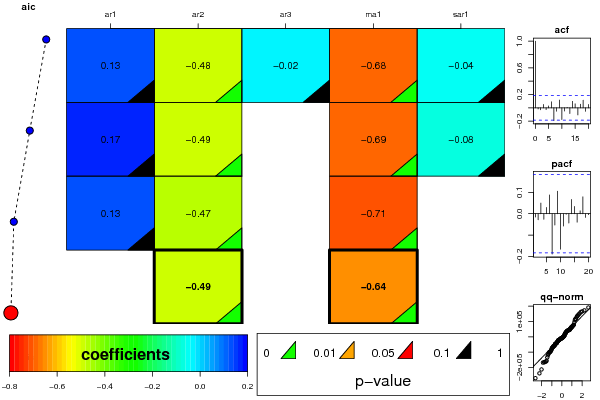
ARIMA Parameter Estimation and Backward Selection
Iterationar1ar2ar3ma1sar1
Estimates ( 1 )0.1303-0.4819-0.0214-0.6823-0.0435
(p-val)(0.7692 )(2e-04 )(0.9247 )(0 )(0.9246 )
Estimates ( 2 )0.168-0.48710-0.6873-0.0753
(p-val)(0.3387 )(1e-04 )(NA )(0 )(0.7882 )
Estimates ( 3 )0.1278-0.46790-0.71480
(p-val)(0.2032 )(0 )(NA )(0 )(NA )
Estimates ( 4 )0-0.48860-0.64370
(p-val)(NA )(0 )(NA )(0 )(NA )
Estimates ( 5 )NANANANANA
(p-val)(NA )(NA )(NA )(NA )(NA )
Estimates ( 6 )NANANANANA
(p-val)(NA )(NA )(NA )(NA )(NA )
Estimates ( 7 )NANANANANA
(p-val)(NA )(NA )(NA )(NA )(NA )
Estimates ( 8 )NANANANANA
(p-val)(NA )(NA )(NA )(NA )(NA )
Estimates ( 9 )NANANANANA
(p-val)(NA )(NA )(NA )(NA )(NA )

\begin{tabular}{lllllllll}
\hline
ARIMA Parameter Estimation and Backward Selection \tabularnewline
Iteration & ar1 & ar2 & ar3 & ma1 & sar1 \tabularnewline
Estimates ( 1 ) & 0.1303 & -0.4819 & -0.0214 & -0.6823 & -0.0435 \tabularnewline
(p-val) & (0.7692 ) & (2e-04 ) & (0.9247 ) & (0 ) & (0.9246 ) \tabularnewline
Estimates ( 2 ) & 0.168 & -0.4871 & 0 & -0.6873 & -0.0753 \tabularnewline
(p-val) & (0.3387 ) & (1e-04 ) & (NA ) & (0 ) & (0.7882 ) \tabularnewline
Estimates ( 3 ) & 0.1278 & -0.4679 & 0 & -0.7148 & 0 \tabularnewline
(p-val) & (0.2032 ) & (0 ) & (NA ) & (0 ) & (NA ) \tabularnewline
Estimates ( 4 ) & 0 & -0.4886 & 0 & -0.6437 & 0 \tabularnewline
(p-val) & (NA ) & (0 ) & (NA ) & (0 ) & (NA ) \tabularnewline
Estimates ( 5 ) & NA & NA & NA & NA & NA \tabularnewline
(p-val) & (NA ) & (NA ) & (NA ) & (NA ) & (NA ) \tabularnewline
Estimates ( 6 ) & NA & NA & NA & NA & NA \tabularnewline
(p-val) & (NA ) & (NA ) & (NA ) & (NA ) & (NA ) \tabularnewline
Estimates ( 7 ) & NA & NA & NA & NA & NA \tabularnewline
(p-val) & (NA ) & (NA ) & (NA ) & (NA ) & (NA ) \tabularnewline
Estimates ( 8 ) & NA & NA & NA & NA & NA \tabularnewline
(p-val) & (NA ) & (NA ) & (NA ) & (NA ) & (NA ) \tabularnewline
Estimates ( 9 ) & NA & NA & NA & NA & NA \tabularnewline
(p-val) & (NA ) & (NA ) & (NA ) & (NA ) & (NA ) \tabularnewline
\hline
\end{tabular}
%Source: https://freestatistics.org/blog/index.php?pk=298699&T=1

[TABLE]
[ROW][C]ARIMA Parameter Estimation and Backward Selection[/C][/ROW]
[ROW][C]Iteration[/C][C]ar1[/C][C]ar2[/C][C]ar3[/C][C]ma1[/C][C]sar1[/C][/ROW]
[ROW][C]Estimates ( 1 )[/C][C]0.1303[/C][C]-0.4819[/C][C]-0.0214[/C][C]-0.6823[/C][C]-0.0435[/C][/ROW]
[ROW][C](p-val)[/C][C](0.7692 )[/C][C](2e-04 )[/C][C](0.9247 )[/C][C](0 )[/C][C](0.9246 )[/C][/ROW]
[ROW][C]Estimates ( 2 )[/C][C]0.168[/C][C]-0.4871[/C][C]0[/C][C]-0.6873[/C][C]-0.0753[/C][/ROW]
[ROW][C](p-val)[/C][C](0.3387 )[/C][C](1e-04 )[/C][C](NA )[/C][C](0 )[/C][C](0.7882 )[/C][/ROW]
[ROW][C]Estimates ( 3 )[/C][C]0.1278[/C][C]-0.4679[/C][C]0[/C][C]-0.7148[/C][C]0[/C][/ROW]
[ROW][C](p-val)[/C][C](0.2032 )[/C][C](0 )[/C][C](NA )[/C][C](0 )[/C][C](NA )[/C][/ROW]
[ROW][C]Estimates ( 4 )[/C][C]0[/C][C]-0.4886[/C][C]0[/C][C]-0.6437[/C][C]0[/C][/ROW]
[ROW][C](p-val)[/C][C](NA )[/C][C](0 )[/C][C](NA )[/C][C](0 )[/C][C](NA )[/C][/ROW]
[ROW][C]Estimates ( 5 )[/C][C]NA[/C][C]NA[/C][C]NA[/C][C]NA[/C][C]NA[/C][/ROW]
[ROW][C](p-val)[/C][C](NA )[/C][C](NA )[/C][C](NA )[/C][C](NA )[/C][C](NA )[/C][/ROW]
[ROW][C]Estimates ( 6 )[/C][C]NA[/C][C]NA[/C][C]NA[/C][C]NA[/C][C]NA[/C][/ROW]
[ROW][C](p-val)[/C][C](NA )[/C][C](NA )[/C][C](NA )[/C][C](NA )[/C][C](NA )[/C][/ROW]
[ROW][C]Estimates ( 7 )[/C][C]NA[/C][C]NA[/C][C]NA[/C][C]NA[/C][C]NA[/C][/ROW]
[ROW][C](p-val)[/C][C](NA )[/C][C](NA )[/C][C](NA )[/C][C](NA )[/C][C](NA )[/C][/ROW]
[ROW][C]Estimates ( 8 )[/C][C]NA[/C][C]NA[/C][C]NA[/C][C]NA[/C][C]NA[/C][/ROW]
[ROW][C](p-val)[/C][C](NA )[/C][C](NA )[/C][C](NA )[/C][C](NA )[/C][C](NA )[/C][/ROW]
[ROW][C]Estimates ( 9 )[/C][C]NA[/C][C]NA[/C][C]NA[/C][C]NA[/C][C]NA[/C][/ROW]
[ROW][C](p-val)[/C][C](NA )[/C][C](NA )[/C][C](NA )[/C][C](NA )[/C][C](NA )[/C][/ROW]
[/TABLE]
Source: https://freestatistics.org/blog/index.php?pk=298699&T=1

Globally Unique Identifier (entire table): ba.freestatistics.org/blog/index.php?pk=298699&T=1

As an alternative you can also use a QR Code:  

The GUIDs for individual cells are displayed in the table below:

ARIMA Parameter Estimation and Backward Selection
Iterationar1ar2ar3ma1sar1
Estimates ( 1 )0.1303-0.4819-0.0214-0.6823-0.0435
(p-val)(0.7692 )(2e-04 )(0.9247 )(0 )(0.9246 )
Estimates ( 2 )0.168-0.48710-0.6873-0.0753
(p-val)(0.3387 )(1e-04 )(NA )(0 )(0.7882 )
Estimates ( 3 )0.1278-0.46790-0.71480
(p-val)(0.2032 )(0 )(NA )(0 )(NA )
Estimates ( 4 )0-0.48860-0.64370
(p-val)(NA )(0 )(NA )(0 )(NA )
Estimates ( 5 )NANANANANA
(p-val)(NA )(NA )(NA )(NA )(NA )
Estimates ( 6 )NANANANANA
(p-val)(NA )(NA )(NA )(NA )(NA )
Estimates ( 7 )NANANANANA
(p-val)(NA )(NA )(NA )(NA )(NA )
Estimates ( 8 )NANANANANA
(p-val)(NA )(NA )(NA )(NA )(NA )
Estimates ( 9 )NANANANANA
(p-val)(NA )(NA )(NA )(NA )(NA )


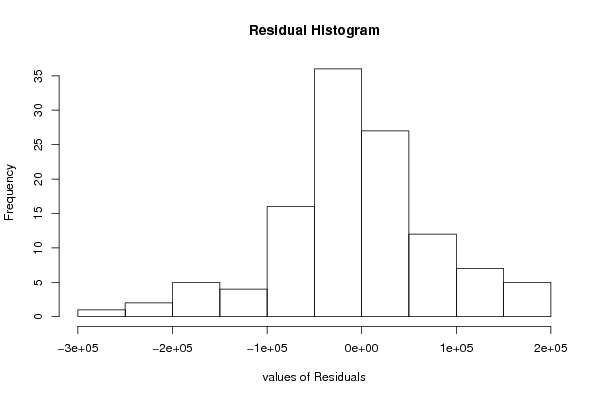
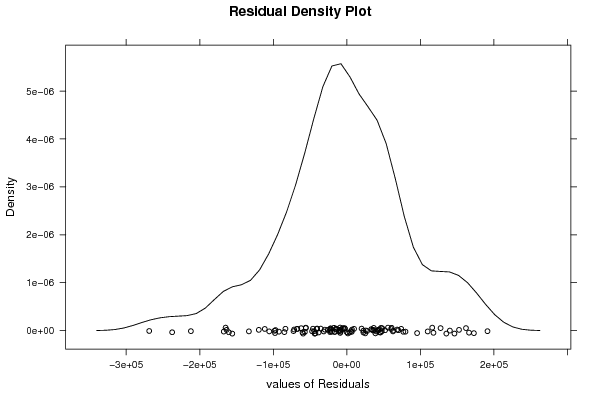
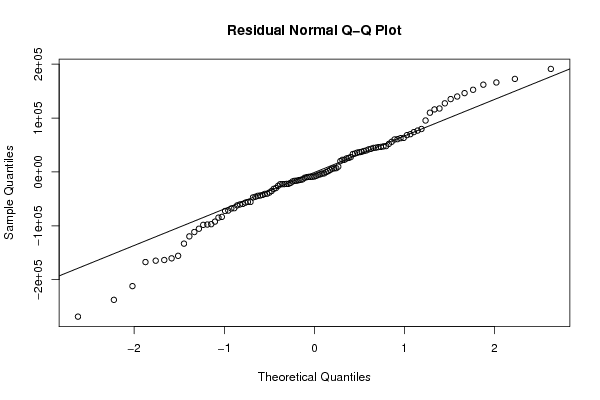
Estimated ARIMA Residuals
Value
-10842.5715312323
-16492.36533315
22523.0987161073
-57099.51380335
6709.27547042376
5986.8636417755
-8411.23995379758
-13733.8657290597
-20400.2792656181
37313.5576764485
42858.2028648651
33279.2599036589
46084.2627667945
109945.847012796
44994.3743058854
55891.1610015847
39886.0312024704
27503.1445154022
-67344.9044431932
52053.3116626814
-72521.3399628615
-40365.7499295072
-14725.3877496516
-40861.3404386303
41883.5335754548
-15324.0922708281
-105522.317674319
-55734.5848873623
22452.8358985767
-60329.2495511334
79741.3238979868
-217.508396883496
25939.3670437497
95524.6787251157
60275.0360710453
-22794.1932770463
-16373.1881804635
-8945.09102659948
-9208.74466188644
20014.9513225883
-29956.2219265915
76813.1314626439
-35496.3613144252
44580.7873009781
-43811.9636135847
-22111.8359082928
47459.2797002857
6990.12376430623
-97069.7840390982
-164883.573766883
-47292.8498360924
25002.777391009
-25951.2743854932
-83487.1961050704
127432.411158625
38865.4552260824
135299.679072827
-59458.843734093
-119718.875974529
152550.276772987
-22788.6478691101
117798.711494405
161990.653239638
70090.9882416763
-55812.5771905519
140069.502887081
-155785.089433197
-98305.48368828
-9084.46112848073
-4377.45311644301
68390.4194754586
-97691.085132774
-9786.85192699731
-2669.72625319287
36602.4750275798
-133203.020941462
62682.9637735896
-17627.9251238108
-7297.35211272538
-46111.7957842015
1392.37046962231
-67809.5231512562
47981.5940721259
-160442.305751499
-111613.32804025
-2954.36974778026
-31391.2756163813
-237562.78062205
191249.036589909
-163569.500387348
73983.3690239117
146331.298164003
-167374.328146361
-92308.1307751201
34269.9275623634
116087.415782381
9806.89200598374
-71688.7755267918
-268766.294384431
-212089.858886894
166139.609623898
-22547.8031012304
-38344.8954649493
-62099.8893033117
35844.7379143164
63201.0854423828
-5299.44669574872
60817.5962108337
172753.634057202
46434.2076854445
-44404.4301488735
-42743.1876912005
-22261.1961621232
-84947.1905637868

\begin{tabular}{lllllllll}
\hline
Estimated ARIMA Residuals \tabularnewline
Value \tabularnewline
-10842.5715312323 \tabularnewline
-16492.36533315 \tabularnewline
22523.0987161073 \tabularnewline
-57099.51380335 \tabularnewline
6709.27547042376 \tabularnewline
5986.8636417755 \tabularnewline
-8411.23995379758 \tabularnewline
-13733.8657290597 \tabularnewline
-20400.2792656181 \tabularnewline
37313.5576764485 \tabularnewline
42858.2028648651 \tabularnewline
33279.2599036589 \tabularnewline
46084.2627667945 \tabularnewline
109945.847012796 \tabularnewline
44994.3743058854 \tabularnewline
55891.1610015847 \tabularnewline
39886.0312024704 \tabularnewline
27503.1445154022 \tabularnewline
-67344.9044431932 \tabularnewline
52053.3116626814 \tabularnewline
-72521.3399628615 \tabularnewline
-40365.7499295072 \tabularnewline
-14725.3877496516 \tabularnewline
-40861.3404386303 \tabularnewline
41883.5335754548 \tabularnewline
-15324.0922708281 \tabularnewline
-105522.317674319 \tabularnewline
-55734.5848873623 \tabularnewline
22452.8358985767 \tabularnewline
-60329.2495511334 \tabularnewline
79741.3238979868 \tabularnewline
-217.508396883496 \tabularnewline
25939.3670437497 \tabularnewline
95524.6787251157 \tabularnewline
60275.0360710453 \tabularnewline
-22794.1932770463 \tabularnewline
-16373.1881804635 \tabularnewline
-8945.09102659948 \tabularnewline
-9208.74466188644 \tabularnewline
20014.9513225883 \tabularnewline
-29956.2219265915 \tabularnewline
76813.1314626439 \tabularnewline
-35496.3613144252 \tabularnewline
44580.7873009781 \tabularnewline
-43811.9636135847 \tabularnewline
-22111.8359082928 \tabularnewline
47459.2797002857 \tabularnewline
6990.12376430623 \tabularnewline
-97069.7840390982 \tabularnewline
-164883.573766883 \tabularnewline
-47292.8498360924 \tabularnewline
25002.777391009 \tabularnewline
-25951.2743854932 \tabularnewline
-83487.1961050704 \tabularnewline
127432.411158625 \tabularnewline
38865.4552260824 \tabularnewline
135299.679072827 \tabularnewline
-59458.843734093 \tabularnewline
-119718.875974529 \tabularnewline
152550.276772987 \tabularnewline
-22788.6478691101 \tabularnewline
117798.711494405 \tabularnewline
161990.653239638 \tabularnewline
70090.9882416763 \tabularnewline
-55812.5771905519 \tabularnewline
140069.502887081 \tabularnewline
-155785.089433197 \tabularnewline
-98305.48368828 \tabularnewline
-9084.46112848073 \tabularnewline
-4377.45311644301 \tabularnewline
68390.4194754586 \tabularnewline
-97691.085132774 \tabularnewline
-9786.85192699731 \tabularnewline
-2669.72625319287 \tabularnewline
36602.4750275798 \tabularnewline
-133203.020941462 \tabularnewline
62682.9637735896 \tabularnewline
-17627.9251238108 \tabularnewline
-7297.35211272538 \tabularnewline
-46111.7957842015 \tabularnewline
1392.37046962231 \tabularnewline
-67809.5231512562 \tabularnewline
47981.5940721259 \tabularnewline
-160442.305751499 \tabularnewline
-111613.32804025 \tabularnewline
-2954.36974778026 \tabularnewline
-31391.2756163813 \tabularnewline
-237562.78062205 \tabularnewline
191249.036589909 \tabularnewline
-163569.500387348 \tabularnewline
73983.3690239117 \tabularnewline
146331.298164003 \tabularnewline
-167374.328146361 \tabularnewline
-92308.1307751201 \tabularnewline
34269.9275623634 \tabularnewline
116087.415782381 \tabularnewline
9806.89200598374 \tabularnewline
-71688.7755267918 \tabularnewline
-268766.294384431 \tabularnewline
-212089.858886894 \tabularnewline
166139.609623898 \tabularnewline
-22547.8031012304 \tabularnewline
-38344.8954649493 \tabularnewline
-62099.8893033117 \tabularnewline
35844.7379143164 \tabularnewline
63201.0854423828 \tabularnewline
-5299.44669574872 \tabularnewline
60817.5962108337 \tabularnewline
172753.634057202 \tabularnewline
46434.2076854445 \tabularnewline
-44404.4301488735 \tabularnewline
-42743.1876912005 \tabularnewline
-22261.1961621232 \tabularnewline
-84947.1905637868 \tabularnewline
\hline
\end{tabular}
%Source: https://freestatistics.org/blog/index.php?pk=298699&T=2

[TABLE]
[ROW][C]Estimated ARIMA Residuals[/C][/ROW]
[ROW][C]Value[/C][/ROW]
[ROW][C]-10842.5715312323[/C][/ROW]
[ROW][C]-16492.36533315[/C][/ROW]
[ROW][C]22523.0987161073[/C][/ROW]
[ROW][C]-57099.51380335[/C][/ROW]
[ROW][C]6709.27547042376[/C][/ROW]
[ROW][C]5986.8636417755[/C][/ROW]
[ROW][C]-8411.23995379758[/C][/ROW]
[ROW][C]-13733.8657290597[/C][/ROW]
[ROW][C]-20400.2792656181[/C][/ROW]
[ROW][C]37313.5576764485[/C][/ROW]
[ROW][C]42858.2028648651[/C][/ROW]
[ROW][C]33279.2599036589[/C][/ROW]
[ROW][C]46084.2627667945[/C][/ROW]
[ROW][C]109945.847012796[/C][/ROW]
[ROW][C]44994.3743058854[/C][/ROW]
[ROW][C]55891.1610015847[/C][/ROW]
[ROW][C]39886.0312024704[/C][/ROW]
[ROW][C]27503.1445154022[/C][/ROW]
[ROW][C]-67344.9044431932[/C][/ROW]
[ROW][C]52053.3116626814[/C][/ROW]
[ROW][C]-72521.3399628615[/C][/ROW]
[ROW][C]-40365.7499295072[/C][/ROW]
[ROW][C]-14725.3877496516[/C][/ROW]
[ROW][C]-40861.3404386303[/C][/ROW]
[ROW][C]41883.5335754548[/C][/ROW]
[ROW][C]-15324.0922708281[/C][/ROW]
[ROW][C]-105522.317674319[/C][/ROW]
[ROW][C]-55734.5848873623[/C][/ROW]
[ROW][C]22452.8358985767[/C][/ROW]
[ROW][C]-60329.2495511334[/C][/ROW]
[ROW][C]79741.3238979868[/C][/ROW]
[ROW][C]-217.508396883496[/C][/ROW]
[ROW][C]25939.3670437497[/C][/ROW]
[ROW][C]95524.6787251157[/C][/ROW]
[ROW][C]60275.0360710453[/C][/ROW]
[ROW][C]-22794.1932770463[/C][/ROW]
[ROW][C]-16373.1881804635[/C][/ROW]
[ROW][C]-8945.09102659948[/C][/ROW]
[ROW][C]-9208.74466188644[/C][/ROW]
[ROW][C]20014.9513225883[/C][/ROW]
[ROW][C]-29956.2219265915[/C][/ROW]
[ROW][C]76813.1314626439[/C][/ROW]
[ROW][C]-35496.3613144252[/C][/ROW]
[ROW][C]44580.7873009781[/C][/ROW]
[ROW][C]-43811.9636135847[/C][/ROW]
[ROW][C]-22111.8359082928[/C][/ROW]
[ROW][C]47459.2797002857[/C][/ROW]
[ROW][C]6990.12376430623[/C][/ROW]
[ROW][C]-97069.7840390982[/C][/ROW]
[ROW][C]-164883.573766883[/C][/ROW]
[ROW][C]-47292.8498360924[/C][/ROW]
[ROW][C]25002.777391009[/C][/ROW]
[ROW][C]-25951.2743854932[/C][/ROW]
[ROW][C]-83487.1961050704[/C][/ROW]
[ROW][C]127432.411158625[/C][/ROW]
[ROW][C]38865.4552260824[/C][/ROW]
[ROW][C]135299.679072827[/C][/ROW]
[ROW][C]-59458.843734093[/C][/ROW]
[ROW][C]-119718.875974529[/C][/ROW]
[ROW][C]152550.276772987[/C][/ROW]
[ROW][C]-22788.6478691101[/C][/ROW]
[ROW][C]117798.711494405[/C][/ROW]
[ROW][C]161990.653239638[/C][/ROW]
[ROW][C]70090.9882416763[/C][/ROW]
[ROW][C]-55812.5771905519[/C][/ROW]
[ROW][C]140069.502887081[/C][/ROW]
[ROW][C]-155785.089433197[/C][/ROW]
[ROW][C]-98305.48368828[/C][/ROW]
[ROW][C]-9084.46112848073[/C][/ROW]
[ROW][C]-4377.45311644301[/C][/ROW]
[ROW][C]68390.4194754586[/C][/ROW]
[ROW][C]-97691.085132774[/C][/ROW]
[ROW][C]-9786.85192699731[/C][/ROW]
[ROW][C]-2669.72625319287[/C][/ROW]
[ROW][C]36602.4750275798[/C][/ROW]
[ROW][C]-133203.020941462[/C][/ROW]
[ROW][C]62682.9637735896[/C][/ROW]
[ROW][C]-17627.9251238108[/C][/ROW]
[ROW][C]-7297.35211272538[/C][/ROW]
[ROW][C]-46111.7957842015[/C][/ROW]
[ROW][C]1392.37046962231[/C][/ROW]
[ROW][C]-67809.5231512562[/C][/ROW]
[ROW][C]47981.5940721259[/C][/ROW]
[ROW][C]-160442.305751499[/C][/ROW]
[ROW][C]-111613.32804025[/C][/ROW]
[ROW][C]-2954.36974778026[/C][/ROW]
[ROW][C]-31391.2756163813[/C][/ROW]
[ROW][C]-237562.78062205[/C][/ROW]
[ROW][C]191249.036589909[/C][/ROW]
[ROW][C]-163569.500387348[/C][/ROW]
[ROW][C]73983.3690239117[/C][/ROW]
[ROW][C]146331.298164003[/C][/ROW]
[ROW][C]-167374.328146361[/C][/ROW]
[ROW][C]-92308.1307751201[/C][/ROW]
[ROW][C]34269.9275623634[/C][/ROW]
[ROW][C]116087.415782381[/C][/ROW]
[ROW][C]9806.89200598374[/C][/ROW]
[ROW][C]-71688.7755267918[/C][/ROW]
[ROW][C]-268766.294384431[/C][/ROW]
[ROW][C]-212089.858886894[/C][/ROW]
[ROW][C]166139.609623898[/C][/ROW]
[ROW][C]-22547.8031012304[/C][/ROW]
[ROW][C]-38344.8954649493[/C][/ROW]
[ROW][C]-62099.8893033117[/C][/ROW]
[ROW][C]35844.7379143164[/C][/ROW]
[ROW][C]63201.0854423828[/C][/ROW]
[ROW][C]-5299.44669574872[/C][/ROW]
[ROW][C]60817.5962108337[/C][/ROW]
[ROW][C]172753.634057202[/C][/ROW]
[ROW][C]46434.2076854445[/C][/ROW]
[ROW][C]-44404.4301488735[/C][/ROW]
[ROW][C]-42743.1876912005[/C][/ROW]
[ROW][C]-22261.1961621232[/C][/ROW]
[ROW][C]-84947.1905637868[/C][/ROW]
[/TABLE]
Source: https://freestatistics.org/blog/index.php?pk=298699&T=2

Globally Unique Identifier (entire table): ba.freestatistics.org/blog/index.php?pk=298699&T=2

As an alternative you can also use a QR Code:  

The GUIDs for individual cells are displayed in the table below:

Estimated ARIMA Residuals
Value
-10842.5715312323
-16492.36533315
22523.0987161073
-57099.51380335
6709.27547042376
5986.8636417755
-8411.23995379758
-13733.8657290597
-20400.2792656181
37313.5576764485
42858.2028648651
33279.2599036589
46084.2627667945
109945.847012796
44994.3743058854
55891.1610015847
39886.0312024704
27503.1445154022
-67344.9044431932
52053.3116626814
-72521.3399628615
-40365.7499295072
-14725.3877496516
-40861.3404386303
41883.5335754548
-15324.0922708281
-105522.317674319
-55734.5848873623
22452.8358985767
-60329.2495511334
79741.3238979868
-217.508396883496
25939.3670437497
95524.6787251157
60275.0360710453
-22794.1932770463
-16373.1881804635
-8945.09102659948
-9208.74466188644
20014.9513225883
-29956.2219265915
76813.1314626439
-35496.3613144252
44580.7873009781
-43811.9636135847
-22111.8359082928
47459.2797002857
6990.12376430623
-97069.7840390982
-164883.573766883
-47292.8498360924
25002.777391009
-25951.2743854932
-83487.1961050704
127432.411158625
38865.4552260824
135299.679072827
-59458.843734093
-119718.875974529
152550.276772987
-22788.6478691101
117798.711494405
161990.653239638
70090.9882416763
-55812.5771905519
140069.502887081
-155785.089433197
-98305.48368828
-9084.46112848073
-4377.45311644301
68390.4194754586
-97691.085132774
-9786.85192699731
-2669.72625319287
36602.4750275798
-133203.020941462
62682.9637735896
-17627.9251238108
-7297.35211272538
-46111.7957842015
1392.37046962231
-67809.5231512562
47981.5940721259
-160442.305751499
-111613.32804025
-2954.36974778026
-31391.2756163813
-237562.78062205
191249.036589909
-163569.500387348
73983.3690239117
146331.298164003
-167374.328146361
-92308.1307751201
34269.9275623634
116087.415782381
9806.89200598374
-71688.7755267918
-268766.294384431
-212089.858886894
166139.609623898
-22547.8031012304
-38344.8954649493
-62099.8893033117
35844.7379143164
63201.0854423828
-5299.44669574872
60817.5962108337
172753.634057202
46434.2076854445
-44404.4301488735
-42743.1876912005
-22261.1961621232
-84947.1905637868


Parameters (Session):
par1 = FALSE ; par2 = 2.0 ; par3 = 2 ; par4 = 0 ; par5 = 1 ; par6 = 2 ; par7 = 1 ; par8 = 1 ; par9 = 0 ;
Parameters (R input):
par1 = FALSE ; par2 = 2.0 ; par3 = 2 ; par4 = 0 ; par5 = 1 ; par6 = 3 ; par7 = 1 ; par8 = 1 ; par9 = 0 ;
R code (references can be found in the software module):
par9 <- '1'
par8 <- '1'
par7 <- '1'
par6 <- '3'
par5 <- '1'
par4 <- '0'
par3 <- '2'
par2 <- '2.0'
par1 <- 'FALSE'
library(lattice)
if (par1 == 'TRUE') par1 <- TRUE
if (par1 == 'FALSE') par1 <- FALSE
par2 <- as.numeric(par2) #Box-Cox lambda transformation parameter
par3 <- as.numeric(par3) #degree of non-seasonal differencing
par4 <- as.numeric(par4) #degree of seasonal differencing
par5 <- as.numeric(par5) #seasonal period
par6 <- as.numeric(par6) #degree (p) of the non-seasonal AR(p) polynomial
par7 <- as.numeric(par7) #degree (q) of the non-seasonal MA(q) polynomial
par8 <- as.numeric(par8) #degree (P) of the seasonal AR(P) polynomial
par9 <- as.numeric(par9) #degree (Q) of the seasonal MA(Q) polynomial
armaGR <- function(arima.out, names, n){
try1 <- arima.out$coef
try2 <- sqrt(diag(arima.out$var.coef))
try.data.frame <- data.frame(matrix(NA,ncol=4,nrow=length(names)))
dimnames(try.data.frame) <- list(names,c('coef','std','tstat','pv'))
try.data.frame[,1] <- try1
for(i in 1:length(try2)) try.data.frame[which(rownames(try.data.frame)==names(try2)[i]),2] <- try2[i]
try.data.frame[,3] <- try.data.frame[,1] / try.data.frame[,2]
try.data.frame[,4] <- round((1-pt(abs(try.data.frame[,3]),df=n-(length(try2)+1)))*2,5)
vector <- rep(NA,length(names))
vector[is.na(try.data.frame[,4])] <- 0
maxi <- which.max(try.data.frame[,4])
continue <- max(try.data.frame[,4],na.rm=TRUE) > .05
vector[maxi] <- 0
list(summary=try.data.frame,next.vector=vector,continue=continue)
}
arimaSelect <- function(series, order=c(13,0,0), seasonal=list(order=c(2,0,0),period=12), include.mean=F){
nrc <- order[1]+order[3]+seasonal$order[1]+seasonal$order[3]
coeff <- matrix(NA, nrow=nrc*2, ncol=nrc)
pval <- matrix(NA, nrow=nrc*2, ncol=nrc)
mylist <- rep(list(NULL), nrc)
names <- NULL
if(order[1] > 0) names <- paste('ar',1:order[1],sep='')
if(order[3] > 0) names <- c( names , paste('ma',1:order[3],sep='') )
if(seasonal$order[1] > 0) names <- c(names, paste('sar',1:seasonal$order[1],sep=''))
if(seasonal$order[3] > 0) names <- c(names, paste('sma',1:seasonal$order[3],sep=''))
arima.out <- arima(series, order=order, seasonal=seasonal, include.mean=include.mean, method='ML')
mylist[[1]] <- arima.out
last.arma <- armaGR(arima.out, names, length(series))
mystop <- FALSE
i <- 1
coeff[i,] <- last.arma[[1]][,1]
pval [i,] <- last.arma[[1]][,4]
i <- 2
aic <- arima.out$aic
while(!mystop){
mylist[[i]] <- arima.out
arima.out <- arima(series, order=order, seasonal=seasonal, include.mean=include.mean, method='ML', fixed=last.arma$next.vector)
aic <- c(aic, arima.out$aic)
last.arma <- armaGR(arima.out, names, length(series))
mystop <- !last.arma$continue
coeff[i,] <- last.arma[[1]][,1]
pval [i,] <- last.arma[[1]][,4]
i <- i+1
}
list(coeff, pval, mylist, aic=aic)
}
arimaSelectplot <- function(arimaSelect.out,noms,choix){
noms <- names(arimaSelect.out[[3]][[1]]$coef)
coeff <- arimaSelect.out[[1]]
k <- min(which(is.na(coeff[,1])))-1
coeff <- coeff[1:k,]
pval <- arimaSelect.out[[2]][1:k,]
aic <- arimaSelect.out$aic[1:k]
coeff[coeff==0] <- NA
n <- ncol(coeff)
if(missing(choix)) choix <- k
layout(matrix(c(1,1,1,2,
3,3,3,2,
3,3,3,4,
5,6,7,7),nr=4),
widths=c(10,35,45,15),
heights=c(30,30,15,15))
couleurs <- rainbow(75)[1:50]#(50)
ticks <- pretty(coeff)
par(mar=c(1,1,3,1))
plot(aic,k:1-.5,type='o',pch=21,bg='blue',cex=2,axes=F,lty=2,xpd=NA)
points(aic[choix],k-choix+.5,pch=21,cex=4,bg=2,xpd=NA)
title('aic',line=2)
par(mar=c(3,0,0,0))
plot(0,axes=F,xlab='',ylab='',xlim=range(ticks),ylim=c(.1,1))
rect(xleft = min(ticks) + (0:49)/50*(max(ticks)-min(ticks)),
xright = min(ticks) + (1:50)/50*(max(ticks)-min(ticks)),
ytop = rep(1,50),
ybottom= rep(0,50),col=couleurs,border=NA)
axis(1,ticks)
rect(xleft=min(ticks),xright=max(ticks),ytop=1,ybottom=0)
text(mean(coeff,na.rm=T),.5,'coefficients',cex=2,font=2)
par(mar=c(1,1,3,1))
image(1:n,1:k,t(coeff[k:1,]),axes=F,col=couleurs,zlim=range(ticks))
for(i in 1:n) for(j in 1:k) if(!is.na(coeff[j,i])) {
if(pval[j,i]<.01) symb = 'green'
else if( (pval[j,i]<.05) & (pval[j,i]>=.01)) symb = 'orange'
else if( (pval[j,i]<.1) & (pval[j,i]>=.05)) symb = 'red'
else symb = 'black'
polygon(c(i+.5 ,i+.2 ,i+.5 ,i+.5),
c(k-j+0.5,k-j+0.5,k-j+0.8,k-j+0.5),
col=symb)
if(j==choix) {
rect(xleft=i-.5,
xright=i+.5,
ybottom=k-j+1.5,
ytop=k-j+.5,
lwd=4)
text(i,
k-j+1,
round(coeff[j,i],2),
cex=1.2,
font=2)
}
else{
rect(xleft=i-.5,xright=i+.5,ybottom=k-j+1.5,ytop=k-j+.5)
text(i,k-j+1,round(coeff[j,i],2),cex=1.2,font=1)
}
}
axis(3,1:n,noms)
par(mar=c(0.5,0,0,0.5))
plot(0,axes=F,xlab='',ylab='',type='n',xlim=c(0,8),ylim=c(-.2,.8))
cols <- c('green','orange','red','black')
niv <- c('0','0.01','0.05','0.1')
for(i in 0:3){
polygon(c(1+2*i ,1+2*i ,1+2*i-.5 ,1+2*i),
c(.4 ,.7 , .4 , .4),
col=cols[i+1])
text(2*i,0.5,niv[i+1],cex=1.5)
}
text(8,.5,1,cex=1.5)
text(4,0,'p-value',cex=2)
box()
residus <- arimaSelect.out[[3]][[choix]]$res
par(mar=c(1,2,4,1))
acf(residus,main='')
title('acf',line=.5)
par(mar=c(1,2,4,1))
pacf(residus,main='')
title('pacf',line=.5)
par(mar=c(2,2,4,1))
qqnorm(residus,main='')
title('qq-norm',line=.5)
qqline(residus)
residus
}
if (par2 == 0) x <- log(x)
if (par2 != 0) x <- x^par2
(selection <- arimaSelect(x, order=c(par6,par3,par7), seasonal=list(order=c(par8,par4,par9), period=par5)))
bitmap(file='test1.png')
resid <- arimaSelectplot(selection)
dev.off()
resid
bitmap(file='test2.png')
acf(resid,length(resid)/2, main='Residual Autocorrelation Function')
dev.off()
bitmap(file='test3.png')
pacf(resid,length(resid)/2, main='Residual Partial Autocorrelation Function')
dev.off()
bitmap(file='test4.png')
cpgram(resid, main='Residual Cumulative Periodogram')
dev.off()
bitmap(file='test5.png')
hist(resid, main='Residual Histogram', xlab='values of Residuals')
dev.off()
bitmap(file='test6.png')
densityplot(~resid,col='black',main='Residual Density Plot', xlab='values of Residuals')
dev.off()
bitmap(file='test7.png')
qqnorm(resid, main='Residual Normal Q-Q Plot')
qqline(resid)
dev.off()
ncols <- length(selection[[1]][1,])
nrows <- length(selection[[2]][,1])-1
load(file='createtable')
a<-table.start()
a<-table.row.start(a)
a<-table.element(a,'ARIMA Parameter Estimation and Backward Selection', ncols+1,TRUE)
a<-table.row.end(a)
a<-table.row.start(a)
a<-table.element(a,'Iteration', header=TRUE)
for (i in 1:ncols) {
a<-table.element(a,names(selection[[3]][[1]]$coef)[i],header=TRUE)
}
a<-table.row.end(a)
for (j in 1:nrows) {
a<-table.row.start(a)
mydum <- 'Estimates ('
mydum <- paste(mydum,j)
mydum <- paste(mydum,')')
a<-table.element(a,mydum, header=TRUE)
for (i in 1:ncols) {
a<-table.element(a,round(selection[[1]][j,i],4))
}
a<-table.row.end(a)
a<-table.row.start(a)
a<-table.element(a,'(p-val)', header=TRUE)
for (i in 1:ncols) {
mydum <- '('
mydum <- paste(mydum,round(selection[[2]][j,i],4),sep='')
mydum <- paste(mydum,')')
a<-table.element(a,mydum)
}
a<-table.row.end(a)
}
a<-table.end(a)
table.save(a,file='mytable.tab')
a<-table.start()
a<-table.row.start(a)
a<-table.element(a,'Estimated ARIMA Residuals', 1,TRUE)
a<-table.row.end(a)
a<-table.row.start(a)
a<-table.element(a,'Value', 1,TRUE)
a<-table.row.end(a)
for (i in (par4*par5+par3):length(resid)) {
a<-table.row.start(a)
a<-table.element(a,resid[i])
a<-table.row.end(a)
}
a<-table.end(a)
table.save(a,file='mytable1.tab')