Free Statistics

of Irreproducible Research!

Author's title

Author*The author of this computation has been verified*
R Software Modulerwasp_exponentialsmoothing.wasp
Title produced by softwareExponential Smoothing
Date of computationFri, 09 Dec 2016 15:15:26 +0100
Cite this page as followsStatistical Computations at FreeStatistics.org, Office for Research Development and Education, URL https://freestatistics.org/blog/index.php?v=date/2016/Dec/09/t1481293409ywr221tmdqzbyvf.htm/, Retrieved Fri, 01 Nov 2024 03:39:11 +0000
Statistical Computations at FreeStatistics.org, Office for Research Development and Education, URL https://freestatistics.org/blog/index.php?pk=298556, Retrieved Fri, 01 Nov 2024 03:39:11 +0000
QR Codes:

Original text written by user:
IsPrivate?No (this computation is public)
User-defined keywords
Estimated Impact99
Family? (F = Feedback message, R = changed R code, M = changed R Module, P = changed Parameters, D = changed Data)
-     [(Partial) Autocorrelation Function] [Autocorr eerste] [2016-12-07 13:39:31] [5f979cb1c6fa86b57093c7542788c28c]
- RM      [Exponential Smoothing] [smoothing eerste ] [2016-12-09 14:15:26] [4c05fa0998bf98e29c2e453b139976f4] [Current]
Feedback Forum

Post a new message
Dataseries X:
2954.4
1769.7
1509.9
2257.2
3433.2
2083.8
1664.7
2463.3
3995.4
2447.4
2042.7
3198.6
4935.3
3024
2573.7
3957.9
5640.6
3630
3028.2
4534.2
6815.1
3962.4
3236.4
4946.1
6911.7
4376.1
3276
5187
7664.1
4283.7
3254.7
5046.6
7470.6
3655.8
2937.3
4923.9
6344.7
2981.7
2114.7
3919.5
5380.8
2661
1935.9
3669.9
5669.7
2508.9
1911.6
3758.1
5597.7
2573.4
1916.7
4160.1
5292.6
2547
1850.4
3855.6


Summary of computational transaction
Raw Input view raw input (R code)
Raw Outputview raw output of R engine
Computing time2 seconds
R ServerBig Analytics Cloud Computing Center

\begin{tabular}{lllllllll}
\hline
Summary of computational transaction \tabularnewline
Raw Input view raw input (R code)  \tabularnewline
Raw Outputview raw output of R engine  \tabularnewline
Computing time2 seconds \tabularnewline
R ServerBig Analytics Cloud Computing Center \tabularnewline
\hline
\end{tabular}
%Source: https://freestatistics.org/blog/index.php?pk=298556&T=0

[TABLE]
[ROW]
Summary of computational transaction[/C][/ROW] [ROW]Raw Input[/C] view raw input (R code) [/C][/ROW] [ROW]Raw Output[/C]view raw output of R engine [/C][/ROW] [ROW]Computing time[/C]2 seconds[/C][/ROW] [ROW]R Server[/C]Big Analytics Cloud Computing Center[/C][/ROW] [/TABLE] Source: https://freestatistics.org/blog/index.php?pk=298556&T=0

Globally Unique Identifier (entire table): ba.freestatistics.org/blog/index.php?pk=298556&T=0

As an alternative you can also use a QR Code:  

The GUIDs for individual cells are displayed in the table below:

Summary of computational transaction
Raw Input view raw input (R code)
Raw Outputview raw output of R engine
Computing time2 seconds
R ServerBig Analytics Cloud Computing Center


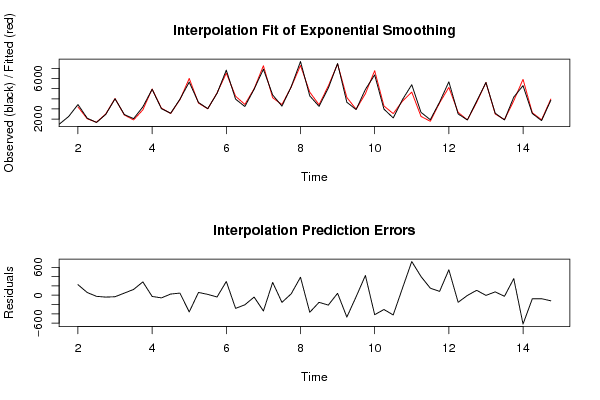
Estimated Parameters of Exponential Smoothing
ParameterValue
alpha0.26224697683842
beta0.67276933646433
gamma1

\begin{tabular}{lllllllll}
\hline
Estimated Parameters of Exponential Smoothing \tabularnewline
Parameter & Value \tabularnewline
alpha & 0.26224697683842 \tabularnewline
beta & 0.67276933646433 \tabularnewline
gamma & 1 \tabularnewline
\hline
\end{tabular}
%Source: https://freestatistics.org/blog/index.php?pk=298556&T=1

[TABLE]
[ROW][C]Estimated Parameters of Exponential Smoothing[/C][/ROW]
[ROW][C]Parameter[/C][C]Value[/C][/ROW]
[ROW][C]alpha[/C][C]0.26224697683842[/C][/ROW]
[ROW][C]beta[/C][C]0.67276933646433[/C][/ROW]
[ROW][C]gamma[/C][C]1[/C][/ROW]
[/TABLE]
Source: https://freestatistics.org/blog/index.php?pk=298556&T=1

Globally Unique Identifier (entire table): ba.freestatistics.org/blog/index.php?pk=298556&T=1

As an alternative you can also use a QR Code:  

The GUIDs for individual cells are displayed in the table below:

Estimated Parameters of Exponential Smoothing
ParameterValue
alpha0.26224697683842
beta0.67276933646433
gamma1


Interpolation Forecasts of Exponential Smoothing
tObservedFittedResiduals
53433.23206.38753213092226.81246786908
62083.82026.5439459562657.2560540437432
71664.71689.5402353642-24.8402353641989
82463.32504.52414761802-41.2241476180238
93995.44028.53646118588-33.1364611858849
102447.42402.3846734584745.0153265415302
112042.71918.82820255002123.871797449977
123198.62912.32013837917286.279861620832
134935.34962.12382280125-26.8238228012469
1430243082.22553760166-58.225537601656
152573.72549.2203920644824.4796079355242
163957.93912.7166704769845.1833295230226
175640.66000.34636392314-359.746363923136
1836303570.7210571843359.2789428156684
193028.23010.6548398454717.5451601545319
204534.24572.9105080356-38.7105080355977
216815.16519.81281165305295.287188346946
223962.44247.00484216503-284.604842165033
233236.43443.12622943046-206.726229430456
244946.14985.89598571606-39.7959857160595
256911.77253.00813111506-341.308131115064
264376.14100.64321426053275.45678573947
2732763430.27706520753-154.277065207532
2851875157.0877416294229.9122583705803
297664.17277.67122417857386.428775821432
304283.74651.56414416302-367.864144163016
313254.73408.45687001845-153.756870018451
325046.65259.68728873084-213.08728873084
337470.67429.4035050631341.1964949368676
343655.84127.50698157836-471.706981578359
352937.32969.67155907665-32.3715590766515
364923.94499.05732779235424.842672207647
376344.76765.18891666086-420.48891666086
382981.73289.93126942519-308.231269425193
392114.72539.72215283075-425.022152830754
403919.53767.45497532628152.045024673716
415380.84655.91832554819724.881674451813
4226612260.11677936424400.88322063576
431935.91784.7408746433151.159125356703
443669.93587.7552273654882.1447726345245
455669.75121.64766639036548.05233360964
462508.92661.88409228076-152.984092280758
471911.61916.8819607496-5.28196074959828
483758.13652.26365227134105.836347728663
495597.75602.34405665776-4.64405665775575
502573.42501.9478187537571.4521812462522
511916.71940.17893771856-23.4789377185562
524160.13803.05154995502357.048450044979
535292.65914.49049272006-621.890492720056
5425472624.50980983417-77.5098098341723
551850.41926.02871294212-75.6287129421173
563855.63976.90200531645-121.302005316451

\begin{tabular}{lllllllll}
\hline
Interpolation Forecasts of Exponential Smoothing \tabularnewline
t & Observed & Fitted & Residuals \tabularnewline
5 & 3433.2 & 3206.38753213092 & 226.81246786908 \tabularnewline
6 & 2083.8 & 2026.54394595626 & 57.2560540437432 \tabularnewline
7 & 1664.7 & 1689.5402353642 & -24.8402353641989 \tabularnewline
8 & 2463.3 & 2504.52414761802 & -41.2241476180238 \tabularnewline
9 & 3995.4 & 4028.53646118588 & -33.1364611858849 \tabularnewline
10 & 2447.4 & 2402.38467345847 & 45.0153265415302 \tabularnewline
11 & 2042.7 & 1918.82820255002 & 123.871797449977 \tabularnewline
12 & 3198.6 & 2912.32013837917 & 286.279861620832 \tabularnewline
13 & 4935.3 & 4962.12382280125 & -26.8238228012469 \tabularnewline
14 & 3024 & 3082.22553760166 & -58.225537601656 \tabularnewline
15 & 2573.7 & 2549.22039206448 & 24.4796079355242 \tabularnewline
16 & 3957.9 & 3912.71667047698 & 45.1833295230226 \tabularnewline
17 & 5640.6 & 6000.34636392314 & -359.746363923136 \tabularnewline
18 & 3630 & 3570.72105718433 & 59.2789428156684 \tabularnewline
19 & 3028.2 & 3010.65483984547 & 17.5451601545319 \tabularnewline
20 & 4534.2 & 4572.9105080356 & -38.7105080355977 \tabularnewline
21 & 6815.1 & 6519.81281165305 & 295.287188346946 \tabularnewline
22 & 3962.4 & 4247.00484216503 & -284.604842165033 \tabularnewline
23 & 3236.4 & 3443.12622943046 & -206.726229430456 \tabularnewline
24 & 4946.1 & 4985.89598571606 & -39.7959857160595 \tabularnewline
25 & 6911.7 & 7253.00813111506 & -341.308131115064 \tabularnewline
26 & 4376.1 & 4100.64321426053 & 275.45678573947 \tabularnewline
27 & 3276 & 3430.27706520753 & -154.277065207532 \tabularnewline
28 & 5187 & 5157.08774162942 & 29.9122583705803 \tabularnewline
29 & 7664.1 & 7277.67122417857 & 386.428775821432 \tabularnewline
30 & 4283.7 & 4651.56414416302 & -367.864144163016 \tabularnewline
31 & 3254.7 & 3408.45687001845 & -153.756870018451 \tabularnewline
32 & 5046.6 & 5259.68728873084 & -213.08728873084 \tabularnewline
33 & 7470.6 & 7429.40350506313 & 41.1964949368676 \tabularnewline
34 & 3655.8 & 4127.50698157836 & -471.706981578359 \tabularnewline
35 & 2937.3 & 2969.67155907665 & -32.3715590766515 \tabularnewline
36 & 4923.9 & 4499.05732779235 & 424.842672207647 \tabularnewline
37 & 6344.7 & 6765.18891666086 & -420.48891666086 \tabularnewline
38 & 2981.7 & 3289.93126942519 & -308.231269425193 \tabularnewline
39 & 2114.7 & 2539.72215283075 & -425.022152830754 \tabularnewline
40 & 3919.5 & 3767.45497532628 & 152.045024673716 \tabularnewline
41 & 5380.8 & 4655.91832554819 & 724.881674451813 \tabularnewline
42 & 2661 & 2260.11677936424 & 400.88322063576 \tabularnewline
43 & 1935.9 & 1784.7408746433 & 151.159125356703 \tabularnewline
44 & 3669.9 & 3587.75522736548 & 82.1447726345245 \tabularnewline
45 & 5669.7 & 5121.64766639036 & 548.05233360964 \tabularnewline
46 & 2508.9 & 2661.88409228076 & -152.984092280758 \tabularnewline
47 & 1911.6 & 1916.8819607496 & -5.28196074959828 \tabularnewline
48 & 3758.1 & 3652.26365227134 & 105.836347728663 \tabularnewline
49 & 5597.7 & 5602.34405665776 & -4.64405665775575 \tabularnewline
50 & 2573.4 & 2501.94781875375 & 71.4521812462522 \tabularnewline
51 & 1916.7 & 1940.17893771856 & -23.4789377185562 \tabularnewline
52 & 4160.1 & 3803.05154995502 & 357.048450044979 \tabularnewline
53 & 5292.6 & 5914.49049272006 & -621.890492720056 \tabularnewline
54 & 2547 & 2624.50980983417 & -77.5098098341723 \tabularnewline
55 & 1850.4 & 1926.02871294212 & -75.6287129421173 \tabularnewline
56 & 3855.6 & 3976.90200531645 & -121.302005316451 \tabularnewline
\hline
\end{tabular}
%Source: https://freestatistics.org/blog/index.php?pk=298556&T=2

[TABLE]
[ROW][C]Interpolation Forecasts of Exponential Smoothing[/C][/ROW]
[ROW][C]t[/C][C]Observed[/C][C]Fitted[/C][C]Residuals[/C][/ROW]
[ROW][C]5[/C][C]3433.2[/C][C]3206.38753213092[/C][C]226.81246786908[/C][/ROW]
[ROW][C]6[/C][C]2083.8[/C][C]2026.54394595626[/C][C]57.2560540437432[/C][/ROW]
[ROW][C]7[/C][C]1664.7[/C][C]1689.5402353642[/C][C]-24.8402353641989[/C][/ROW]
[ROW][C]8[/C][C]2463.3[/C][C]2504.52414761802[/C][C]-41.2241476180238[/C][/ROW]
[ROW][C]9[/C][C]3995.4[/C][C]4028.53646118588[/C][C]-33.1364611858849[/C][/ROW]
[ROW][C]10[/C][C]2447.4[/C][C]2402.38467345847[/C][C]45.0153265415302[/C][/ROW]
[ROW][C]11[/C][C]2042.7[/C][C]1918.82820255002[/C][C]123.871797449977[/C][/ROW]
[ROW][C]12[/C][C]3198.6[/C][C]2912.32013837917[/C][C]286.279861620832[/C][/ROW]
[ROW][C]13[/C][C]4935.3[/C][C]4962.12382280125[/C][C]-26.8238228012469[/C][/ROW]
[ROW][C]14[/C][C]3024[/C][C]3082.22553760166[/C][C]-58.225537601656[/C][/ROW]
[ROW][C]15[/C][C]2573.7[/C][C]2549.22039206448[/C][C]24.4796079355242[/C][/ROW]
[ROW][C]16[/C][C]3957.9[/C][C]3912.71667047698[/C][C]45.1833295230226[/C][/ROW]
[ROW][C]17[/C][C]5640.6[/C][C]6000.34636392314[/C][C]-359.746363923136[/C][/ROW]
[ROW][C]18[/C][C]3630[/C][C]3570.72105718433[/C][C]59.2789428156684[/C][/ROW]
[ROW][C]19[/C][C]3028.2[/C][C]3010.65483984547[/C][C]17.5451601545319[/C][/ROW]
[ROW][C]20[/C][C]4534.2[/C][C]4572.9105080356[/C][C]-38.7105080355977[/C][/ROW]
[ROW][C]21[/C][C]6815.1[/C][C]6519.81281165305[/C][C]295.287188346946[/C][/ROW]
[ROW][C]22[/C][C]3962.4[/C][C]4247.00484216503[/C][C]-284.604842165033[/C][/ROW]
[ROW][C]23[/C][C]3236.4[/C][C]3443.12622943046[/C][C]-206.726229430456[/C][/ROW]
[ROW][C]24[/C][C]4946.1[/C][C]4985.89598571606[/C][C]-39.7959857160595[/C][/ROW]
[ROW][C]25[/C][C]6911.7[/C][C]7253.00813111506[/C][C]-341.308131115064[/C][/ROW]
[ROW][C]26[/C][C]4376.1[/C][C]4100.64321426053[/C][C]275.45678573947[/C][/ROW]
[ROW][C]27[/C][C]3276[/C][C]3430.27706520753[/C][C]-154.277065207532[/C][/ROW]
[ROW][C]28[/C][C]5187[/C][C]5157.08774162942[/C][C]29.9122583705803[/C][/ROW]
[ROW][C]29[/C][C]7664.1[/C][C]7277.67122417857[/C][C]386.428775821432[/C][/ROW]
[ROW][C]30[/C][C]4283.7[/C][C]4651.56414416302[/C][C]-367.864144163016[/C][/ROW]
[ROW][C]31[/C][C]3254.7[/C][C]3408.45687001845[/C][C]-153.756870018451[/C][/ROW]
[ROW][C]32[/C][C]5046.6[/C][C]5259.68728873084[/C][C]-213.08728873084[/C][/ROW]
[ROW][C]33[/C][C]7470.6[/C][C]7429.40350506313[/C][C]41.1964949368676[/C][/ROW]
[ROW][C]34[/C][C]3655.8[/C][C]4127.50698157836[/C][C]-471.706981578359[/C][/ROW]
[ROW][C]35[/C][C]2937.3[/C][C]2969.67155907665[/C][C]-32.3715590766515[/C][/ROW]
[ROW][C]36[/C][C]4923.9[/C][C]4499.05732779235[/C][C]424.842672207647[/C][/ROW]
[ROW][C]37[/C][C]6344.7[/C][C]6765.18891666086[/C][C]-420.48891666086[/C][/ROW]
[ROW][C]38[/C][C]2981.7[/C][C]3289.93126942519[/C][C]-308.231269425193[/C][/ROW]
[ROW][C]39[/C][C]2114.7[/C][C]2539.72215283075[/C][C]-425.022152830754[/C][/ROW]
[ROW][C]40[/C][C]3919.5[/C][C]3767.45497532628[/C][C]152.045024673716[/C][/ROW]
[ROW][C]41[/C][C]5380.8[/C][C]4655.91832554819[/C][C]724.881674451813[/C][/ROW]
[ROW][C]42[/C][C]2661[/C][C]2260.11677936424[/C][C]400.88322063576[/C][/ROW]
[ROW][C]43[/C][C]1935.9[/C][C]1784.7408746433[/C][C]151.159125356703[/C][/ROW]
[ROW][C]44[/C][C]3669.9[/C][C]3587.75522736548[/C][C]82.1447726345245[/C][/ROW]
[ROW][C]45[/C][C]5669.7[/C][C]5121.64766639036[/C][C]548.05233360964[/C][/ROW]
[ROW][C]46[/C][C]2508.9[/C][C]2661.88409228076[/C][C]-152.984092280758[/C][/ROW]
[ROW][C]47[/C][C]1911.6[/C][C]1916.8819607496[/C][C]-5.28196074959828[/C][/ROW]
[ROW][C]48[/C][C]3758.1[/C][C]3652.26365227134[/C][C]105.836347728663[/C][/ROW]
[ROW][C]49[/C][C]5597.7[/C][C]5602.34405665776[/C][C]-4.64405665775575[/C][/ROW]
[ROW][C]50[/C][C]2573.4[/C][C]2501.94781875375[/C][C]71.4521812462522[/C][/ROW]
[ROW][C]51[/C][C]1916.7[/C][C]1940.17893771856[/C][C]-23.4789377185562[/C][/ROW]
[ROW][C]52[/C][C]4160.1[/C][C]3803.05154995502[/C][C]357.048450044979[/C][/ROW]
[ROW][C]53[/C][C]5292.6[/C][C]5914.49049272006[/C][C]-621.890492720056[/C][/ROW]
[ROW][C]54[/C][C]2547[/C][C]2624.50980983417[/C][C]-77.5098098341723[/C][/ROW]
[ROW][C]55[/C][C]1850.4[/C][C]1926.02871294212[/C][C]-75.6287129421173[/C][/ROW]
[ROW][C]56[/C][C]3855.6[/C][C]3976.90200531645[/C][C]-121.302005316451[/C][/ROW]
[/TABLE]
Source: https://freestatistics.org/blog/index.php?pk=298556&T=2

Globally Unique Identifier (entire table): ba.freestatistics.org/blog/index.php?pk=298556&T=2

As an alternative you can also use a QR Code:  

The GUIDs for individual cells are displayed in the table below:

Interpolation Forecasts of Exponential Smoothing
tObservedFittedResiduals
53433.23206.38753213092226.81246786908
62083.82026.5439459562657.2560540437432
71664.71689.5402353642-24.8402353641989
82463.32504.52414761802-41.2241476180238
93995.44028.53646118588-33.1364611858849
102447.42402.3846734584745.0153265415302
112042.71918.82820255002123.871797449977
123198.62912.32013837917286.279861620832
134935.34962.12382280125-26.8238228012469
1430243082.22553760166-58.225537601656
152573.72549.2203920644824.4796079355242
163957.93912.7166704769845.1833295230226
175640.66000.34636392314-359.746363923136
1836303570.7210571843359.2789428156684
193028.23010.6548398454717.5451601545319
204534.24572.9105080356-38.7105080355977
216815.16519.81281165305295.287188346946
223962.44247.00484216503-284.604842165033
233236.43443.12622943046-206.726229430456
244946.14985.89598571606-39.7959857160595
256911.77253.00813111506-341.308131115064
264376.14100.64321426053275.45678573947
2732763430.27706520753-154.277065207532
2851875157.0877416294229.9122583705803
297664.17277.67122417857386.428775821432
304283.74651.56414416302-367.864144163016
313254.73408.45687001845-153.756870018451
325046.65259.68728873084-213.08728873084
337470.67429.4035050631341.1964949368676
343655.84127.50698157836-471.706981578359
352937.32969.67155907665-32.3715590766515
364923.94499.05732779235424.842672207647
376344.76765.18891666086-420.48891666086
382981.73289.93126942519-308.231269425193
392114.72539.72215283075-425.022152830754
403919.53767.45497532628152.045024673716
415380.84655.91832554819724.881674451813
4226612260.11677936424400.88322063576
431935.91784.7408746433151.159125356703
443669.93587.7552273654882.1447726345245
455669.75121.64766639036548.05233360964
462508.92661.88409228076-152.984092280758
471911.61916.8819607496-5.28196074959828
483758.13652.26365227134105.836347728663
495597.75602.34405665776-4.64405665775575
502573.42501.9478187537571.4521812462522
511916.71940.17893771856-23.4789377185562
524160.13803.05154995502357.048450044979
535292.65914.49049272006-621.890492720056
5425472624.50980983417-77.5098098341723
551850.41926.02871294212-75.6287129421173
563855.63976.90200531645-121.302005316451


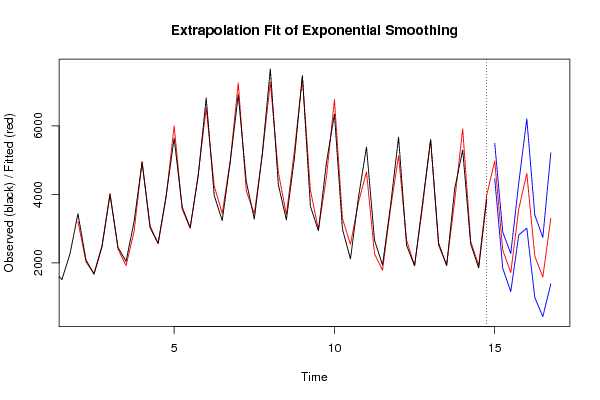
Extrapolation Forecasts of Exponential Smoothing
tForecast95% Lower Bound95% Upper Bound
574974.382305494324456.53620907635492.22840191234
582368.291366870181838.85474130982897.72799243055
591714.989649101971158.875973722062271.10332448187
603577.797825578372815.732609240614339.86304191613
614609.395598871623011.003953465756207.7872442775
622191.27501262189986.4106517052943396.13937353849
631584.36299431845426.4863585406242742.23963009628
643299.995651156741384.263017561065215.72828475243

\begin{tabular}{lllllllll}
\hline
Extrapolation Forecasts of Exponential Smoothing \tabularnewline
t & Forecast & 95% Lower Bound & 95% Upper Bound \tabularnewline
57 & 4974.38230549432 & 4456.5362090763 & 5492.22840191234 \tabularnewline
58 & 2368.29136687018 & 1838.8547413098 & 2897.72799243055 \tabularnewline
59 & 1714.98964910197 & 1158.87597372206 & 2271.10332448187 \tabularnewline
60 & 3577.79782557837 & 2815.73260924061 & 4339.86304191613 \tabularnewline
61 & 4609.39559887162 & 3011.00395346575 & 6207.7872442775 \tabularnewline
62 & 2191.27501262189 & 986.410651705294 & 3396.13937353849 \tabularnewline
63 & 1584.36299431845 & 426.486358540624 & 2742.23963009628 \tabularnewline
64 & 3299.99565115674 & 1384.26301756106 & 5215.72828475243 \tabularnewline
\hline
\end{tabular}
%Source: https://freestatistics.org/blog/index.php?pk=298556&T=3

[TABLE]
[ROW][C]Extrapolation Forecasts of Exponential Smoothing[/C][/ROW]
[ROW][C]t[/C][C]Forecast[/C][C]95% Lower Bound[/C][C]95% Upper Bound[/C][/ROW]
[ROW][C]57[/C][C]4974.38230549432[/C][C]4456.5362090763[/C][C]5492.22840191234[/C][/ROW]
[ROW][C]58[/C][C]2368.29136687018[/C][C]1838.8547413098[/C][C]2897.72799243055[/C][/ROW]
[ROW][C]59[/C][C]1714.98964910197[/C][C]1158.87597372206[/C][C]2271.10332448187[/C][/ROW]
[ROW][C]60[/C][C]3577.79782557837[/C][C]2815.73260924061[/C][C]4339.86304191613[/C][/ROW]
[ROW][C]61[/C][C]4609.39559887162[/C][C]3011.00395346575[/C][C]6207.7872442775[/C][/ROW]
[ROW][C]62[/C][C]2191.27501262189[/C][C]986.410651705294[/C][C]3396.13937353849[/C][/ROW]
[ROW][C]63[/C][C]1584.36299431845[/C][C]426.486358540624[/C][C]2742.23963009628[/C][/ROW]
[ROW][C]64[/C][C]3299.99565115674[/C][C]1384.26301756106[/C][C]5215.72828475243[/C][/ROW]
[/TABLE]
Source: https://freestatistics.org/blog/index.php?pk=298556&T=3

Globally Unique Identifier (entire table): ba.freestatistics.org/blog/index.php?pk=298556&T=3

As an alternative you can also use a QR Code:  

The GUIDs for individual cells are displayed in the table below:

Extrapolation Forecasts of Exponential Smoothing
tForecast95% Lower Bound95% Upper Bound
574974.382305494324456.53620907635492.22840191234
582368.291366870181838.85474130982897.72799243055
591714.989649101971158.875973722062271.10332448187
603577.797825578372815.732609240614339.86304191613
614609.395598871623011.003953465756207.7872442775
622191.27501262189986.4106517052943396.13937353849
631584.36299431845426.4863585406242742.23963009628
643299.995651156741384.263017561065215.72828475243


Parameters (Session):
par1 = Default ; par2 = 1 ; par3 = 1 ; par4 = 1 ; par5 = 4 ; par6 = White Noise ; par7 = 0.95 ;
Parameters (R input):
par1 = 4 ; par2 = Triple ; par3 = multiplicative ; par4 = 8 ;
R code (references can be found in the software module):
par1 <- as.numeric(par1)
par4 <- as.numeric(par4)
if (par2 == 'Single') K <- 1
if (par2 == 'Double') K <- 2
if (par2 == 'Triple') K <- par1
nx <- length(x)
nxmK <- nx - K
x <- ts(x, frequency = par1)
if (par2 == 'Single') fit <- HoltWinters(x, gamma=F, beta=F)
if (par2 == 'Double') fit <- HoltWinters(x, gamma=F)
if (par2 == 'Triple') fit <- HoltWinters(x, seasonal=par3)
fit
myresid <- x - fit$fitted[,'xhat']
bitmap(file='test1.png')
op <- par(mfrow=c(2,1))
plot(fit,ylab='Observed (black) / Fitted (red)',main='Interpolation Fit of Exponential Smoothing')
plot(myresid,ylab='Residuals',main='Interpolation Prediction Errors')
par(op)
dev.off()
bitmap(file='test2.png')
p <- predict(fit, par4, prediction.interval=TRUE)
np <- length(p[,1])
plot(fit,p,ylab='Observed (black) / Fitted (red)',main='Extrapolation Fit of Exponential Smoothing')
dev.off()
bitmap(file='test3.png')
op <- par(mfrow = c(2,2))
acf(as.numeric(myresid),lag.max = nx/2,main='Residual ACF')
spectrum(myresid,main='Residals Periodogram')
cpgram(myresid,main='Residal Cumulative Periodogram')
qqnorm(myresid,main='Residual Normal QQ Plot')
qqline(myresid)
par(op)
dev.off()
load(file='createtable')
a<-table.start()
a<-table.row.start(a)
a<-table.element(a,'Estimated Parameters of Exponential Smoothing',2,TRUE)
a<-table.row.end(a)
a<-table.row.start(a)
a<-table.element(a,'Parameter',header=TRUE)
a<-table.element(a,'Value',header=TRUE)
a<-table.row.end(a)
a<-table.row.start(a)
a<-table.element(a,'alpha',header=TRUE)
a<-table.element(a,fit$alpha)
a<-table.row.end(a)
a<-table.row.start(a)
a<-table.element(a,'beta',header=TRUE)
a<-table.element(a,fit$beta)
a<-table.row.end(a)
a<-table.row.start(a)
a<-table.element(a,'gamma',header=TRUE)
a<-table.element(a,fit$gamma)
a<-table.row.end(a)
a<-table.end(a)
table.save(a,file='mytable.tab')
a<-table.start()
a<-table.row.start(a)
a<-table.element(a,'Interpolation Forecasts of Exponential Smoothing',4,TRUE)
a<-table.row.end(a)
a<-table.row.start(a)
a<-table.element(a,'t',header=TRUE)
a<-table.element(a,'Observed',header=TRUE)
a<-table.element(a,'Fitted',header=TRUE)
a<-table.element(a,'Residuals',header=TRUE)
a<-table.row.end(a)
for (i in 1:nxmK) {
a<-table.row.start(a)
a<-table.element(a,i+K,header=TRUE)
a<-table.element(a,x[i+K])
a<-table.element(a,fit$fitted[i,'xhat'])
a<-table.element(a,myresid[i])
a<-table.row.end(a)
}
a<-table.end(a)
table.save(a,file='mytable1.tab')
a<-table.start()
a<-table.row.start(a)
a<-table.element(a,'Extrapolation Forecasts of Exponential Smoothing',4,TRUE)
a<-table.row.end(a)
a<-table.row.start(a)
a<-table.element(a,'t',header=TRUE)
a<-table.element(a,'Forecast',header=TRUE)
a<-table.element(a,'95% Lower Bound',header=TRUE)
a<-table.element(a,'95% Upper Bound',header=TRUE)
a<-table.row.end(a)
for (i in 1:np) {
a<-table.row.start(a)
a<-table.element(a,nx+i,header=TRUE)
a<-table.element(a,p[i,'fit'])
a<-table.element(a,p[i,'lwr'])
a<-table.element(a,p[i,'upr'])
a<-table.row.end(a)
}
a<-table.end(a)
table.save(a,file='mytable2.tab')