Free Statistics

of Irreproducible Research!

Author's title

Author*The author of this computation has been verified*
R Software Modulerwasp_autocorrelation.wasp
Title produced by software(Partial) Autocorrelation Function
Date of computationFri, 09 Dec 2016 14:09:06 +0100
Cite this page as followsStatistical Computations at FreeStatistics.org, Office for Research Development and Education, URL https://freestatistics.org/blog/index.php?v=date/2016/Dec/09/t1481289377bbttp75yzlx7vu5.htm/, Retrieved Fri, 01 Nov 2024 03:40:35 +0000
Statistical Computations at FreeStatistics.org, Office for Research Development and Education, URL https://freestatistics.org/blog/index.php?pk=298528, Retrieved Fri, 01 Nov 2024 03:40:35 +0000
QR Codes:

Original text written by user:
IsPrivate?No (this computation is public)
User-defined keywordsF1 competition
Estimated Impact70
Family? (F = Feedback message, R = changed R code, M = changed R Module, P = changed Parameters, D = changed Data)
-       [(Partial) Autocorrelation Function] [Partial Autocorre...] [2016-12-09 13:09:06] [00d6a26c230b6c589ee3bbc701d55499] [Current]
Feedback Forum

Post a new message
Dataseries X:
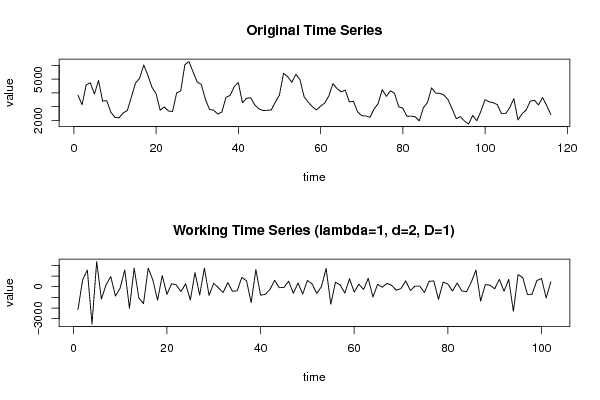
3840
3140
4580
4740
3920
4900
3400
3440
2600
2220
2190
2550
2720
3720
4710
5070
6030
5280
4420
3940
2750
2980
2690
2650
4000
4150
6050
6280
5520
4800
4610
3530
2790
2750
2470
2610
3680
3820
4460
4760
3290
3610
3650
3130
2850
2720
2740
2760
3330
3850
5430
5180
4770
5360
4950
3720
3330
3000
2760
3040
3260
3780
4670
4320
4080
4210
3350
3390
2630
2350
2330
2230
2830
3230
4240
3750
4160
3960
3000
2890
2300
2320
2270
1970
2920
3310
4370
3990
3970
3850
3510
2840
2130
2280
1960
1740
2370
1980
2680
3510
3350
3290
3150
2490
2490
2930
3590
2040
2480
2760
3400
3470
3130
3670
3080
2430


Summary of computational transaction
Raw Input view raw input (R code)
Raw Outputview raw output of R engine
Computing time1 seconds
R ServerBig Analytics Cloud Computing Center

\begin{tabular}{lllllllll}
\hline
Summary of computational transaction \tabularnewline
Raw Input view raw input (R code)  \tabularnewline
Raw Outputview raw output of R engine  \tabularnewline
Computing time1 seconds \tabularnewline
R ServerBig Analytics Cloud Computing Center \tabularnewline
\hline
\end{tabular}
%Source: https://freestatistics.org/blog/index.php?pk=298528&T=0

[TABLE]
[ROW]
Summary of computational transaction[/C][/ROW] [ROW]Raw Input[/C] view raw input (R code) [/C][/ROW] [ROW]Raw Output[/C]view raw output of R engine [/C][/ROW] [ROW]Computing time[/C]1 seconds[/C][/ROW] [ROW]R Server[/C]Big Analytics Cloud Computing Center[/C][/ROW] [/TABLE] Source: https://freestatistics.org/blog/index.php?pk=298528&T=0

Globally Unique Identifier (entire table): ba.freestatistics.org/blog/index.php?pk=298528&T=0

As an alternative you can also use a QR Code:  

The GUIDs for individual cells are displayed in the table below:

Summary of computational transaction
Raw Input view raw input (R code)
Raw Outputview raw output of R engine
Computing time1 seconds
R ServerBig Analytics Cloud Computing Center


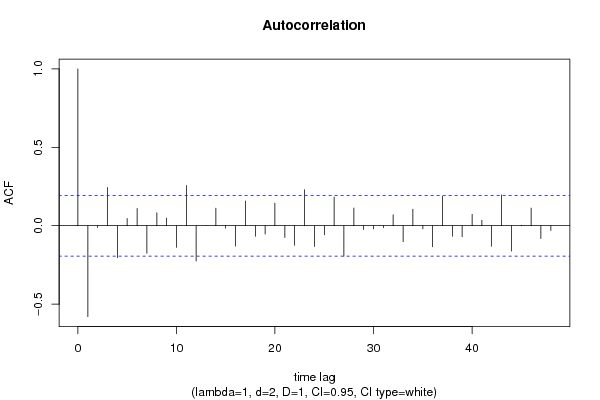
Autocorrelation Function
Time lag kACF(k)T-STATP-value
1-0.579923-5.85690
2-0.011531-0.11650.453759
30.2444112.46840.007617
4-0.203607-2.05630.021152
50.0458950.46350.321992
60.1095581.10650.13556
7-0.176097-1.77850.039151
80.08270.83520.20277
90.0483580.48840.313162
10-0.137524-1.38890.08394
110.2568292.59380.005443
12-0.225432-2.27680.012445
130.000340.00340.498633
140.1115541.12660.131268
15-0.015313-0.15470.438701
16-0.12993-1.31220.096194
170.1568661.58430.058114
18-0.067124-0.67790.249679
19-0.052595-0.53120.298223
200.1435641.44990.075074
21-0.075639-0.76390.223339
22-0.124495-1.25730.105752
230.2300182.32310.01108
24-0.13245-1.33770.091987
25-0.057125-0.57690.282629
260.1824281.84240.034159
27-0.194334-1.96270.026204
280.1122931.13410.129706
29-0.023956-0.24190.404657
30-0.020264-0.20470.419124
31-0.012264-0.12390.450834
320.0705820.71280.238784
33-0.101329-1.02340.154276
340.1048311.05870.14611
35-0.020057-0.20260.419939
36-0.134661-1.360.088412
370.1872121.89070.030748
38-0.067335-0.680.249007
39-0.069854-0.70550.241058
400.0724710.73190.232946
410.0352720.35620.361201
42-0.130873-1.32170.094604
430.195621.97570.025447
44-0.161244-1.62850.053253
450.0029360.02970.488201
460.1122521.13370.129792
47-0.081745-0.82560.205483
48-0.029718-0.30010.382341

\begin{tabular}{lllllllll}
\hline
Autocorrelation Function \tabularnewline
Time lag k & ACF(k) & T-STAT & P-value \tabularnewline
1 & -0.579923 & -5.8569 & 0 \tabularnewline
2 & -0.011531 & -0.1165 & 0.453759 \tabularnewline
3 & 0.244411 & 2.4684 & 0.007617 \tabularnewline
4 & -0.203607 & -2.0563 & 0.021152 \tabularnewline
5 & 0.045895 & 0.4635 & 0.321992 \tabularnewline
6 & 0.109558 & 1.1065 & 0.13556 \tabularnewline
7 & -0.176097 & -1.7785 & 0.039151 \tabularnewline
8 & 0.0827 & 0.8352 & 0.20277 \tabularnewline
9 & 0.048358 & 0.4884 & 0.313162 \tabularnewline
10 & -0.137524 & -1.3889 & 0.08394 \tabularnewline
11 & 0.256829 & 2.5938 & 0.005443 \tabularnewline
12 & -0.225432 & -2.2768 & 0.012445 \tabularnewline
13 & 0.00034 & 0.0034 & 0.498633 \tabularnewline
14 & 0.111554 & 1.1266 & 0.131268 \tabularnewline
15 & -0.015313 & -0.1547 & 0.438701 \tabularnewline
16 & -0.12993 & -1.3122 & 0.096194 \tabularnewline
17 & 0.156866 & 1.5843 & 0.058114 \tabularnewline
18 & -0.067124 & -0.6779 & 0.249679 \tabularnewline
19 & -0.052595 & -0.5312 & 0.298223 \tabularnewline
20 & 0.143564 & 1.4499 & 0.075074 \tabularnewline
21 & -0.075639 & -0.7639 & 0.223339 \tabularnewline
22 & -0.124495 & -1.2573 & 0.105752 \tabularnewline
23 & 0.230018 & 2.3231 & 0.01108 \tabularnewline
24 & -0.13245 & -1.3377 & 0.091987 \tabularnewline
25 & -0.057125 & -0.5769 & 0.282629 \tabularnewline
26 & 0.182428 & 1.8424 & 0.034159 \tabularnewline
27 & -0.194334 & -1.9627 & 0.026204 \tabularnewline
28 & 0.112293 & 1.1341 & 0.129706 \tabularnewline
29 & -0.023956 & -0.2419 & 0.404657 \tabularnewline
30 & -0.020264 & -0.2047 & 0.419124 \tabularnewline
31 & -0.012264 & -0.1239 & 0.450834 \tabularnewline
32 & 0.070582 & 0.7128 & 0.238784 \tabularnewline
33 & -0.101329 & -1.0234 & 0.154276 \tabularnewline
34 & 0.104831 & 1.0587 & 0.14611 \tabularnewline
35 & -0.020057 & -0.2026 & 0.419939 \tabularnewline
36 & -0.134661 & -1.36 & 0.088412 \tabularnewline
37 & 0.187212 & 1.8907 & 0.030748 \tabularnewline
38 & -0.067335 & -0.68 & 0.249007 \tabularnewline
39 & -0.069854 & -0.7055 & 0.241058 \tabularnewline
40 & 0.072471 & 0.7319 & 0.232946 \tabularnewline
41 & 0.035272 & 0.3562 & 0.361201 \tabularnewline
42 & -0.130873 & -1.3217 & 0.094604 \tabularnewline
43 & 0.19562 & 1.9757 & 0.025447 \tabularnewline
44 & -0.161244 & -1.6285 & 0.053253 \tabularnewline
45 & 0.002936 & 0.0297 & 0.488201 \tabularnewline
46 & 0.112252 & 1.1337 & 0.129792 \tabularnewline
47 & -0.081745 & -0.8256 & 0.205483 \tabularnewline
48 & -0.029718 & -0.3001 & 0.382341 \tabularnewline
\hline
\end{tabular}
%Source: https://freestatistics.org/blog/index.php?pk=298528&T=1

[TABLE]
[ROW][C]Autocorrelation Function[/C][/ROW]
[ROW][C]Time lag k[/C][C]ACF(k)[/C][C]T-STAT[/C][C]P-value[/C][/ROW]
[ROW][C]1[/C][C]-0.579923[/C][C]-5.8569[/C][C]0[/C][/ROW]
[ROW][C]2[/C][C]-0.011531[/C][C]-0.1165[/C][C]0.453759[/C][/ROW]
[ROW][C]3[/C][C]0.244411[/C][C]2.4684[/C][C]0.007617[/C][/ROW]
[ROW][C]4[/C][C]-0.203607[/C][C]-2.0563[/C][C]0.021152[/C][/ROW]
[ROW][C]5[/C][C]0.045895[/C][C]0.4635[/C][C]0.321992[/C][/ROW]
[ROW][C]6[/C][C]0.109558[/C][C]1.1065[/C][C]0.13556[/C][/ROW]
[ROW][C]7[/C][C]-0.176097[/C][C]-1.7785[/C][C]0.039151[/C][/ROW]
[ROW][C]8[/C][C]0.0827[/C][C]0.8352[/C][C]0.20277[/C][/ROW]
[ROW][C]9[/C][C]0.048358[/C][C]0.4884[/C][C]0.313162[/C][/ROW]
[ROW][C]10[/C][C]-0.137524[/C][C]-1.3889[/C][C]0.08394[/C][/ROW]
[ROW][C]11[/C][C]0.256829[/C][C]2.5938[/C][C]0.005443[/C][/ROW]
[ROW][C]12[/C][C]-0.225432[/C][C]-2.2768[/C][C]0.012445[/C][/ROW]
[ROW][C]13[/C][C]0.00034[/C][C]0.0034[/C][C]0.498633[/C][/ROW]
[ROW][C]14[/C][C]0.111554[/C][C]1.1266[/C][C]0.131268[/C][/ROW]
[ROW][C]15[/C][C]-0.015313[/C][C]-0.1547[/C][C]0.438701[/C][/ROW]
[ROW][C]16[/C][C]-0.12993[/C][C]-1.3122[/C][C]0.096194[/C][/ROW]
[ROW][C]17[/C][C]0.156866[/C][C]1.5843[/C][C]0.058114[/C][/ROW]
[ROW][C]18[/C][C]-0.067124[/C][C]-0.6779[/C][C]0.249679[/C][/ROW]
[ROW][C]19[/C][C]-0.052595[/C][C]-0.5312[/C][C]0.298223[/C][/ROW]
[ROW][C]20[/C][C]0.143564[/C][C]1.4499[/C][C]0.075074[/C][/ROW]
[ROW][C]21[/C][C]-0.075639[/C][C]-0.7639[/C][C]0.223339[/C][/ROW]
[ROW][C]22[/C][C]-0.124495[/C][C]-1.2573[/C][C]0.105752[/C][/ROW]
[ROW][C]23[/C][C]0.230018[/C][C]2.3231[/C][C]0.01108[/C][/ROW]
[ROW][C]24[/C][C]-0.13245[/C][C]-1.3377[/C][C]0.091987[/C][/ROW]
[ROW][C]25[/C][C]-0.057125[/C][C]-0.5769[/C][C]0.282629[/C][/ROW]
[ROW][C]26[/C][C]0.182428[/C][C]1.8424[/C][C]0.034159[/C][/ROW]
[ROW][C]27[/C][C]-0.194334[/C][C]-1.9627[/C][C]0.026204[/C][/ROW]
[ROW][C]28[/C][C]0.112293[/C][C]1.1341[/C][C]0.129706[/C][/ROW]
[ROW][C]29[/C][C]-0.023956[/C][C]-0.2419[/C][C]0.404657[/C][/ROW]
[ROW][C]30[/C][C]-0.020264[/C][C]-0.2047[/C][C]0.419124[/C][/ROW]
[ROW][C]31[/C][C]-0.012264[/C][C]-0.1239[/C][C]0.450834[/C][/ROW]
[ROW][C]32[/C][C]0.070582[/C][C]0.7128[/C][C]0.238784[/C][/ROW]
[ROW][C]33[/C][C]-0.101329[/C][C]-1.0234[/C][C]0.154276[/C][/ROW]
[ROW][C]34[/C][C]0.104831[/C][C]1.0587[/C][C]0.14611[/C][/ROW]
[ROW][C]35[/C][C]-0.020057[/C][C]-0.2026[/C][C]0.419939[/C][/ROW]
[ROW][C]36[/C][C]-0.134661[/C][C]-1.36[/C][C]0.088412[/C][/ROW]
[ROW][C]37[/C][C]0.187212[/C][C]1.8907[/C][C]0.030748[/C][/ROW]
[ROW][C]38[/C][C]-0.067335[/C][C]-0.68[/C][C]0.249007[/C][/ROW]
[ROW][C]39[/C][C]-0.069854[/C][C]-0.7055[/C][C]0.241058[/C][/ROW]
[ROW][C]40[/C][C]0.072471[/C][C]0.7319[/C][C]0.232946[/C][/ROW]
[ROW][C]41[/C][C]0.035272[/C][C]0.3562[/C][C]0.361201[/C][/ROW]
[ROW][C]42[/C][C]-0.130873[/C][C]-1.3217[/C][C]0.094604[/C][/ROW]
[ROW][C]43[/C][C]0.19562[/C][C]1.9757[/C][C]0.025447[/C][/ROW]
[ROW][C]44[/C][C]-0.161244[/C][C]-1.6285[/C][C]0.053253[/C][/ROW]
[ROW][C]45[/C][C]0.002936[/C][C]0.0297[/C][C]0.488201[/C][/ROW]
[ROW][C]46[/C][C]0.112252[/C][C]1.1337[/C][C]0.129792[/C][/ROW]
[ROW][C]47[/C][C]-0.081745[/C][C]-0.8256[/C][C]0.205483[/C][/ROW]
[ROW][C]48[/C][C]-0.029718[/C][C]-0.3001[/C][C]0.382341[/C][/ROW]
[/TABLE]
Source: https://freestatistics.org/blog/index.php?pk=298528&T=1

Globally Unique Identifier (entire table): ba.freestatistics.org/blog/index.php?pk=298528&T=1

As an alternative you can also use a QR Code:  

The GUIDs for individual cells are displayed in the table below:

Autocorrelation Function
Time lag kACF(k)T-STATP-value
1-0.579923-5.85690
2-0.011531-0.11650.453759
30.2444112.46840.007617
4-0.203607-2.05630.021152
50.0458950.46350.321992
60.1095581.10650.13556
7-0.176097-1.77850.039151
80.08270.83520.20277
90.0483580.48840.313162
10-0.137524-1.38890.08394
110.2568292.59380.005443
12-0.225432-2.27680.012445
130.000340.00340.498633
140.1115541.12660.131268
15-0.015313-0.15470.438701
16-0.12993-1.31220.096194
170.1568661.58430.058114
18-0.067124-0.67790.249679
19-0.052595-0.53120.298223
200.1435641.44990.075074
21-0.075639-0.76390.223339
22-0.124495-1.25730.105752
230.2300182.32310.01108
24-0.13245-1.33770.091987
25-0.057125-0.57690.282629
260.1824281.84240.034159
27-0.194334-1.96270.026204
280.1122931.13410.129706
29-0.023956-0.24190.404657
30-0.020264-0.20470.419124
31-0.012264-0.12390.450834
320.0705820.71280.238784
33-0.101329-1.02340.154276
340.1048311.05870.14611
35-0.020057-0.20260.419939
36-0.134661-1.360.088412
370.1872121.89070.030748
38-0.067335-0.680.249007
39-0.069854-0.70550.241058
400.0724710.73190.232946
410.0352720.35620.361201
42-0.130873-1.32170.094604
430.195621.97570.025447
44-0.161244-1.62850.053253
450.0029360.02970.488201
460.1122521.13370.129792
47-0.081745-0.82560.205483
48-0.029718-0.30010.382341


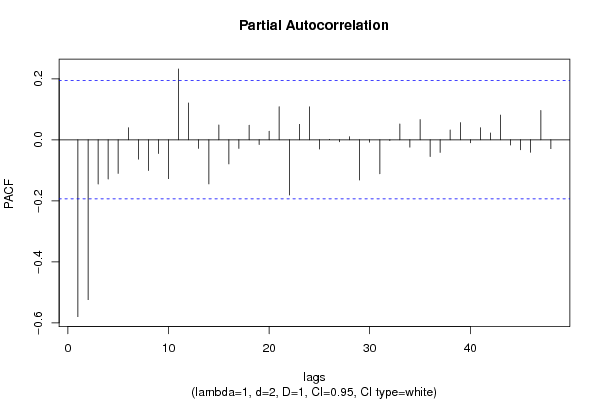
Partial Autocorrelation Function
Time lag kPACF(k)T-STATP-value
1-0.579923-5.85690
2-0.524103-5.29320
3-0.144834-1.46270.073305
4-0.128458-1.29740.098716
5-0.110113-1.11210.134358
60.0393620.39750.345901
7-0.063546-0.64180.261227
8-0.100712-1.01710.155746
9-0.044821-0.45270.325873
10-0.127399-1.28670.100562
110.232282.34590.010457
120.1205981.2180.113021
13-0.028063-0.28340.388713
14-0.144708-1.46150.07348
150.0487910.49280.311621
16-0.079132-0.79920.213019
17-0.028154-0.28430.388361
180.0474330.4790.316466
19-0.015272-0.15420.438863
200.0281910.28470.388221
210.1085921.09670.137673
22-0.181151-1.82950.035121
230.0505990.5110.30522
240.1079811.09060.13902
25-0.030162-0.30460.380636
260.0006690.00680.49731
27-0.006311-0.06370.474651
280.0100090.10110.459839
29-0.131654-1.32960.093301
30-0.00761-0.07690.469442
31-0.111214-1.12320.131993
32-0.002565-0.02590.489691
330.0517680.52280.301112
34-0.024044-0.24280.404312
350.0662080.66870.25261
36-0.054653-0.5520.291088
37-0.041391-0.4180.338404
380.0322380.32560.372702
390.056360.56920.285233
40-0.009824-0.09920.46058
410.0397430.40140.344489
420.0222210.22440.411437
430.0809650.81770.207715
44-0.016879-0.17050.432488
45-0.032951-0.33280.36999
46-0.040646-0.41050.341147
470.0960160.96970.16724
48-0.028951-0.29240.385292

\begin{tabular}{lllllllll}
\hline
Partial Autocorrelation Function \tabularnewline
Time lag k & PACF(k) & T-STAT & P-value \tabularnewline
1 & -0.579923 & -5.8569 & 0 \tabularnewline
2 & -0.524103 & -5.2932 & 0 \tabularnewline
3 & -0.144834 & -1.4627 & 0.073305 \tabularnewline
4 & -0.128458 & -1.2974 & 0.098716 \tabularnewline
5 & -0.110113 & -1.1121 & 0.134358 \tabularnewline
6 & 0.039362 & 0.3975 & 0.345901 \tabularnewline
7 & -0.063546 & -0.6418 & 0.261227 \tabularnewline
8 & -0.100712 & -1.0171 & 0.155746 \tabularnewline
9 & -0.044821 & -0.4527 & 0.325873 \tabularnewline
10 & -0.127399 & -1.2867 & 0.100562 \tabularnewline
11 & 0.23228 & 2.3459 & 0.010457 \tabularnewline
12 & 0.120598 & 1.218 & 0.113021 \tabularnewline
13 & -0.028063 & -0.2834 & 0.388713 \tabularnewline
14 & -0.144708 & -1.4615 & 0.07348 \tabularnewline
15 & 0.048791 & 0.4928 & 0.311621 \tabularnewline
16 & -0.079132 & -0.7992 & 0.213019 \tabularnewline
17 & -0.028154 & -0.2843 & 0.388361 \tabularnewline
18 & 0.047433 & 0.479 & 0.316466 \tabularnewline
19 & -0.015272 & -0.1542 & 0.438863 \tabularnewline
20 & 0.028191 & 0.2847 & 0.388221 \tabularnewline
21 & 0.108592 & 1.0967 & 0.137673 \tabularnewline
22 & -0.181151 & -1.8295 & 0.035121 \tabularnewline
23 & 0.050599 & 0.511 & 0.30522 \tabularnewline
24 & 0.107981 & 1.0906 & 0.13902 \tabularnewline
25 & -0.030162 & -0.3046 & 0.380636 \tabularnewline
26 & 0.000669 & 0.0068 & 0.49731 \tabularnewline
27 & -0.006311 & -0.0637 & 0.474651 \tabularnewline
28 & 0.010009 & 0.1011 & 0.459839 \tabularnewline
29 & -0.131654 & -1.3296 & 0.093301 \tabularnewline
30 & -0.00761 & -0.0769 & 0.469442 \tabularnewline
31 & -0.111214 & -1.1232 & 0.131993 \tabularnewline
32 & -0.002565 & -0.0259 & 0.489691 \tabularnewline
33 & 0.051768 & 0.5228 & 0.301112 \tabularnewline
34 & -0.024044 & -0.2428 & 0.404312 \tabularnewline
35 & 0.066208 & 0.6687 & 0.25261 \tabularnewline
36 & -0.054653 & -0.552 & 0.291088 \tabularnewline
37 & -0.041391 & -0.418 & 0.338404 \tabularnewline
38 & 0.032238 & 0.3256 & 0.372702 \tabularnewline
39 & 0.05636 & 0.5692 & 0.285233 \tabularnewline
40 & -0.009824 & -0.0992 & 0.46058 \tabularnewline
41 & 0.039743 & 0.4014 & 0.344489 \tabularnewline
42 & 0.022221 & 0.2244 & 0.411437 \tabularnewline
43 & 0.080965 & 0.8177 & 0.207715 \tabularnewline
44 & -0.016879 & -0.1705 & 0.432488 \tabularnewline
45 & -0.032951 & -0.3328 & 0.36999 \tabularnewline
46 & -0.040646 & -0.4105 & 0.341147 \tabularnewline
47 & 0.096016 & 0.9697 & 0.16724 \tabularnewline
48 & -0.028951 & -0.2924 & 0.385292 \tabularnewline
\hline
\end{tabular}
%Source: https://freestatistics.org/blog/index.php?pk=298528&T=2

[TABLE]
[ROW][C]Partial Autocorrelation Function[/C][/ROW]
[ROW][C]Time lag k[/C][C]PACF(k)[/C][C]T-STAT[/C][C]P-value[/C][/ROW]
[ROW][C]1[/C][C]-0.579923[/C][C]-5.8569[/C][C]0[/C][/ROW]
[ROW][C]2[/C][C]-0.524103[/C][C]-5.2932[/C][C]0[/C][/ROW]
[ROW][C]3[/C][C]-0.144834[/C][C]-1.4627[/C][C]0.073305[/C][/ROW]
[ROW][C]4[/C][C]-0.128458[/C][C]-1.2974[/C][C]0.098716[/C][/ROW]
[ROW][C]5[/C][C]-0.110113[/C][C]-1.1121[/C][C]0.134358[/C][/ROW]
[ROW][C]6[/C][C]0.039362[/C][C]0.3975[/C][C]0.345901[/C][/ROW]
[ROW][C]7[/C][C]-0.063546[/C][C]-0.6418[/C][C]0.261227[/C][/ROW]
[ROW][C]8[/C][C]-0.100712[/C][C]-1.0171[/C][C]0.155746[/C][/ROW]
[ROW][C]9[/C][C]-0.044821[/C][C]-0.4527[/C][C]0.325873[/C][/ROW]
[ROW][C]10[/C][C]-0.127399[/C][C]-1.2867[/C][C]0.100562[/C][/ROW]
[ROW][C]11[/C][C]0.23228[/C][C]2.3459[/C][C]0.010457[/C][/ROW]
[ROW][C]12[/C][C]0.120598[/C][C]1.218[/C][C]0.113021[/C][/ROW]
[ROW][C]13[/C][C]-0.028063[/C][C]-0.2834[/C][C]0.388713[/C][/ROW]
[ROW][C]14[/C][C]-0.144708[/C][C]-1.4615[/C][C]0.07348[/C][/ROW]
[ROW][C]15[/C][C]0.048791[/C][C]0.4928[/C][C]0.311621[/C][/ROW]
[ROW][C]16[/C][C]-0.079132[/C][C]-0.7992[/C][C]0.213019[/C][/ROW]
[ROW][C]17[/C][C]-0.028154[/C][C]-0.2843[/C][C]0.388361[/C][/ROW]
[ROW][C]18[/C][C]0.047433[/C][C]0.479[/C][C]0.316466[/C][/ROW]
[ROW][C]19[/C][C]-0.015272[/C][C]-0.1542[/C][C]0.438863[/C][/ROW]
[ROW][C]20[/C][C]0.028191[/C][C]0.2847[/C][C]0.388221[/C][/ROW]
[ROW][C]21[/C][C]0.108592[/C][C]1.0967[/C][C]0.137673[/C][/ROW]
[ROW][C]22[/C][C]-0.181151[/C][C]-1.8295[/C][C]0.035121[/C][/ROW]
[ROW][C]23[/C][C]0.050599[/C][C]0.511[/C][C]0.30522[/C][/ROW]
[ROW][C]24[/C][C]0.107981[/C][C]1.0906[/C][C]0.13902[/C][/ROW]
[ROW][C]25[/C][C]-0.030162[/C][C]-0.3046[/C][C]0.380636[/C][/ROW]
[ROW][C]26[/C][C]0.000669[/C][C]0.0068[/C][C]0.49731[/C][/ROW]
[ROW][C]27[/C][C]-0.006311[/C][C]-0.0637[/C][C]0.474651[/C][/ROW]
[ROW][C]28[/C][C]0.010009[/C][C]0.1011[/C][C]0.459839[/C][/ROW]
[ROW][C]29[/C][C]-0.131654[/C][C]-1.3296[/C][C]0.093301[/C][/ROW]
[ROW][C]30[/C][C]-0.00761[/C][C]-0.0769[/C][C]0.469442[/C][/ROW]
[ROW][C]31[/C][C]-0.111214[/C][C]-1.1232[/C][C]0.131993[/C][/ROW]
[ROW][C]32[/C][C]-0.002565[/C][C]-0.0259[/C][C]0.489691[/C][/ROW]
[ROW][C]33[/C][C]0.051768[/C][C]0.5228[/C][C]0.301112[/C][/ROW]
[ROW][C]34[/C][C]-0.024044[/C][C]-0.2428[/C][C]0.404312[/C][/ROW]
[ROW][C]35[/C][C]0.066208[/C][C]0.6687[/C][C]0.25261[/C][/ROW]
[ROW][C]36[/C][C]-0.054653[/C][C]-0.552[/C][C]0.291088[/C][/ROW]
[ROW][C]37[/C][C]-0.041391[/C][C]-0.418[/C][C]0.338404[/C][/ROW]
[ROW][C]38[/C][C]0.032238[/C][C]0.3256[/C][C]0.372702[/C][/ROW]
[ROW][C]39[/C][C]0.05636[/C][C]0.5692[/C][C]0.285233[/C][/ROW]
[ROW][C]40[/C][C]-0.009824[/C][C]-0.0992[/C][C]0.46058[/C][/ROW]
[ROW][C]41[/C][C]0.039743[/C][C]0.4014[/C][C]0.344489[/C][/ROW]
[ROW][C]42[/C][C]0.022221[/C][C]0.2244[/C][C]0.411437[/C][/ROW]
[ROW][C]43[/C][C]0.080965[/C][C]0.8177[/C][C]0.207715[/C][/ROW]
[ROW][C]44[/C][C]-0.016879[/C][C]-0.1705[/C][C]0.432488[/C][/ROW]
[ROW][C]45[/C][C]-0.032951[/C][C]-0.3328[/C][C]0.36999[/C][/ROW]
[ROW][C]46[/C][C]-0.040646[/C][C]-0.4105[/C][C]0.341147[/C][/ROW]
[ROW][C]47[/C][C]0.096016[/C][C]0.9697[/C][C]0.16724[/C][/ROW]
[ROW][C]48[/C][C]-0.028951[/C][C]-0.2924[/C][C]0.385292[/C][/ROW]
[/TABLE]
Source: https://freestatistics.org/blog/index.php?pk=298528&T=2

Globally Unique Identifier (entire table): ba.freestatistics.org/blog/index.php?pk=298528&T=2

As an alternative you can also use a QR Code:  

The GUIDs for individual cells are displayed in the table below:

Partial Autocorrelation Function
Time lag kPACF(k)T-STATP-value
1-0.579923-5.85690
2-0.524103-5.29320
3-0.144834-1.46270.073305
4-0.128458-1.29740.098716
5-0.110113-1.11210.134358
60.0393620.39750.345901
7-0.063546-0.64180.261227
8-0.100712-1.01710.155746
9-0.044821-0.45270.325873
10-0.127399-1.28670.100562
110.232282.34590.010457
120.1205981.2180.113021
13-0.028063-0.28340.388713
14-0.144708-1.46150.07348
150.0487910.49280.311621
16-0.079132-0.79920.213019
17-0.028154-0.28430.388361
180.0474330.4790.316466
19-0.015272-0.15420.438863
200.0281910.28470.388221
210.1085921.09670.137673
22-0.181151-1.82950.035121
230.0505990.5110.30522
240.1079811.09060.13902
25-0.030162-0.30460.380636
260.0006690.00680.49731
27-0.006311-0.06370.474651
280.0100090.10110.459839
29-0.131654-1.32960.093301
30-0.00761-0.07690.469442
31-0.111214-1.12320.131993
32-0.002565-0.02590.489691
330.0517680.52280.301112
34-0.024044-0.24280.404312
350.0662080.66870.25261
36-0.054653-0.5520.291088
37-0.041391-0.4180.338404
380.0322380.32560.372702
390.056360.56920.285233
40-0.009824-0.09920.46058
410.0397430.40140.344489
420.0222210.22440.411437
430.0809650.81770.207715
44-0.016879-0.17050.432488
45-0.032951-0.33280.36999
46-0.040646-0.41050.341147
470.0960160.96970.16724
48-0.028951-0.29240.385292


Parameters (Session):
par1 = 48 ; par2 = 1 ; par3 = 1 ; par4 = 1 ; par5 = 12 ; par6 = White Noise ; par7 = 0.95 ;
Parameters (R input):
par1 = 48 ; par2 = 1 ; par3 = 2 ; par4 = 1 ; par5 = 12 ; par6 = White Noise ; par7 = 0.95 ; par8 = ;
R code (references can be found in the software module):
par8 <- ''
par7 <- '0.95'
par6 <- 'White Noise'
par5 <- '12'
par4 <- '1'
par3 <- '2'
par2 <- '1'
par1 <- 'Default'
if (par1 == 'Default') {
par1 = 10*log10(length(x))
} else {
par1 <- as.numeric(par1)
}
par2 <- as.numeric(par2)
par3 <- as.numeric(par3)
par4 <- as.numeric(par4)
par5 <- as.numeric(par5)
if (par6 == 'White Noise') par6 <- 'white' else par6 <- 'ma'
par7 <- as.numeric(par7)
if (par8 != '') par8 <- as.numeric(par8)
x <- na.omit(x)
ox <- x
if (par8 == '') {
if (par2 == 0) {
x <- log(x)
} else {
x <- (x ^ par2 - 1) / par2
}
} else {
x <- log(x,base=par8)
}
if (par3 > 0) x <- diff(x,lag=1,difference=par3)
if (par4 > 0) x <- diff(x,lag=par5,difference=par4)
bitmap(file='picts.png')
op <- par(mfrow=c(2,1))
plot(ox,type='l',main='Original Time Series',xlab='time',ylab='value')
if (par8=='') {
mytitle <- paste('Working Time Series (lambda=',par2,', d=',par3,', D=',par4,')',sep='')
mysub <- paste('(lambda=',par2,', d=',par3,', D=',par4,', CI=', par7, ', CI type=',par6,')',sep='')
} else {
mytitle <- paste('Working Time Series (base=',par8,', d=',par3,', D=',par4,')',sep='')
mysub <- paste('(base=',par8,', d=',par3,', D=',par4,', CI=', par7, ', CI type=',par6,')',sep='')
}
plot(x,type='l', main=mytitle,xlab='time',ylab='value')
par(op)
dev.off()
bitmap(file='pic1.png')
racf <- acf(x, par1, main='Autocorrelation', xlab='time lag', ylab='ACF', ci.type=par6, ci=par7, sub=mysub)
dev.off()
bitmap(file='pic2.png')
rpacf <- pacf(x,par1,main='Partial Autocorrelation',xlab='lags',ylab='PACF',sub=mysub)
dev.off()
(myacf <- c(racf$acf))
(mypacf <- c(rpacf$acf))
lengthx <- length(x)
sqrtn <- sqrt(lengthx)
load(file='createtable')
a<-table.start()
a<-table.row.start(a)
a<-table.element(a,'Autocorrelation Function',4,TRUE)
a<-table.row.end(a)
a<-table.row.start(a)
a<-table.element(a,'Time lag k',header=TRUE)
a<-table.element(a,'ACF(k)',header=TRUE)
a<-table.element(a,'T-STAT',header=TRUE)
a<-table.element(a,'P-value',header=TRUE)
a<-table.row.end(a)
for (i in 2:(par1+1)) {
a<-table.row.start(a)
a<-table.element(a,i-1,header=TRUE)
a<-table.element(a,round(myacf[i],6))
mytstat <- myacf[i]*sqrtn
a<-table.element(a,round(mytstat,4))
a<-table.element(a,round(1-pt(abs(mytstat),lengthx),6))
a<-table.row.end(a)
}
a<-table.end(a)
table.save(a,file='mytable.tab')
a<-table.start()
a<-table.row.start(a)
a<-table.element(a,'Partial Autocorrelation Function',4,TRUE)
a<-table.row.end(a)
a<-table.row.start(a)
a<-table.element(a,'Time lag k',header=TRUE)
a<-table.element(a,'PACF(k)',header=TRUE)
a<-table.element(a,'T-STAT',header=TRUE)
a<-table.element(a,'P-value',header=TRUE)
a<-table.row.end(a)
for (i in 1:par1) {
a<-table.row.start(a)
a<-table.element(a,i,header=TRUE)
a<-table.element(a,round(mypacf[i],6))
mytstat <- mypacf[i]*sqrtn
a<-table.element(a,round(mytstat,4))
a<-table.element(a,round(1-pt(abs(mytstat),lengthx),6))
a<-table.row.end(a)
}
a<-table.end(a)
table.save(a,file='mytable1.tab')