Free Statistics

of Irreproducible Research!

Author's title

Author*The author of this computation has been verified*
R Software Modulerwasp_autocorrelation.wasp
Title produced by software(Partial) Autocorrelation Function
Date of computationFri, 09 Dec 2016 13:52:26 +0100
Cite this page as followsStatistical Computations at FreeStatistics.org, Office for Research Development and Education, URL https://freestatistics.org/blog/index.php?v=date/2016/Dec/09/t148128797315avwy5gc5pf5o7.htm/, Retrieved Fri, 01 Nov 2024 03:45:34 +0000
Statistical Computations at FreeStatistics.org, Office for Research Development and Education, URL https://freestatistics.org/blog/index.php?pk=298506, Retrieved Fri, 01 Nov 2024 03:45:34 +0000
QR Codes:

Original text written by user:
IsPrivate?No (this computation is public)
User-defined keywordsF1 competition
Estimated Impact92
Family? (F = Feedback message, R = changed R code, M = changed R Module, P = changed Parameters, D = changed Data)
-       [(Partial) Autocorrelation Function] [Partial Autocorre...] [2016-12-09 12:52:26] [00d6a26c230b6c589ee3bbc701d55499] [Current]
Feedback Forum

Post a new message
Dataseries X:
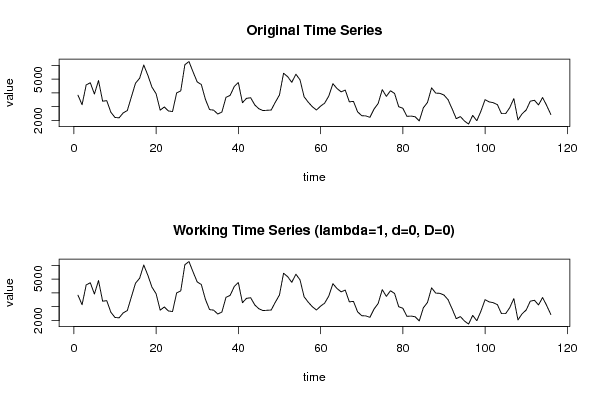
3840
3140
4580
4740
3920
4900
3400
3440
2600
2220
2190
2550
2720
3720
4710
5070
6030
5280
4420
3940
2750
2980
2690
2650
4000
4150
6050
6280
5520
4800
4610
3530
2790
2750
2470
2610
3680
3820
4460
4760
3290
3610
3650
3130
2850
2720
2740
2760
3330
3850
5430
5180
4770
5360
4950
3720
3330
3000
2760
3040
3260
3780
4670
4320
4080
4210
3350
3390
2630
2350
2330
2230
2830
3230
4240
3750
4160
3960
3000
2890
2300
2320
2270
1970
2920
3310
4370
3990
3970
3850
3510
2840
2130
2280
1960
1740
2370
1980
2680
3510
3350
3290
3150
2490
2490
2930
3590
2040
2480
2760
3400
3470
3130
3670
3080
2430


Summary of computational transaction
Raw Input view raw input (R code)
Raw Outputview raw output of R engine
Computing time1 seconds
R ServerBig Analytics Cloud Computing Center

\begin{tabular}{lllllllll}
\hline
Summary of computational transaction \tabularnewline
Raw Input view raw input (R code)  \tabularnewline
Raw Outputview raw output of R engine  \tabularnewline
Computing time1 seconds \tabularnewline
R ServerBig Analytics Cloud Computing Center \tabularnewline
\hline
\end{tabular}
%Source: https://freestatistics.org/blog/index.php?pk=298506&T=0

[TABLE]
[ROW]
Summary of computational transaction[/C][/ROW] [ROW]Raw Input[/C] view raw input (R code) [/C][/ROW] [ROW]Raw Output[/C]view raw output of R engine [/C][/ROW] [ROW]Computing time[/C]1 seconds[/C][/ROW] [ROW]R Server[/C]Big Analytics Cloud Computing Center[/C][/ROW] [/TABLE] Source: https://freestatistics.org/blog/index.php?pk=298506&T=0

Globally Unique Identifier (entire table): ba.freestatistics.org/blog/index.php?pk=298506&T=0

As an alternative you can also use a QR Code:  

The GUIDs for individual cells are displayed in the table below:

Summary of computational transaction
Raw Input view raw input (R code)
Raw Outputview raw output of R engine
Computing time1 seconds
R ServerBig Analytics Cloud Computing Center


Autocorrelation Function
Time lag kACF(k)T-STATP-value
10.7772418.37110
20.5333995.74490
30.2306432.48410.007208
4-0.120584-1.29870.098306
5-0.326529-3.51680.000312
6-0.433644-4.67054e-06
7-0.363186-3.91167.7e-05
8-0.160075-1.72410.04368
90.1116671.20270.115773
100.3843664.13973.3e-05
110.6027916.49230
120.6772037.29370
130.5392255.80760
140.3454223.72030.000154
150.0709030.76360.223314
16-0.196-2.1110.018461
17-0.354486-3.81790.000109
18-0.445614-4.79942e-06
19-0.357951-3.85529.5e-05
20-0.172184-1.85450.033105
210.046090.49640.310273
220.2857113.07720.001304
230.4718135.08161e-06
240.5457995.87840
250.4605514.96031e-06
260.3109283.34880.000548
270.0960461.03450.151538
28-0.114439-1.23250.110119
29-0.271043-2.91920.002108
30-0.346924-3.73650.000146
31-0.279606-3.01140.001596
32-0.142108-1.53050.064302
330.0224060.24130.404866
340.2264442.43890.008124
350.3493843.7630.000132
360.4121884.43941e-05
370.3507363.77750.000126
380.1930692.07940.019891
390.0116960.1260.449986
40-0.18571-2.00020.02391
41-0.345649-3.72280.000153
42-0.422236-4.54767e-06
43-0.366441-3.94676.8e-05
44-0.275403-2.96620.001831
45-0.114612-1.23440.109772
460.0649320.69930.242872
470.1840161.98190.024927
480.2641532.8450.002626

\begin{tabular}{lllllllll}
\hline
Autocorrelation Function \tabularnewline
Time lag k & ACF(k) & T-STAT & P-value \tabularnewline
1 & 0.777241 & 8.3711 & 0 \tabularnewline
2 & 0.533399 & 5.7449 & 0 \tabularnewline
3 & 0.230643 & 2.4841 & 0.007208 \tabularnewline
4 & -0.120584 & -1.2987 & 0.098306 \tabularnewline
5 & -0.326529 & -3.5168 & 0.000312 \tabularnewline
6 & -0.433644 & -4.6705 & 4e-06 \tabularnewline
7 & -0.363186 & -3.9116 & 7.7e-05 \tabularnewline
8 & -0.160075 & -1.7241 & 0.04368 \tabularnewline
9 & 0.111667 & 1.2027 & 0.115773 \tabularnewline
10 & 0.384366 & 4.1397 & 3.3e-05 \tabularnewline
11 & 0.602791 & 6.4923 & 0 \tabularnewline
12 & 0.677203 & 7.2937 & 0 \tabularnewline
13 & 0.539225 & 5.8076 & 0 \tabularnewline
14 & 0.345422 & 3.7203 & 0.000154 \tabularnewline
15 & 0.070903 & 0.7636 & 0.223314 \tabularnewline
16 & -0.196 & -2.111 & 0.018461 \tabularnewline
17 & -0.354486 & -3.8179 & 0.000109 \tabularnewline
18 & -0.445614 & -4.7994 & 2e-06 \tabularnewline
19 & -0.357951 & -3.8552 & 9.5e-05 \tabularnewline
20 & -0.172184 & -1.8545 & 0.033105 \tabularnewline
21 & 0.04609 & 0.4964 & 0.310273 \tabularnewline
22 & 0.285711 & 3.0772 & 0.001304 \tabularnewline
23 & 0.471813 & 5.0816 & 1e-06 \tabularnewline
24 & 0.545799 & 5.8784 & 0 \tabularnewline
25 & 0.460551 & 4.9603 & 1e-06 \tabularnewline
26 & 0.310928 & 3.3488 & 0.000548 \tabularnewline
27 & 0.096046 & 1.0345 & 0.151538 \tabularnewline
28 & -0.114439 & -1.2325 & 0.110119 \tabularnewline
29 & -0.271043 & -2.9192 & 0.002108 \tabularnewline
30 & -0.346924 & -3.7365 & 0.000146 \tabularnewline
31 & -0.279606 & -3.0114 & 0.001596 \tabularnewline
32 & -0.142108 & -1.5305 & 0.064302 \tabularnewline
33 & 0.022406 & 0.2413 & 0.404866 \tabularnewline
34 & 0.226444 & 2.4389 & 0.008124 \tabularnewline
35 & 0.349384 & 3.763 & 0.000132 \tabularnewline
36 & 0.412188 & 4.4394 & 1e-05 \tabularnewline
37 & 0.350736 & 3.7775 & 0.000126 \tabularnewline
38 & 0.193069 & 2.0794 & 0.019891 \tabularnewline
39 & 0.011696 & 0.126 & 0.449986 \tabularnewline
40 & -0.18571 & -2.0002 & 0.02391 \tabularnewline
41 & -0.345649 & -3.7228 & 0.000153 \tabularnewline
42 & -0.422236 & -4.5476 & 7e-06 \tabularnewline
43 & -0.366441 & -3.9467 & 6.8e-05 \tabularnewline
44 & -0.275403 & -2.9662 & 0.001831 \tabularnewline
45 & -0.114612 & -1.2344 & 0.109772 \tabularnewline
46 & 0.064932 & 0.6993 & 0.242872 \tabularnewline
47 & 0.184016 & 1.9819 & 0.024927 \tabularnewline
48 & 0.264153 & 2.845 & 0.002626 \tabularnewline
\hline
\end{tabular}
%Source: https://freestatistics.org/blog/index.php?pk=298506&T=1

[TABLE]
[ROW][C]Autocorrelation Function[/C][/ROW]
[ROW][C]Time lag k[/C][C]ACF(k)[/C][C]T-STAT[/C][C]P-value[/C][/ROW]
[ROW][C]1[/C][C]0.777241[/C][C]8.3711[/C][C]0[/C][/ROW]
[ROW][C]2[/C][C]0.533399[/C][C]5.7449[/C][C]0[/C][/ROW]
[ROW][C]3[/C][C]0.230643[/C][C]2.4841[/C][C]0.007208[/C][/ROW]
[ROW][C]4[/C][C]-0.120584[/C][C]-1.2987[/C][C]0.098306[/C][/ROW]
[ROW][C]5[/C][C]-0.326529[/C][C]-3.5168[/C][C]0.000312[/C][/ROW]
[ROW][C]6[/C][C]-0.433644[/C][C]-4.6705[/C][C]4e-06[/C][/ROW]
[ROW][C]7[/C][C]-0.363186[/C][C]-3.9116[/C][C]7.7e-05[/C][/ROW]
[ROW][C]8[/C][C]-0.160075[/C][C]-1.7241[/C][C]0.04368[/C][/ROW]
[ROW][C]9[/C][C]0.111667[/C][C]1.2027[/C][C]0.115773[/C][/ROW]
[ROW][C]10[/C][C]0.384366[/C][C]4.1397[/C][C]3.3e-05[/C][/ROW]
[ROW][C]11[/C][C]0.602791[/C][C]6.4923[/C][C]0[/C][/ROW]
[ROW][C]12[/C][C]0.677203[/C][C]7.2937[/C][C]0[/C][/ROW]
[ROW][C]13[/C][C]0.539225[/C][C]5.8076[/C][C]0[/C][/ROW]
[ROW][C]14[/C][C]0.345422[/C][C]3.7203[/C][C]0.000154[/C][/ROW]
[ROW][C]15[/C][C]0.070903[/C][C]0.7636[/C][C]0.223314[/C][/ROW]
[ROW][C]16[/C][C]-0.196[/C][C]-2.111[/C][C]0.018461[/C][/ROW]
[ROW][C]17[/C][C]-0.354486[/C][C]-3.8179[/C][C]0.000109[/C][/ROW]
[ROW][C]18[/C][C]-0.445614[/C][C]-4.7994[/C][C]2e-06[/C][/ROW]
[ROW][C]19[/C][C]-0.357951[/C][C]-3.8552[/C][C]9.5e-05[/C][/ROW]
[ROW][C]20[/C][C]-0.172184[/C][C]-1.8545[/C][C]0.033105[/C][/ROW]
[ROW][C]21[/C][C]0.04609[/C][C]0.4964[/C][C]0.310273[/C][/ROW]
[ROW][C]22[/C][C]0.285711[/C][C]3.0772[/C][C]0.001304[/C][/ROW]
[ROW][C]23[/C][C]0.471813[/C][C]5.0816[/C][C]1e-06[/C][/ROW]
[ROW][C]24[/C][C]0.545799[/C][C]5.8784[/C][C]0[/C][/ROW]
[ROW][C]25[/C][C]0.460551[/C][C]4.9603[/C][C]1e-06[/C][/ROW]
[ROW][C]26[/C][C]0.310928[/C][C]3.3488[/C][C]0.000548[/C][/ROW]
[ROW][C]27[/C][C]0.096046[/C][C]1.0345[/C][C]0.151538[/C][/ROW]
[ROW][C]28[/C][C]-0.114439[/C][C]-1.2325[/C][C]0.110119[/C][/ROW]
[ROW][C]29[/C][C]-0.271043[/C][C]-2.9192[/C][C]0.002108[/C][/ROW]
[ROW][C]30[/C][C]-0.346924[/C][C]-3.7365[/C][C]0.000146[/C][/ROW]
[ROW][C]31[/C][C]-0.279606[/C][C]-3.0114[/C][C]0.001596[/C][/ROW]
[ROW][C]32[/C][C]-0.142108[/C][C]-1.5305[/C][C]0.064302[/C][/ROW]
[ROW][C]33[/C][C]0.022406[/C][C]0.2413[/C][C]0.404866[/C][/ROW]
[ROW][C]34[/C][C]0.226444[/C][C]2.4389[/C][C]0.008124[/C][/ROW]
[ROW][C]35[/C][C]0.349384[/C][C]3.763[/C][C]0.000132[/C][/ROW]
[ROW][C]36[/C][C]0.412188[/C][C]4.4394[/C][C]1e-05[/C][/ROW]
[ROW][C]37[/C][C]0.350736[/C][C]3.7775[/C][C]0.000126[/C][/ROW]
[ROW][C]38[/C][C]0.193069[/C][C]2.0794[/C][C]0.019891[/C][/ROW]
[ROW][C]39[/C][C]0.011696[/C][C]0.126[/C][C]0.449986[/C][/ROW]
[ROW][C]40[/C][C]-0.18571[/C][C]-2.0002[/C][C]0.02391[/C][/ROW]
[ROW][C]41[/C][C]-0.345649[/C][C]-3.7228[/C][C]0.000153[/C][/ROW]
[ROW][C]42[/C][C]-0.422236[/C][C]-4.5476[/C][C]7e-06[/C][/ROW]
[ROW][C]43[/C][C]-0.366441[/C][C]-3.9467[/C][C]6.8e-05[/C][/ROW]
[ROW][C]44[/C][C]-0.275403[/C][C]-2.9662[/C][C]0.001831[/C][/ROW]
[ROW][C]45[/C][C]-0.114612[/C][C]-1.2344[/C][C]0.109772[/C][/ROW]
[ROW][C]46[/C][C]0.064932[/C][C]0.6993[/C][C]0.242872[/C][/ROW]
[ROW][C]47[/C][C]0.184016[/C][C]1.9819[/C][C]0.024927[/C][/ROW]
[ROW][C]48[/C][C]0.264153[/C][C]2.845[/C][C]0.002626[/C][/ROW]
[/TABLE]
Source: https://freestatistics.org/blog/index.php?pk=298506&T=1

Globally Unique Identifier (entire table): ba.freestatistics.org/blog/index.php?pk=298506&T=1

As an alternative you can also use a QR Code:  

The GUIDs for individual cells are displayed in the table below:

Autocorrelation Function
Time lag kACF(k)T-STATP-value
10.7772418.37110
20.5333995.74490
30.2306432.48410.007208
4-0.120584-1.29870.098306
5-0.326529-3.51680.000312
6-0.433644-4.67054e-06
7-0.363186-3.91167.7e-05
8-0.160075-1.72410.04368
90.1116671.20270.115773
100.3843664.13973.3e-05
110.6027916.49230
120.6772037.29370
130.5392255.80760
140.3454223.72030.000154
150.0709030.76360.223314
16-0.196-2.1110.018461
17-0.354486-3.81790.000109
18-0.445614-4.79942e-06
19-0.357951-3.85529.5e-05
20-0.172184-1.85450.033105
210.046090.49640.310273
220.2857113.07720.001304
230.4718135.08161e-06
240.5457995.87840
250.4605514.96031e-06
260.3109283.34880.000548
270.0960461.03450.151538
28-0.114439-1.23250.110119
29-0.271043-2.91920.002108
30-0.346924-3.73650.000146
31-0.279606-3.01140.001596
32-0.142108-1.53050.064302
330.0224060.24130.404866
340.2264442.43890.008124
350.3493843.7630.000132
360.4121884.43941e-05
370.3507363.77750.000126
380.1930692.07940.019891
390.0116960.1260.449986
40-0.18571-2.00020.02391
41-0.345649-3.72280.000153
42-0.422236-4.54767e-06
43-0.366441-3.94676.8e-05
44-0.275403-2.96620.001831
45-0.114612-1.23440.109772
460.0649320.69930.242872
470.1840161.98190.024927
480.2641532.8450.002626


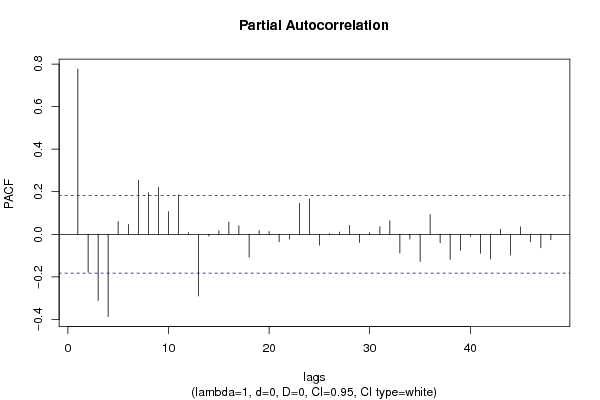
Partial Autocorrelation Function
Time lag kPACF(k)T-STATP-value
10.7772418.37110
2-0.178591-1.92350.028435
3-0.310925-3.34880.000548
4-0.387207-4.17032.9e-05
50.0604880.65150.258016
60.0463950.49970.30912
70.2536972.73240.003636
80.1948912.0990.018991
90.2207662.37770.009527
100.1056531.13790.128749
110.1853651.99640.024114
120.0084770.09130.463704
13-0.2901-3.12450.001125
14-0.007922-0.08530.466076
150.0169820.18290.427597
160.0577370.62180.267632
170.0401480.43240.333125
18-0.107425-1.1570.124825
190.018110.19510.422847
200.0131340.14150.443875
21-0.035105-0.37810.353025
22-0.021487-0.23140.408698
230.1452091.5640.060276
240.166141.78940.038081
25-0.050874-0.54790.292398
260.0030890.03330.486756
270.010290.11080.455975
280.0412620.44440.328787
29-0.038839-0.41830.338247
300.0073720.07940.468426
310.0351480.37860.352855
320.0635920.68490.247384
33-0.087592-0.94340.173719
34-0.022469-0.2420.404605
35-0.12771-1.37550.085816
360.0930261.00190.159233
37-0.039949-0.43030.333901
38-0.118122-1.27220.102922
39-0.075773-0.81610.208057
40-0.010435-0.11240.455356
41-0.088919-0.95770.170107
42-0.115616-1.24520.10778
430.0235830.2540.399974
44-0.097811-1.05350.14716
450.0349790.37670.35353
46-0.035767-0.38520.350388
47-0.063205-0.68070.248698
48-0.025369-0.27320.39258

\begin{tabular}{lllllllll}
\hline
Partial Autocorrelation Function \tabularnewline
Time lag k & PACF(k) & T-STAT & P-value \tabularnewline
1 & 0.777241 & 8.3711 & 0 \tabularnewline
2 & -0.178591 & -1.9235 & 0.028435 \tabularnewline
3 & -0.310925 & -3.3488 & 0.000548 \tabularnewline
4 & -0.387207 & -4.1703 & 2.9e-05 \tabularnewline
5 & 0.060488 & 0.6515 & 0.258016 \tabularnewline
6 & 0.046395 & 0.4997 & 0.30912 \tabularnewline
7 & 0.253697 & 2.7324 & 0.003636 \tabularnewline
8 & 0.194891 & 2.099 & 0.018991 \tabularnewline
9 & 0.220766 & 2.3777 & 0.009527 \tabularnewline
10 & 0.105653 & 1.1379 & 0.128749 \tabularnewline
11 & 0.185365 & 1.9964 & 0.024114 \tabularnewline
12 & 0.008477 & 0.0913 & 0.463704 \tabularnewline
13 & -0.2901 & -3.1245 & 0.001125 \tabularnewline
14 & -0.007922 & -0.0853 & 0.466076 \tabularnewline
15 & 0.016982 & 0.1829 & 0.427597 \tabularnewline
16 & 0.057737 & 0.6218 & 0.267632 \tabularnewline
17 & 0.040148 & 0.4324 & 0.333125 \tabularnewline
18 & -0.107425 & -1.157 & 0.124825 \tabularnewline
19 & 0.01811 & 0.1951 & 0.422847 \tabularnewline
20 & 0.013134 & 0.1415 & 0.443875 \tabularnewline
21 & -0.035105 & -0.3781 & 0.353025 \tabularnewline
22 & -0.021487 & -0.2314 & 0.408698 \tabularnewline
23 & 0.145209 & 1.564 & 0.060276 \tabularnewline
24 & 0.16614 & 1.7894 & 0.038081 \tabularnewline
25 & -0.050874 & -0.5479 & 0.292398 \tabularnewline
26 & 0.003089 & 0.0333 & 0.486756 \tabularnewline
27 & 0.01029 & 0.1108 & 0.455975 \tabularnewline
28 & 0.041262 & 0.4444 & 0.328787 \tabularnewline
29 & -0.038839 & -0.4183 & 0.338247 \tabularnewline
30 & 0.007372 & 0.0794 & 0.468426 \tabularnewline
31 & 0.035148 & 0.3786 & 0.352855 \tabularnewline
32 & 0.063592 & 0.6849 & 0.247384 \tabularnewline
33 & -0.087592 & -0.9434 & 0.173719 \tabularnewline
34 & -0.022469 & -0.242 & 0.404605 \tabularnewline
35 & -0.12771 & -1.3755 & 0.085816 \tabularnewline
36 & 0.093026 & 1.0019 & 0.159233 \tabularnewline
37 & -0.039949 & -0.4303 & 0.333901 \tabularnewline
38 & -0.118122 & -1.2722 & 0.102922 \tabularnewline
39 & -0.075773 & -0.8161 & 0.208057 \tabularnewline
40 & -0.010435 & -0.1124 & 0.455356 \tabularnewline
41 & -0.088919 & -0.9577 & 0.170107 \tabularnewline
42 & -0.115616 & -1.2452 & 0.10778 \tabularnewline
43 & 0.023583 & 0.254 & 0.399974 \tabularnewline
44 & -0.097811 & -1.0535 & 0.14716 \tabularnewline
45 & 0.034979 & 0.3767 & 0.35353 \tabularnewline
46 & -0.035767 & -0.3852 & 0.350388 \tabularnewline
47 & -0.063205 & -0.6807 & 0.248698 \tabularnewline
48 & -0.025369 & -0.2732 & 0.39258 \tabularnewline
\hline
\end{tabular}
%Source: https://freestatistics.org/blog/index.php?pk=298506&T=2

[TABLE]
[ROW][C]Partial Autocorrelation Function[/C][/ROW]
[ROW][C]Time lag k[/C][C]PACF(k)[/C][C]T-STAT[/C][C]P-value[/C][/ROW]
[ROW][C]1[/C][C]0.777241[/C][C]8.3711[/C][C]0[/C][/ROW]
[ROW][C]2[/C][C]-0.178591[/C][C]-1.9235[/C][C]0.028435[/C][/ROW]
[ROW][C]3[/C][C]-0.310925[/C][C]-3.3488[/C][C]0.000548[/C][/ROW]
[ROW][C]4[/C][C]-0.387207[/C][C]-4.1703[/C][C]2.9e-05[/C][/ROW]
[ROW][C]5[/C][C]0.060488[/C][C]0.6515[/C][C]0.258016[/C][/ROW]
[ROW][C]6[/C][C]0.046395[/C][C]0.4997[/C][C]0.30912[/C][/ROW]
[ROW][C]7[/C][C]0.253697[/C][C]2.7324[/C][C]0.003636[/C][/ROW]
[ROW][C]8[/C][C]0.194891[/C][C]2.099[/C][C]0.018991[/C][/ROW]
[ROW][C]9[/C][C]0.220766[/C][C]2.3777[/C][C]0.009527[/C][/ROW]
[ROW][C]10[/C][C]0.105653[/C][C]1.1379[/C][C]0.128749[/C][/ROW]
[ROW][C]11[/C][C]0.185365[/C][C]1.9964[/C][C]0.024114[/C][/ROW]
[ROW][C]12[/C][C]0.008477[/C][C]0.0913[/C][C]0.463704[/C][/ROW]
[ROW][C]13[/C][C]-0.2901[/C][C]-3.1245[/C][C]0.001125[/C][/ROW]
[ROW][C]14[/C][C]-0.007922[/C][C]-0.0853[/C][C]0.466076[/C][/ROW]
[ROW][C]15[/C][C]0.016982[/C][C]0.1829[/C][C]0.427597[/C][/ROW]
[ROW][C]16[/C][C]0.057737[/C][C]0.6218[/C][C]0.267632[/C][/ROW]
[ROW][C]17[/C][C]0.040148[/C][C]0.4324[/C][C]0.333125[/C][/ROW]
[ROW][C]18[/C][C]-0.107425[/C][C]-1.157[/C][C]0.124825[/C][/ROW]
[ROW][C]19[/C][C]0.01811[/C][C]0.1951[/C][C]0.422847[/C][/ROW]
[ROW][C]20[/C][C]0.013134[/C][C]0.1415[/C][C]0.443875[/C][/ROW]
[ROW][C]21[/C][C]-0.035105[/C][C]-0.3781[/C][C]0.353025[/C][/ROW]
[ROW][C]22[/C][C]-0.021487[/C][C]-0.2314[/C][C]0.408698[/C][/ROW]
[ROW][C]23[/C][C]0.145209[/C][C]1.564[/C][C]0.060276[/C][/ROW]
[ROW][C]24[/C][C]0.16614[/C][C]1.7894[/C][C]0.038081[/C][/ROW]
[ROW][C]25[/C][C]-0.050874[/C][C]-0.5479[/C][C]0.292398[/C][/ROW]
[ROW][C]26[/C][C]0.003089[/C][C]0.0333[/C][C]0.486756[/C][/ROW]
[ROW][C]27[/C][C]0.01029[/C][C]0.1108[/C][C]0.455975[/C][/ROW]
[ROW][C]28[/C][C]0.041262[/C][C]0.4444[/C][C]0.328787[/C][/ROW]
[ROW][C]29[/C][C]-0.038839[/C][C]-0.4183[/C][C]0.338247[/C][/ROW]
[ROW][C]30[/C][C]0.007372[/C][C]0.0794[/C][C]0.468426[/C][/ROW]
[ROW][C]31[/C][C]0.035148[/C][C]0.3786[/C][C]0.352855[/C][/ROW]
[ROW][C]32[/C][C]0.063592[/C][C]0.6849[/C][C]0.247384[/C][/ROW]
[ROW][C]33[/C][C]-0.087592[/C][C]-0.9434[/C][C]0.173719[/C][/ROW]
[ROW][C]34[/C][C]-0.022469[/C][C]-0.242[/C][C]0.404605[/C][/ROW]
[ROW][C]35[/C][C]-0.12771[/C][C]-1.3755[/C][C]0.085816[/C][/ROW]
[ROW][C]36[/C][C]0.093026[/C][C]1.0019[/C][C]0.159233[/C][/ROW]
[ROW][C]37[/C][C]-0.039949[/C][C]-0.4303[/C][C]0.333901[/C][/ROW]
[ROW][C]38[/C][C]-0.118122[/C][C]-1.2722[/C][C]0.102922[/C][/ROW]
[ROW][C]39[/C][C]-0.075773[/C][C]-0.8161[/C][C]0.208057[/C][/ROW]
[ROW][C]40[/C][C]-0.010435[/C][C]-0.1124[/C][C]0.455356[/C][/ROW]
[ROW][C]41[/C][C]-0.088919[/C][C]-0.9577[/C][C]0.170107[/C][/ROW]
[ROW][C]42[/C][C]-0.115616[/C][C]-1.2452[/C][C]0.10778[/C][/ROW]
[ROW][C]43[/C][C]0.023583[/C][C]0.254[/C][C]0.399974[/C][/ROW]
[ROW][C]44[/C][C]-0.097811[/C][C]-1.0535[/C][C]0.14716[/C][/ROW]
[ROW][C]45[/C][C]0.034979[/C][C]0.3767[/C][C]0.35353[/C][/ROW]
[ROW][C]46[/C][C]-0.035767[/C][C]-0.3852[/C][C]0.350388[/C][/ROW]
[ROW][C]47[/C][C]-0.063205[/C][C]-0.6807[/C][C]0.248698[/C][/ROW]
[ROW][C]48[/C][C]-0.025369[/C][C]-0.2732[/C][C]0.39258[/C][/ROW]
[/TABLE]
Source: https://freestatistics.org/blog/index.php?pk=298506&T=2

Globally Unique Identifier (entire table): ba.freestatistics.org/blog/index.php?pk=298506&T=2

As an alternative you can also use a QR Code:  

The GUIDs for individual cells are displayed in the table below:

Partial Autocorrelation Function
Time lag kPACF(k)T-STATP-value
10.7772418.37110
2-0.178591-1.92350.028435
3-0.310925-3.34880.000548
4-0.387207-4.17032.9e-05
50.0604880.65150.258016
60.0463950.49970.30912
70.2536972.73240.003636
80.1948912.0990.018991
90.2207662.37770.009527
100.1056531.13790.128749
110.1853651.99640.024114
120.0084770.09130.463704
13-0.2901-3.12450.001125
14-0.007922-0.08530.466076
150.0169820.18290.427597
160.0577370.62180.267632
170.0401480.43240.333125
18-0.107425-1.1570.124825
190.018110.19510.422847
200.0131340.14150.443875
21-0.035105-0.37810.353025
22-0.021487-0.23140.408698
230.1452091.5640.060276
240.166141.78940.038081
25-0.050874-0.54790.292398
260.0030890.03330.486756
270.010290.11080.455975
280.0412620.44440.328787
29-0.038839-0.41830.338247
300.0073720.07940.468426
310.0351480.37860.352855
320.0635920.68490.247384
33-0.087592-0.94340.173719
34-0.022469-0.2420.404605
35-0.12771-1.37550.085816
360.0930261.00190.159233
37-0.039949-0.43030.333901
38-0.118122-1.27220.102922
39-0.075773-0.81610.208057
40-0.010435-0.11240.455356
41-0.088919-0.95770.170107
42-0.115616-1.24520.10778
430.0235830.2540.399974
44-0.097811-1.05350.14716
450.0349790.37670.35353
46-0.035767-0.38520.350388
47-0.063205-0.68070.248698
48-0.025369-0.27320.39258


Parameters (Session):
par1 = 48 ; par2 = 1 ; par3 = 0 ; par4 = 0 ; par5 = 12 ; par6 = White Noise ; par7 = 0.95 ;
Parameters (R input):
par1 = 48 ; par2 = 1 ; par3 = 0 ; par4 = 0 ; par5 = 12 ; par6 = White Noise ; par7 = 0.95 ; par8 = ;
R code (references can be found in the software module):
par8 <- ''
par7 <- '0.95'
par6 <- 'White Noise'
par5 <- '12'
par4 <- '0'
par3 <- '1'
par2 <- '1'
par1 <- '48'
if (par1 == 'Default') {
par1 = 10*log10(length(x))
} else {
par1 <- as.numeric(par1)
}
par2 <- as.numeric(par2)
par3 <- as.numeric(par3)
par4 <- as.numeric(par4)
par5 <- as.numeric(par5)
if (par6 == 'White Noise') par6 <- 'white' else par6 <- 'ma'
par7 <- as.numeric(par7)
if (par8 != '') par8 <- as.numeric(par8)
x <- na.omit(x)
ox <- x
if (par8 == '') {
if (par2 == 0) {
x <- log(x)
} else {
x <- (x ^ par2 - 1) / par2
}
} else {
x <- log(x,base=par8)
}
if (par3 > 0) x <- diff(x,lag=1,difference=par3)
if (par4 > 0) x <- diff(x,lag=par5,difference=par4)
bitmap(file='picts.png')
op <- par(mfrow=c(2,1))
plot(ox,type='l',main='Original Time Series',xlab='time',ylab='value')
if (par8=='') {
mytitle <- paste('Working Time Series (lambda=',par2,', d=',par3,', D=',par4,')',sep='')
mysub <- paste('(lambda=',par2,', d=',par3,', D=',par4,', CI=', par7, ', CI type=',par6,')',sep='')
} else {
mytitle <- paste('Working Time Series (base=',par8,', d=',par3,', D=',par4,')',sep='')
mysub <- paste('(base=',par8,', d=',par3,', D=',par4,', CI=', par7, ', CI type=',par6,')',sep='')
}
plot(x,type='l', main=mytitle,xlab='time',ylab='value')
par(op)
dev.off()
bitmap(file='pic1.png')
racf <- acf(x, par1, main='Autocorrelation', xlab='time lag', ylab='ACF', ci.type=par6, ci=par7, sub=mysub)
dev.off()
bitmap(file='pic2.png')
rpacf <- pacf(x,par1,main='Partial Autocorrelation',xlab='lags',ylab='PACF',sub=mysub)
dev.off()
(myacf <- c(racf$acf))
(mypacf <- c(rpacf$acf))
lengthx <- length(x)
sqrtn <- sqrt(lengthx)
load(file='createtable')
a<-table.start()
a<-table.row.start(a)
a<-table.element(a,'Autocorrelation Function',4,TRUE)
a<-table.row.end(a)
a<-table.row.start(a)
a<-table.element(a,'Time lag k',header=TRUE)
a<-table.element(a,'ACF(k)',header=TRUE)
a<-table.element(a,'T-STAT',header=TRUE)
a<-table.element(a,'P-value',header=TRUE)
a<-table.row.end(a)
for (i in 2:(par1+1)) {
a<-table.row.start(a)
a<-table.element(a,i-1,header=TRUE)
a<-table.element(a,round(myacf[i],6))
mytstat <- myacf[i]*sqrtn
a<-table.element(a,round(mytstat,4))
a<-table.element(a,round(1-pt(abs(mytstat),lengthx),6))
a<-table.row.end(a)
}
a<-table.end(a)
table.save(a,file='mytable.tab')
a<-table.start()
a<-table.row.start(a)
a<-table.element(a,'Partial Autocorrelation Function',4,TRUE)
a<-table.row.end(a)
a<-table.row.start(a)
a<-table.element(a,'Time lag k',header=TRUE)
a<-table.element(a,'PACF(k)',header=TRUE)
a<-table.element(a,'T-STAT',header=TRUE)
a<-table.element(a,'P-value',header=TRUE)
a<-table.row.end(a)
for (i in 1:par1) {
a<-table.row.start(a)
a<-table.element(a,i,header=TRUE)
a<-table.element(a,round(mypacf[i],6))
mytstat <- mypacf[i]*sqrtn
a<-table.element(a,round(mytstat,4))
a<-table.element(a,round(1-pt(abs(mytstat),lengthx),6))
a<-table.row.end(a)
}
a<-table.end(a)
table.save(a,file='mytable1.tab')