Free Statistics

of Irreproducible Research!

Author's title

Author*The author of this computation has been verified*
R Software Modulerwasp_arimaforecasting.wasp
Title produced by softwareARIMA Forecasting
Date of computationFri, 09 Dec 2016 10:14:53 +0100
Cite this page as followsStatistical Computations at FreeStatistics.org, Office for Research Development and Education, URL https://freestatistics.org/blog/index.php?v=date/2016/Dec/09/t14812750004mp0hwhoi133tbe.htm/, Retrieved Fri, 01 Nov 2024 03:27:13 +0000
Statistical Computations at FreeStatistics.org, Office for Research Development and Education, URL https://freestatistics.org/blog/index.php?pk=298462, Retrieved Fri, 01 Nov 2024 03:27:13 +0000
QR Codes:

Original text written by user:
IsPrivate?No (this computation is public)
User-defined keywords
Estimated Impact113
Family? (F = Feedback message, R = changed R code, M = changed R Module, P = changed Parameters, D = changed Data)
-       [ARIMA Forecasting] [Voorbeeld Les ARI...] [2016-12-09 09:14:53] [bde5266f17215258f6d7c4cd7e531432] [Current]
Feedback Forum

Post a new message
Dataseries X:
2404
2324.5
2266
2415
2462
2737
2766
2873.5
2811.5
2875
2660.5
2534
2467.5
2591
2611
2614.5
2638
2635
2366.5
2429.5
2595
2795.5
2952.5
2860
3188.5
3313.5
3363
3351.5
3314.5
3425.5
3114
3410.5
3576
3692
3882.5
3857
4009
4059.5
3993
4010
4140.5
4105.5
3589
3730.5
3852.5
4123
4288.5
4068
4438.5
4710.5
4794.5
4935
4854
4829.5
4569.5
4478.5
4083.5
4287
4409.5
4078.5
4572.5
4832
4992.5
5001.5
5051
4879.5
4418.5
4372
4492
4836.5
4952
4839.5
5120
5174
5113.5
5102
4964.5
4938
4258
4273
4192
4725
4991.5
4996.5
5468.5
5852.5
5985.5
6044.5
6126
6261.5
5572
5539
5394
5513
5734
5674.5
5177
5352
5553
5519.5
5792
5966
5408
5365
5476.5
5854
5832
5371.5
5355.5
5112.5
4775.5
4767.5
4800.5
4825.5
4262.5
4287
4379
5021.5
5272
4927.5
5129
5526
5833
5833.5
5847.5
5700.5


Summary of computational transaction
Raw Input view raw input (R code)
Raw Outputview raw output of R engine
Computing time1 seconds
R ServerBig Analytics Cloud Computing Center

\begin{tabular}{lllllllll}
\hline
Summary of computational transaction \tabularnewline
Raw Input view raw input (R code)  \tabularnewline
Raw Outputview raw output of R engine  \tabularnewline
Computing time1 seconds \tabularnewline
R ServerBig Analytics Cloud Computing Center \tabularnewline
\hline
\end{tabular}
%Source: https://freestatistics.org/blog/index.php?pk=298462&T=0

[TABLE]
[ROW]
Summary of computational transaction[/C][/ROW] [ROW]Raw Input[/C] view raw input (R code) [/C][/ROW] [ROW]Raw Output[/C]view raw output of R engine [/C][/ROW] [ROW]Computing time[/C]1 seconds[/C][/ROW] [ROW]R Server[/C]Big Analytics Cloud Computing Center[/C][/ROW] [/TABLE] Source: https://freestatistics.org/blog/index.php?pk=298462&T=0

Globally Unique Identifier (entire table): ba.freestatistics.org/blog/index.php?pk=298462&T=0

As an alternative you can also use a QR Code:  

The GUIDs for individual cells are displayed in the table below:

Summary of computational transaction
Raw Input view raw input (R code)
Raw Outputview raw output of R engine
Computing time1 seconds
R ServerBig Analytics Cloud Computing Center


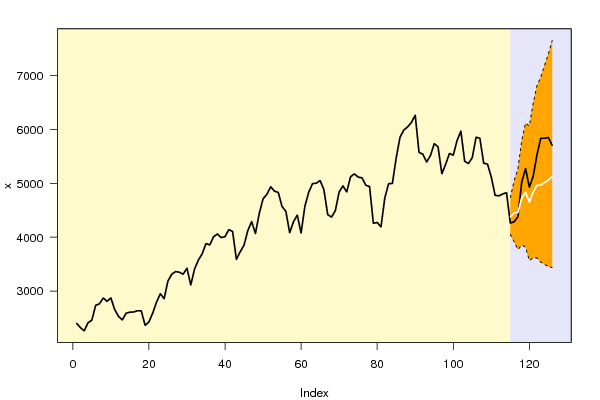
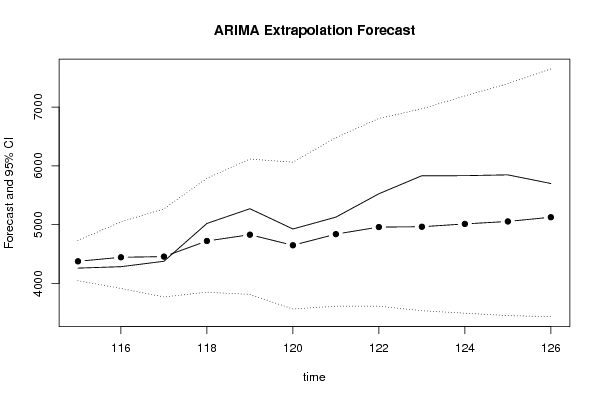
Univariate ARIMA Extrapolation Forecast
timeY[t]F[t]95% LB95% UBp-value(H0: Y[t] = F[t])P(F[t]>Y[t-1])P(F[t]>Y[t-s])P(F[t]>Y[114])
1025966-------
1035408-------
1045365-------
1055476.5-------
1065854-------
1075832-------
1085371.5-------
1095355.5-------
1105112.5-------
1114775.5-------
1124767.5-------
1134800.5-------
1144825.5-------
1154262.54378.16784048.99084734.10640.26210.006900.0069
11642874446.71163916.8055048.30950.30140.72580.00140.1086
11743794458.15693771.89985269.27130.42420.66040.00690.1874
1185021.54723.51593853.95795789.26990.29180.73680.01880.4256
11952724830.41523815.37816115.49110.25030.38540.06330.503
1204927.54650.76843567.65256062.71110.35040.19420.15850.4042
12151294840.14053615.1656480.19110.3650.45840.2690.507
12255264960.52663615.69136805.56540.2740.4290.43590.557
12358334965.53163537.90176969.24520.19810.29180.57370.5545
1245833.55013.573496.60687188.65030.230.23010.58770.5673
1255847.55055.63153455.45647396.82610.25370.25750.58460.5764
1265700.55127.32313437.86487647.02610.32790.28770.59280.5928

\begin{tabular}{lllllllll}
\hline
Univariate ARIMA Extrapolation Forecast \tabularnewline
time & Y[t] & F[t] & 95% LB & 95% UB & p-value(H0: Y[t] = F[t]) & P(F[t]>Y[t-1]) & P(F[t]>Y[t-s]) & P(F[t]>Y[114]) \tabularnewline
102 & 5966 & - & - & - & - & - & - & - \tabularnewline
103 & 5408 & - & - & - & - & - & - & - \tabularnewline
104 & 5365 & - & - & - & - & - & - & - \tabularnewline
105 & 5476.5 & - & - & - & - & - & - & - \tabularnewline
106 & 5854 & - & - & - & - & - & - & - \tabularnewline
107 & 5832 & - & - & - & - & - & - & - \tabularnewline
108 & 5371.5 & - & - & - & - & - & - & - \tabularnewline
109 & 5355.5 & - & - & - & - & - & - & - \tabularnewline
110 & 5112.5 & - & - & - & - & - & - & - \tabularnewline
111 & 4775.5 & - & - & - & - & - & - & - \tabularnewline
112 & 4767.5 & - & - & - & - & - & - & - \tabularnewline
113 & 4800.5 & - & - & - & - & - & - & - \tabularnewline
114 & 4825.5 & - & - & - & - & - & - & - \tabularnewline
115 & 4262.5 & 4378.1678 & 4048.9908 & 4734.1064 & 0.2621 & 0.0069 & 0 & 0.0069 \tabularnewline
116 & 4287 & 4446.7116 & 3916.805 & 5048.3095 & 0.3014 & 0.7258 & 0.0014 & 0.1086 \tabularnewline
117 & 4379 & 4458.1569 & 3771.8998 & 5269.2713 & 0.4242 & 0.6604 & 0.0069 & 0.1874 \tabularnewline
118 & 5021.5 & 4723.5159 & 3853.9579 & 5789.2699 & 0.2918 & 0.7368 & 0.0188 & 0.4256 \tabularnewline
119 & 5272 & 4830.4152 & 3815.3781 & 6115.4911 & 0.2503 & 0.3854 & 0.0633 & 0.503 \tabularnewline
120 & 4927.5 & 4650.7684 & 3567.6525 & 6062.7111 & 0.3504 & 0.1942 & 0.1585 & 0.4042 \tabularnewline
121 & 5129 & 4840.1405 & 3615.165 & 6480.1911 & 0.365 & 0.4584 & 0.269 & 0.507 \tabularnewline
122 & 5526 & 4960.5266 & 3615.6913 & 6805.5654 & 0.274 & 0.429 & 0.4359 & 0.557 \tabularnewline
123 & 5833 & 4965.5316 & 3537.9017 & 6969.2452 & 0.1981 & 0.2918 & 0.5737 & 0.5545 \tabularnewline
124 & 5833.5 & 5013.57 & 3496.6068 & 7188.6503 & 0.23 & 0.2301 & 0.5877 & 0.5673 \tabularnewline
125 & 5847.5 & 5055.6315 & 3455.4564 & 7396.8261 & 0.2537 & 0.2575 & 0.5846 & 0.5764 \tabularnewline
126 & 5700.5 & 5127.3231 & 3437.8648 & 7647.0261 & 0.3279 & 0.2877 & 0.5928 & 0.5928 \tabularnewline
\hline
\end{tabular}
%Source: https://freestatistics.org/blog/index.php?pk=298462&T=1

[TABLE]
[ROW][C]Univariate ARIMA Extrapolation Forecast[/C][/ROW]
[ROW][C]time[/C][C]Y[t][/C][C]F[t][/C][C]95% LB[/C][C]95% UB[/C][C]p-value(H0: Y[t] = F[t])[/C][C]P(F[t]>Y[t-1])[/C][C]P(F[t]>Y[t-s])[/C][C]P(F[t]>Y[114])[/C][/ROW]
[ROW][C]102[/C][C]5966[/C][C]-[/C][C]-[/C][C]-[/C][C]-[/C][C]-[/C][C]-[/C][C]-[/C][/ROW]
[ROW][C]103[/C][C]5408[/C][C]-[/C][C]-[/C][C]-[/C][C]-[/C][C]-[/C][C]-[/C][C]-[/C][/ROW]
[ROW][C]104[/C][C]5365[/C][C]-[/C][C]-[/C][C]-[/C][C]-[/C][C]-[/C][C]-[/C][C]-[/C][/ROW]
[ROW][C]105[/C][C]5476.5[/C][C]-[/C][C]-[/C][C]-[/C][C]-[/C][C]-[/C][C]-[/C][C]-[/C][/ROW]
[ROW][C]106[/C][C]5854[/C][C]-[/C][C]-[/C][C]-[/C][C]-[/C][C]-[/C][C]-[/C][C]-[/C][/ROW]
[ROW][C]107[/C][C]5832[/C][C]-[/C][C]-[/C][C]-[/C][C]-[/C][C]-[/C][C]-[/C][C]-[/C][/ROW]
[ROW][C]108[/C][C]5371.5[/C][C]-[/C][C]-[/C][C]-[/C][C]-[/C][C]-[/C][C]-[/C][C]-[/C][/ROW]
[ROW][C]109[/C][C]5355.5[/C][C]-[/C][C]-[/C][C]-[/C][C]-[/C][C]-[/C][C]-[/C][C]-[/C][/ROW]
[ROW][C]110[/C][C]5112.5[/C][C]-[/C][C]-[/C][C]-[/C][C]-[/C][C]-[/C][C]-[/C][C]-[/C][/ROW]
[ROW][C]111[/C][C]4775.5[/C][C]-[/C][C]-[/C][C]-[/C][C]-[/C][C]-[/C][C]-[/C][C]-[/C][/ROW]
[ROW][C]112[/C][C]4767.5[/C][C]-[/C][C]-[/C][C]-[/C][C]-[/C][C]-[/C][C]-[/C][C]-[/C][/ROW]
[ROW][C]113[/C][C]4800.5[/C][C]-[/C][C]-[/C][C]-[/C][C]-[/C][C]-[/C][C]-[/C][C]-[/C][/ROW]
[ROW][C]114[/C][C]4825.5[/C][C]-[/C][C]-[/C][C]-[/C][C]-[/C][C]-[/C][C]-[/C][C]-[/C][/ROW]
[ROW][C]115[/C][C]4262.5[/C][C]4378.1678[/C][C]4048.9908[/C][C]4734.1064[/C][C]0.2621[/C][C]0.0069[/C][C]0[/C][C]0.0069[/C][/ROW]
[ROW][C]116[/C][C]4287[/C][C]4446.7116[/C][C]3916.805[/C][C]5048.3095[/C][C]0.3014[/C][C]0.7258[/C][C]0.0014[/C][C]0.1086[/C][/ROW]
[ROW][C]117[/C][C]4379[/C][C]4458.1569[/C][C]3771.8998[/C][C]5269.2713[/C][C]0.4242[/C][C]0.6604[/C][C]0.0069[/C][C]0.1874[/C][/ROW]
[ROW][C]118[/C][C]5021.5[/C][C]4723.5159[/C][C]3853.9579[/C][C]5789.2699[/C][C]0.2918[/C][C]0.7368[/C][C]0.0188[/C][C]0.4256[/C][/ROW]
[ROW][C]119[/C][C]5272[/C][C]4830.4152[/C][C]3815.3781[/C][C]6115.4911[/C][C]0.2503[/C][C]0.3854[/C][C]0.0633[/C][C]0.503[/C][/ROW]
[ROW][C]120[/C][C]4927.5[/C][C]4650.7684[/C][C]3567.6525[/C][C]6062.7111[/C][C]0.3504[/C][C]0.1942[/C][C]0.1585[/C][C]0.4042[/C][/ROW]
[ROW][C]121[/C][C]5129[/C][C]4840.1405[/C][C]3615.165[/C][C]6480.1911[/C][C]0.365[/C][C]0.4584[/C][C]0.269[/C][C]0.507[/C][/ROW]
[ROW][C]122[/C][C]5526[/C][C]4960.5266[/C][C]3615.6913[/C][C]6805.5654[/C][C]0.274[/C][C]0.429[/C][C]0.4359[/C][C]0.557[/C][/ROW]
[ROW][C]123[/C][C]5833[/C][C]4965.5316[/C][C]3537.9017[/C][C]6969.2452[/C][C]0.1981[/C][C]0.2918[/C][C]0.5737[/C][C]0.5545[/C][/ROW]
[ROW][C]124[/C][C]5833.5[/C][C]5013.57[/C][C]3496.6068[/C][C]7188.6503[/C][C]0.23[/C][C]0.2301[/C][C]0.5877[/C][C]0.5673[/C][/ROW]
[ROW][C]125[/C][C]5847.5[/C][C]5055.6315[/C][C]3455.4564[/C][C]7396.8261[/C][C]0.2537[/C][C]0.2575[/C][C]0.5846[/C][C]0.5764[/C][/ROW]
[ROW][C]126[/C][C]5700.5[/C][C]5127.3231[/C][C]3437.8648[/C][C]7647.0261[/C][C]0.3279[/C][C]0.2877[/C][C]0.5928[/C][C]0.5928[/C][/ROW]
[/TABLE]
Source: https://freestatistics.org/blog/index.php?pk=298462&T=1

Globally Unique Identifier (entire table): ba.freestatistics.org/blog/index.php?pk=298462&T=1

As an alternative you can also use a QR Code:  

The GUIDs for individual cells are displayed in the table below:

Univariate ARIMA Extrapolation Forecast
timeY[t]F[t]95% LB95% UBp-value(H0: Y[t] = F[t])P(F[t]>Y[t-1])P(F[t]>Y[t-s])P(F[t]>Y[114])
1025966-------
1035408-------
1045365-------
1055476.5-------
1065854-------
1075832-------
1085371.5-------
1095355.5-------
1105112.5-------
1114775.5-------
1124767.5-------
1134800.5-------
1144825.5-------
1154262.54378.16784048.99084734.10640.26210.006900.0069
11642874446.71163916.8055048.30950.30140.72580.00140.1086
11743794458.15693771.89985269.27130.42420.66040.00690.1874
1185021.54723.51593853.95795789.26990.29180.73680.01880.4256
11952724830.41523815.37816115.49110.25030.38540.06330.503
1204927.54650.76843567.65256062.71110.35040.19420.15850.4042
12151294840.14053615.1656480.19110.3650.45840.2690.507
12255264960.52663615.69136805.56540.2740.4290.43590.557
12358334965.53163537.90176969.24520.19810.29180.57370.5545
1245833.55013.573496.60687188.65030.230.23010.58770.5673
1255847.55055.63153455.45647396.82610.25370.25750.58460.5764
1265700.55127.32313437.86487647.02610.32790.28770.59280.5928


Univariate ARIMA Extrapolation Forecast Performance
time% S.E.PEMAPEsMAPESq.EMSERMSEScaledEMASE
1150.0415-0.02710.02710.026813379.040900-0.52550.5255
1160.069-0.03730.03220.031725507.78519443.413139.4396-0.72570.6256
1170.0928-0.01810.02750.02716265.816515050.8808122.682-0.35970.537
1180.11510.05930.03550.035688794.551233486.7984182.9941.35390.7412
1190.13570.08380.04510.046194997.139565788.8666256.49342.00640.9942
1200.15490.05620.0470.047976580.383967587.4528259.97591.25741.0381
1210.17290.05630.04830.049483439.814469852.0759264.29541.31251.0773
1220.18980.10230.0550.0567319760.1728101090.588317.94752.56931.2638
1230.20590.14870.06550.0682752501.3821173469.5651416.49683.94141.5613
1240.22130.14060.0730.0765672285.2615223351.1348472.60043.72541.7777
1250.23630.13540.07860.0828627055.6733260051.5474509.95253.59791.9432
1260.25070.10050.08050.0847328531.801265758.2352515.51742.60431.9983

\begin{tabular}{lllllllll}
\hline
Univariate ARIMA Extrapolation Forecast Performance \tabularnewline
time & % S.E. & PE & MAPE & sMAPE & Sq.E & MSE & RMSE & ScaledE & MASE \tabularnewline
115 & 0.0415 & -0.0271 & 0.0271 & 0.0268 & 13379.0409 & 0 & 0 & -0.5255 & 0.5255 \tabularnewline
116 & 0.069 & -0.0373 & 0.0322 & 0.0317 & 25507.785 & 19443.413 & 139.4396 & -0.7257 & 0.6256 \tabularnewline
117 & 0.0928 & -0.0181 & 0.0275 & 0.0271 & 6265.8165 & 15050.8808 & 122.682 & -0.3597 & 0.537 \tabularnewline
118 & 0.1151 & 0.0593 & 0.0355 & 0.0356 & 88794.5512 & 33486.7984 & 182.994 & 1.3539 & 0.7412 \tabularnewline
119 & 0.1357 & 0.0838 & 0.0451 & 0.046 & 194997.1395 & 65788.8666 & 256.4934 & 2.0064 & 0.9942 \tabularnewline
120 & 0.1549 & 0.0562 & 0.047 & 0.0479 & 76580.3839 & 67587.4528 & 259.9759 & 1.2574 & 1.0381 \tabularnewline
121 & 0.1729 & 0.0563 & 0.0483 & 0.0494 & 83439.8144 & 69852.0759 & 264.2954 & 1.3125 & 1.0773 \tabularnewline
122 & 0.1898 & 0.1023 & 0.055 & 0.0567 & 319760.1728 & 101090.588 & 317.9475 & 2.5693 & 1.2638 \tabularnewline
123 & 0.2059 & 0.1487 & 0.0655 & 0.0682 & 752501.3821 & 173469.5651 & 416.4968 & 3.9414 & 1.5613 \tabularnewline
124 & 0.2213 & 0.1406 & 0.073 & 0.0765 & 672285.2615 & 223351.1348 & 472.6004 & 3.7254 & 1.7777 \tabularnewline
125 & 0.2363 & 0.1354 & 0.0786 & 0.0828 & 627055.6733 & 260051.5474 & 509.9525 & 3.5979 & 1.9432 \tabularnewline
126 & 0.2507 & 0.1005 & 0.0805 & 0.0847 & 328531.801 & 265758.2352 & 515.5174 & 2.6043 & 1.9983 \tabularnewline
\hline
\end{tabular}
%Source: https://freestatistics.org/blog/index.php?pk=298462&T=2

[TABLE]
[ROW][C]Univariate ARIMA Extrapolation Forecast Performance[/C][/ROW]
[ROW][C]time[/C][C]% S.E.[/C][C]PE[/C][C]MAPE[/C][C]sMAPE[/C][C]Sq.E[/C][C]MSE[/C][C]RMSE[/C][C]ScaledE[/C][C]MASE[/C][/ROW]
[ROW][C]115[/C][C]0.0415[/C][C]-0.0271[/C][C]0.0271[/C][C]0.0268[/C][C]13379.0409[/C][C]0[/C][C]0[/C][C]-0.5255[/C][C]0.5255[/C][/ROW]
[ROW][C]116[/C][C]0.069[/C][C]-0.0373[/C][C]0.0322[/C][C]0.0317[/C][C]25507.785[/C][C]19443.413[/C][C]139.4396[/C][C]-0.7257[/C][C]0.6256[/C][/ROW]
[ROW][C]117[/C][C]0.0928[/C][C]-0.0181[/C][C]0.0275[/C][C]0.0271[/C][C]6265.8165[/C][C]15050.8808[/C][C]122.682[/C][C]-0.3597[/C][C]0.537[/C][/ROW]
[ROW][C]118[/C][C]0.1151[/C][C]0.0593[/C][C]0.0355[/C][C]0.0356[/C][C]88794.5512[/C][C]33486.7984[/C][C]182.994[/C][C]1.3539[/C][C]0.7412[/C][/ROW]
[ROW][C]119[/C][C]0.1357[/C][C]0.0838[/C][C]0.0451[/C][C]0.046[/C][C]194997.1395[/C][C]65788.8666[/C][C]256.4934[/C][C]2.0064[/C][C]0.9942[/C][/ROW]
[ROW][C]120[/C][C]0.1549[/C][C]0.0562[/C][C]0.047[/C][C]0.0479[/C][C]76580.3839[/C][C]67587.4528[/C][C]259.9759[/C][C]1.2574[/C][C]1.0381[/C][/ROW]
[ROW][C]121[/C][C]0.1729[/C][C]0.0563[/C][C]0.0483[/C][C]0.0494[/C][C]83439.8144[/C][C]69852.0759[/C][C]264.2954[/C][C]1.3125[/C][C]1.0773[/C][/ROW]
[ROW][C]122[/C][C]0.1898[/C][C]0.1023[/C][C]0.055[/C][C]0.0567[/C][C]319760.1728[/C][C]101090.588[/C][C]317.9475[/C][C]2.5693[/C][C]1.2638[/C][/ROW]
[ROW][C]123[/C][C]0.2059[/C][C]0.1487[/C][C]0.0655[/C][C]0.0682[/C][C]752501.3821[/C][C]173469.5651[/C][C]416.4968[/C][C]3.9414[/C][C]1.5613[/C][/ROW]
[ROW][C]124[/C][C]0.2213[/C][C]0.1406[/C][C]0.073[/C][C]0.0765[/C][C]672285.2615[/C][C]223351.1348[/C][C]472.6004[/C][C]3.7254[/C][C]1.7777[/C][/ROW]
[ROW][C]125[/C][C]0.2363[/C][C]0.1354[/C][C]0.0786[/C][C]0.0828[/C][C]627055.6733[/C][C]260051.5474[/C][C]509.9525[/C][C]3.5979[/C][C]1.9432[/C][/ROW]
[ROW][C]126[/C][C]0.2507[/C][C]0.1005[/C][C]0.0805[/C][C]0.0847[/C][C]328531.801[/C][C]265758.2352[/C][C]515.5174[/C][C]2.6043[/C][C]1.9983[/C][/ROW]
[/TABLE]
Source: https://freestatistics.org/blog/index.php?pk=298462&T=2

Globally Unique Identifier (entire table): ba.freestatistics.org/blog/index.php?pk=298462&T=2

As an alternative you can also use a QR Code:  

The GUIDs for individual cells are displayed in the table below:

Univariate ARIMA Extrapolation Forecast Performance
time% S.E.PEMAPEsMAPESq.EMSERMSEScaledEMASE
1150.0415-0.02710.02710.026813379.040900-0.52550.5255
1160.069-0.03730.03220.031725507.78519443.413139.4396-0.72570.6256
1170.0928-0.01810.02750.02716265.816515050.8808122.682-0.35970.537
1180.11510.05930.03550.035688794.551233486.7984182.9941.35390.7412
1190.13570.08380.04510.046194997.139565788.8666256.49342.00640.9942
1200.15490.05620.0470.047976580.383967587.4528259.97591.25741.0381
1210.17290.05630.04830.049483439.814469852.0759264.29541.31251.0773
1220.18980.10230.0550.0567319760.1728101090.588317.94752.56931.2638
1230.20590.14870.06550.0682752501.3821173469.5651416.49683.94141.5613
1240.22130.14060.0730.0765672285.2615223351.1348472.60043.72541.7777
1250.23630.13540.07860.0828627055.6733260051.5474509.95253.59791.9432
1260.25070.10050.08050.0847328531.801265758.2352515.51742.60431.9983


Parameters (Session):
par1 = 12 ; par2 = 0.0 ; par3 = 1 ; par4 = 1 ; par5 = 12 ; par6 = 3 ; par7 = 0 ; par8 = 0 ; par9 = 1 ; par10 = FALSE ;
Parameters (R input):
par1 = 12 ; par2 = 0.0 ; par3 = 1 ; par4 = 1 ; par5 = 12 ; par6 = 3 ; par7 = 0 ; par8 = 0 ; par9 = 1 ; par10 = FALSE ;
R code (references can be found in the software module):
par10 <- 'FALSE'
par9 <- '1'
par8 <- '0'
par7 <- '0'
par6 <- '3'
par5 <- '1'
par4 <- '1'
par3 <- '1'
par2 <- '0.0'
par1 <- '12'
par1 <- as.numeric(par1) #cut off periods
par2 <- as.numeric(par2) #lambda
par3 <- as.numeric(par3) #degree of non-seasonal differencing
par4 <- as.numeric(par4) #degree of seasonal differencing
par5 <- as.numeric(par5) #seasonal period
par6 <- as.numeric(par6) #p
par7 <- as.numeric(par7) #q
par8 <- as.numeric(par8) #P
par9 <- as.numeric(par9) #Q
if (par10 == 'TRUE') par10 <- TRUE
if (par10 == 'FALSE') par10 <- FALSE
if (par2 == 0) x <- log(x)
if (par2 != 0) x <- x^par2
lx <- length(x)
first <- lx - 2*par1
nx <- lx - par1
nx1 <- nx + 1
fx <- lx - nx
if (fx < 1) {
fx <- par5*2
nx1 <- lx + fx - 1
first <- lx - 2*fx
}
first <- 1
if (fx < 3) fx <- round(lx/10,0)
(arima.out <- arima(x[1:nx], order=c(par6,par3,par7), seasonal=list(order=c(par8,par4,par9), period=par5), include.mean=par10, method='ML'))
(forecast <- predict(arima.out,fx))
(lb <- forecast$pred - 1.96 * forecast$se)
(ub <- forecast$pred + 1.96 * forecast$se)
if (par2 == 0) {
x <- exp(x)
forecast$pred <- exp(forecast$pred)
lb <- exp(lb)
ub <- exp(ub)
}
if (par2 != 0) {
x <- x^(1/par2)
forecast$pred <- forecast$pred^(1/par2)
lb <- lb^(1/par2)
ub <- ub^(1/par2)
}
if (par2 < 0) {
olb <- lb
lb <- ub
ub <- olb
}
(actandfor <- c(x[1:nx], forecast$pred))
(perc.se <- (ub-forecast$pred)/1.96/forecast$pred)
bitmap(file='test1.png')
opar <- par(mar=c(4,4,2,2),las=1)
ylim <- c( min(x[first:nx],lb), max(x[first:nx],ub))
plot(x,ylim=ylim,type='n',xlim=c(first,lx))
usr <- par('usr')
rect(usr[1],usr[3],nx+1,usr[4],border=NA,col='lemonchiffon')
rect(nx1,usr[3],usr[2],usr[4],border=NA,col='lavender')
abline(h= (-3:3)*2 , col ='gray', lty =3)
polygon( c(nx1:lx,lx:nx1), c(lb,rev(ub)), col = 'orange', lty=2,border=NA)
lines(nx1:lx, lb , lty=2)
lines(nx1:lx, ub , lty=2)
lines(x, lwd=2)
lines(nx1:lx, forecast$pred , lwd=2 , col ='white')
box()
par(opar)
dev.off()
prob.dec <- array(NA, dim=fx)
prob.sdec <- array(NA, dim=fx)
prob.ldec <- array(NA, dim=fx)
prob.pval <- array(NA, dim=fx)
perf.pe <- array(0, dim=fx)
perf.spe <- array(0, dim=fx)
perf.scalederr <- array(0, dim=fx)
perf.mase <- array(0, dim=fx)
perf.mase1 <- array(0, dim=fx)
perf.mape <- array(0, dim=fx)
perf.smape <- array(0, dim=fx)
perf.mape1 <- array(0, dim=fx)
perf.smape1 <- array(0,dim=fx)
perf.se <- array(0, dim=fx)
perf.mse <- array(0, dim=fx)
perf.mse1 <- array(0, dim=fx)
perf.rmse <- array(0, dim=fx)
perf.scaleddenom <- 0
for (i in 2:fx) {
perf.scaleddenom = perf.scaleddenom + abs(x[nx+i] - x[nx+i-1])
}
perf.scaleddenom = perf.scaleddenom / (fx-1)
for (i in 1:fx) {
locSD <- (ub[i] - forecast$pred[i]) / 1.96
perf.scalederr[i] = (x[nx+i] - forecast$pred[i]) / perf.scaleddenom
perf.pe[i] = (x[nx+i] - forecast$pred[i]) / x[nx+i]
perf.spe[i] = 2*(x[nx+i] - forecast$pred[i]) / (x[nx+i] + forecast$pred[i])
perf.se[i] = (x[nx+i] - forecast$pred[i])^2
prob.dec[i] = pnorm((x[nx+i-1] - forecast$pred[i]) / locSD)
prob.sdec[i] = pnorm((x[nx+i-par5] - forecast$pred[i]) / locSD)
prob.ldec[i] = pnorm((x[nx] - forecast$pred[i]) / locSD)
prob.pval[i] = pnorm(abs(x[nx+i] - forecast$pred[i]) / locSD)
}
perf.mape[1] = abs(perf.pe[1])
perf.smape[1] = abs(perf.spe[1])
perf.mape1[1] = perf.mape[1]
perf.smape1[1] = perf.smape[1]
perf.mse[1] = perf.se[1]
perf.mase[1] = abs(perf.scalederr[1])
perf.mase1[1] = perf.mase[1]
for (i in 2:fx) {
perf.mape[i] = perf.mape[i-1] + abs(perf.pe[i])
perf.mape1[i] = perf.mape[i] / i
perf.smape[i] = perf.smape[i-1] + abs(perf.spe[i])
perf.smape1[i] = perf.smape[i] / i
perf.mse[i] = perf.mse[i-1] + perf.se[i]
perf.mse1[i] = perf.mse[i] / i
perf.mase[i] = perf.mase[i-1] + abs(perf.scalederr[i])
perf.mase1[i] = perf.mase[i] / i
}
perf.rmse = sqrt(perf.mse1)
bitmap(file='test2.png')
plot(forecast$pred, pch=19, type='b',main='ARIMA Extrapolation Forecast', ylab='Forecast and 95% CI', xlab='time',ylim=c(min(lb),max(ub)))
dum <- forecast$pred
dum[1:par1] <- x[(nx+1):lx]
lines(dum, lty=1)
lines(ub,lty=3)
lines(lb,lty=3)
dev.off()
load(file='createtable')
a<-table.start()
a<-table.row.start(a)
a<-table.element(a,'Univariate ARIMA Extrapolation Forecast',9,TRUE)
a<-table.row.end(a)
a<-table.row.start(a)
a<-table.element(a,'time',1,header=TRUE)
a<-table.element(a,'Y[t]',1,header=TRUE)
a<-table.element(a,'F[t]',1,header=TRUE)
a<-table.element(a,'95% LB',1,header=TRUE)
a<-table.element(a,'95% UB',1,header=TRUE)
a<-table.element(a,'p-value
(H0: Y[t] = F[t])',1,header=TRUE)
a<-table.element(a,'P(F[t]>Y[t-1])',1,header=TRUE)
a<-table.element(a,'P(F[t]>Y[t-s])',1,header=TRUE)
mylab <- paste('P(F[t]>Y[',nx,sep='')
mylab <- paste(mylab,'])',sep='')
a<-table.element(a,mylab,1,header=TRUE)
a<-table.row.end(a)
for (i in (nx-par5):nx) {
a<-table.row.start(a)
a<-table.element(a,i,header=TRUE)
a<-table.element(a,x[i])
a<-table.element(a,'-')
a<-table.row.end(a)
}
for (i in 1:fx) {
a<-table.row.start(a)
a<-table.element(a,nx+i,header=TRUE)
a<-table.element(a,round(x[nx+i],4))
a<-table.element(a,round(forecast$pred[i],4))
a<-table.element(a,round(lb[i],4))
a<-table.element(a,round(ub[i],4))
a<-table.element(a,round((1-prob.pval[i]),4))
a<-table.element(a,round((1-prob.dec[i]),4))
a<-table.element(a,round((1-prob.sdec[i]),4))
a<-table.element(a,round((1-prob.ldec[i]),4))
a<-table.row.end(a)
}
a<-table.end(a)
table.save(a,file='mytable.tab')
a<-table.start()
a<-table.row.start(a)
a<-table.element(a,'Univariate ARIMA Extrapolation Forecast Performance',10,TRUE)
a<-table.row.end(a)
a<-table.row.start(a)
a<-table.element(a,'time',1,header=TRUE)
a<-table.element(a,'% S.E.',1,header=TRUE)
a<-table.element(a,'PE',1,header=TRUE)
a<-table.element(a,'MAPE',1,header=TRUE)
a<-table.element(a,'sMAPE',1,header=TRUE)
a<-table.element(a,'Sq.E',1,header=TRUE)
a<-table.element(a,'MSE',1,header=TRUE)
a<-table.element(a,'RMSE',1,header=TRUE)
a<-table.element(a,'ScaledE',1,header=TRUE)
a<-table.element(a,'MASE',1,header=TRUE)
a<-table.row.end(a)
for (i in 1:fx) {
a<-table.row.start(a)
a<-table.element(a,nx+i,header=TRUE)
a<-table.element(a,round(perc.se[i],4))
a<-table.element(a,round(perf.pe[i],4))
a<-table.element(a,round(perf.mape1[i],4))
a<-table.element(a,round(perf.smape1[i],4))
a<-table.element(a,round(perf.se[i],4))
a<-table.element(a,round(perf.mse1[i],4))
a<-table.element(a,round(perf.rmse[i],4))
a<-table.element(a,round(perf.scalederr[i],4))
a<-table.element(a,round(perf.mase1[i],4))
a<-table.row.end(a)
}
a<-table.end(a)
table.save(a,file='mytable1.tab')