Free Statistics

of Irreproducible Research!

Author's title

Author*The author of this computation has been verified*
R Software Modulerwasp_arimabackwardselection.wasp
Title produced by softwareARIMA Backward Selection
Date of computationFri, 09 Dec 2016 09:56:54 +0100
Cite this page as followsStatistical Computations at FreeStatistics.org, Office for Research Development and Education, URL https://freestatistics.org/blog/index.php?v=date/2016/Dec/09/t1481273869kp18fqxtntpj2uq.htm/, Retrieved Fri, 01 Nov 2024 03:33:55 +0000
Statistical Computations at FreeStatistics.org, Office for Research Development and Education, URL https://freestatistics.org/blog/index.php?pk=298445, Retrieved Fri, 01 Nov 2024 03:33:55 +0000
QR Codes:

Original text written by user:
IsPrivate?No (this computation is public)
User-defined keywords
Estimated Impact160
Family? (F = Feedback message, R = changed R code, M = changed R Module, P = changed Parameters, D = changed Data)
-       [ARIMA Backward Selection] [] [2016-12-09 08:56:54] [6deb082de88ded72ec069288c69f9f98] [Current]
Feedback Forum

Post a new message
Dataseries X:
4480
4580
5360
4960
5140
5000
5080
5160
5080
5500
5260
5160
4500
4740
5840
5340
5500
5820
5620
5920
5980
6340
6220
5900
5280
5500
6460
5920
6240
6120
5980
6380
5920
6360
5860
5320
4780
4800
5480
5220
5380
5220
5200
5260
5060
5880
5580
5020
6060
5980
6680
6560
6680
6420
6660
7000
6780
7460
6960
6560
6060
6140
7160
6920
7140
7180
7340
7480
7620
8280
7740
7700
7080
7100
8380
7840
7880
8300
8140
8320
8340
8740
8520
8260
7260
7360
8620
8220
8360
8400
8080
8400
8500
8820
8580
7740
7640
7480
8900
7920
8560
8640
8340
9100
8720
9360
8800
8060
7380
7040
8020
7800
8380
8480
8320
8780
8360
9540
8880
7960
7660
7820
8680
8560
8720
8920


Summary of computational transaction
Raw Input view raw input (R code)
Raw Outputview raw output of R engine
Computing time7 seconds
R ServerBig Analytics Cloud Computing Center

\begin{tabular}{lllllllll}
\hline
Summary of computational transaction \tabularnewline
Raw Input view raw input (R code)  \tabularnewline
Raw Outputview raw output of R engine  \tabularnewline
Computing time7 seconds \tabularnewline
R ServerBig Analytics Cloud Computing Center \tabularnewline
\hline
\end{tabular}
%Source: https://freestatistics.org/blog/index.php?pk=298445&T=0

[TABLE]
[ROW]
Summary of computational transaction[/C][/ROW] [ROW]Raw Input[/C] view raw input (R code) [/C][/ROW] [ROW]Raw Output[/C]view raw output of R engine [/C][/ROW] [ROW]Computing time[/C]7 seconds[/C][/ROW] [ROW]R Server[/C]Big Analytics Cloud Computing Center[/C][/ROW] [/TABLE] Source: https://freestatistics.org/blog/index.php?pk=298445&T=0

Globally Unique Identifier (entire table): ba.freestatistics.org/blog/index.php?pk=298445&T=0

As an alternative you can also use a QR Code:  

The GUIDs for individual cells are displayed in the table below:

Summary of computational transaction
Raw Input view raw input (R code)
Raw Outputview raw output of R engine
Computing time7 seconds
R ServerBig Analytics Cloud Computing Center


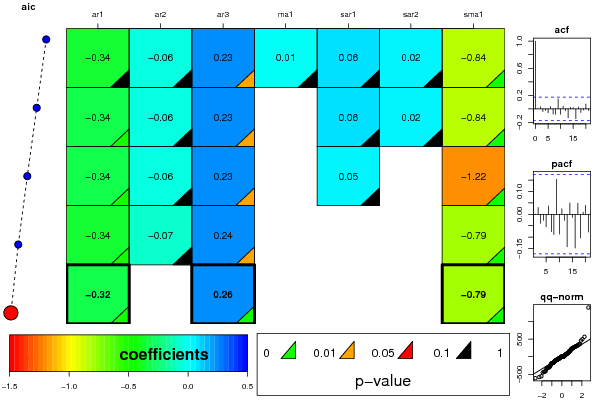
ARIMA Parameter Estimation and Backward Selection
Iterationar1ar2ar3ma1sar1sar2sma1
Estimates ( 1 )-0.3429-0.05890.22740.00540.0610.0205-0.8385
(p-val)(0.2268 )(0.6755 )(0.0294 )(0.985 )(0.7208 )(0.8767 )(1e-04 )
Estimates ( 2 )-0.3379-0.0570.228100.0610.0207-0.8381
(p-val)(6e-04 )(0.5672 )(0.0177 )(NA )(0.721 )(0.8756 )(1e-04 )
Estimates ( 3 )-0.3359-0.05810.227900.04820-1.217
(p-val)(6e-04 )(0.5596 )(0.0182 )(NA )(0.749 )(NA )(0 )
Estimates ( 4 )-0.3441-0.06540.2368000-0.7859
(p-val)(2e-04 )(0.5001 )(0.0103 )(NA )(NA )(NA )(0 )
Estimates ( 5 )-0.321600.2586000-0.7911
(p-val)(2e-04 )(NA )(0.0029 )(NA )(NA )(NA )(0 )
Estimates ( 6 )NANANANANANANA
(p-val)(NA )(NA )(NA )(NA )(NA )(NA )(NA )
Estimates ( 7 )NANANANANANANA
(p-val)(NA )(NA )(NA )(NA )(NA )(NA )(NA )
Estimates ( 8 )NANANANANANANA
(p-val)(NA )(NA )(NA )(NA )(NA )(NA )(NA )
Estimates ( 9 )NANANANANANANA
(p-val)(NA )(NA )(NA )(NA )(NA )(NA )(NA )
Estimates ( 10 )NANANANANANANA
(p-val)(NA )(NA )(NA )(NA )(NA )(NA )(NA )
Estimates ( 11 )NANANANANANANA
(p-val)(NA )(NA )(NA )(NA )(NA )(NA )(NA )
Estimates ( 12 )NANANANANANANA
(p-val)(NA )(NA )(NA )(NA )(NA )(NA )(NA )
Estimates ( 13 )NANANANANANANA
(p-val)(NA )(NA )(NA )(NA )(NA )(NA )(NA )

\begin{tabular}{lllllllll}
\hline
ARIMA Parameter Estimation and Backward Selection \tabularnewline
Iteration & ar1 & ar2 & ar3 & ma1 & sar1 & sar2 & sma1 \tabularnewline
Estimates ( 1 ) & -0.3429 & -0.0589 & 0.2274 & 0.0054 & 0.061 & 0.0205 & -0.8385 \tabularnewline
(p-val) & (0.2268 ) & (0.6755 ) & (0.0294 ) & (0.985 ) & (0.7208 ) & (0.8767 ) & (1e-04 ) \tabularnewline
Estimates ( 2 ) & -0.3379 & -0.057 & 0.2281 & 0 & 0.061 & 0.0207 & -0.8381 \tabularnewline
(p-val) & (6e-04 ) & (0.5672 ) & (0.0177 ) & (NA ) & (0.721 ) & (0.8756 ) & (1e-04 ) \tabularnewline
Estimates ( 3 ) & -0.3359 & -0.0581 & 0.2279 & 0 & 0.0482 & 0 & -1.217 \tabularnewline
(p-val) & (6e-04 ) & (0.5596 ) & (0.0182 ) & (NA ) & (0.749 ) & (NA ) & (0 ) \tabularnewline
Estimates ( 4 ) & -0.3441 & -0.0654 & 0.2368 & 0 & 0 & 0 & -0.7859 \tabularnewline
(p-val) & (2e-04 ) & (0.5001 ) & (0.0103 ) & (NA ) & (NA ) & (NA ) & (0 ) \tabularnewline
Estimates ( 5 ) & -0.3216 & 0 & 0.2586 & 0 & 0 & 0 & -0.7911 \tabularnewline
(p-val) & (2e-04 ) & (NA ) & (0.0029 ) & (NA ) & (NA ) & (NA ) & (0 ) \tabularnewline
Estimates ( 6 ) & NA & NA & NA & NA & NA & NA & NA \tabularnewline
(p-val) & (NA ) & (NA ) & (NA ) & (NA ) & (NA ) & (NA ) & (NA ) \tabularnewline
Estimates ( 7 ) & NA & NA & NA & NA & NA & NA & NA \tabularnewline
(p-val) & (NA ) & (NA ) & (NA ) & (NA ) & (NA ) & (NA ) & (NA ) \tabularnewline
Estimates ( 8 ) & NA & NA & NA & NA & NA & NA & NA \tabularnewline
(p-val) & (NA ) & (NA ) & (NA ) & (NA ) & (NA ) & (NA ) & (NA ) \tabularnewline
Estimates ( 9 ) & NA & NA & NA & NA & NA & NA & NA \tabularnewline
(p-val) & (NA ) & (NA ) & (NA ) & (NA ) & (NA ) & (NA ) & (NA ) \tabularnewline
Estimates ( 10 ) & NA & NA & NA & NA & NA & NA & NA \tabularnewline
(p-val) & (NA ) & (NA ) & (NA ) & (NA ) & (NA ) & (NA ) & (NA ) \tabularnewline
Estimates ( 11 ) & NA & NA & NA & NA & NA & NA & NA \tabularnewline
(p-val) & (NA ) & (NA ) & (NA ) & (NA ) & (NA ) & (NA ) & (NA ) \tabularnewline
Estimates ( 12 ) & NA & NA & NA & NA & NA & NA & NA \tabularnewline
(p-val) & (NA ) & (NA ) & (NA ) & (NA ) & (NA ) & (NA ) & (NA ) \tabularnewline
Estimates ( 13 ) & NA & NA & NA & NA & NA & NA & NA \tabularnewline
(p-val) & (NA ) & (NA ) & (NA ) & (NA ) & (NA ) & (NA ) & (NA ) \tabularnewline
\hline
\end{tabular}
%Source: https://freestatistics.org/blog/index.php?pk=298445&T=1

[TABLE]
[ROW][C]ARIMA Parameter Estimation and Backward Selection[/C][/ROW]
[ROW][C]Iteration[/C][C]ar1[/C][C]ar2[/C][C]ar3[/C][C]ma1[/C][C]sar1[/C][C]sar2[/C][C]sma1[/C][/ROW]
[ROW][C]Estimates ( 1 )[/C][C]-0.3429[/C][C]-0.0589[/C][C]0.2274[/C][C]0.0054[/C][C]0.061[/C][C]0.0205[/C][C]-0.8385[/C][/ROW]
[ROW][C](p-val)[/C][C](0.2268 )[/C][C](0.6755 )[/C][C](0.0294 )[/C][C](0.985 )[/C][C](0.7208 )[/C][C](0.8767 )[/C][C](1e-04 )[/C][/ROW]
[ROW][C]Estimates ( 2 )[/C][C]-0.3379[/C][C]-0.057[/C][C]0.2281[/C][C]0[/C][C]0.061[/C][C]0.0207[/C][C]-0.8381[/C][/ROW]
[ROW][C](p-val)[/C][C](6e-04 )[/C][C](0.5672 )[/C][C](0.0177 )[/C][C](NA )[/C][C](0.721 )[/C][C](0.8756 )[/C][C](1e-04 )[/C][/ROW]
[ROW][C]Estimates ( 3 )[/C][C]-0.3359[/C][C]-0.0581[/C][C]0.2279[/C][C]0[/C][C]0.0482[/C][C]0[/C][C]-1.217[/C][/ROW]
[ROW][C](p-val)[/C][C](6e-04 )[/C][C](0.5596 )[/C][C](0.0182 )[/C][C](NA )[/C][C](0.749 )[/C][C](NA )[/C][C](0 )[/C][/ROW]
[ROW][C]Estimates ( 4 )[/C][C]-0.3441[/C][C]-0.0654[/C][C]0.2368[/C][C]0[/C][C]0[/C][C]0[/C][C]-0.7859[/C][/ROW]
[ROW][C](p-val)[/C][C](2e-04 )[/C][C](0.5001 )[/C][C](0.0103 )[/C][C](NA )[/C][C](NA )[/C][C](NA )[/C][C](0 )[/C][/ROW]
[ROW][C]Estimates ( 5 )[/C][C]-0.3216[/C][C]0[/C][C]0.2586[/C][C]0[/C][C]0[/C][C]0[/C][C]-0.7911[/C][/ROW]
[ROW][C](p-val)[/C][C](2e-04 )[/C][C](NA )[/C][C](0.0029 )[/C][C](NA )[/C][C](NA )[/C][C](NA )[/C][C](0 )[/C][/ROW]
[ROW][C]Estimates ( 6 )[/C][C]NA[/C][C]NA[/C][C]NA[/C][C]NA[/C][C]NA[/C][C]NA[/C][C]NA[/C][/ROW]
[ROW][C](p-val)[/C][C](NA )[/C][C](NA )[/C][C](NA )[/C][C](NA )[/C][C](NA )[/C][C](NA )[/C][C](NA )[/C][/ROW]
[ROW][C]Estimates ( 7 )[/C][C]NA[/C][C]NA[/C][C]NA[/C][C]NA[/C][C]NA[/C][C]NA[/C][C]NA[/C][/ROW]
[ROW][C](p-val)[/C][C](NA )[/C][C](NA )[/C][C](NA )[/C][C](NA )[/C][C](NA )[/C][C](NA )[/C][C](NA )[/C][/ROW]
[ROW][C]Estimates ( 8 )[/C][C]NA[/C][C]NA[/C][C]NA[/C][C]NA[/C][C]NA[/C][C]NA[/C][C]NA[/C][/ROW]
[ROW][C](p-val)[/C][C](NA )[/C][C](NA )[/C][C](NA )[/C][C](NA )[/C][C](NA )[/C][C](NA )[/C][C](NA )[/C][/ROW]
[ROW][C]Estimates ( 9 )[/C][C]NA[/C][C]NA[/C][C]NA[/C][C]NA[/C][C]NA[/C][C]NA[/C][C]NA[/C][/ROW]
[ROW][C](p-val)[/C][C](NA )[/C][C](NA )[/C][C](NA )[/C][C](NA )[/C][C](NA )[/C][C](NA )[/C][C](NA )[/C][/ROW]
[ROW][C]Estimates ( 10 )[/C][C]NA[/C][C]NA[/C][C]NA[/C][C]NA[/C][C]NA[/C][C]NA[/C][C]NA[/C][/ROW]
[ROW][C](p-val)[/C][C](NA )[/C][C](NA )[/C][C](NA )[/C][C](NA )[/C][C](NA )[/C][C](NA )[/C][C](NA )[/C][/ROW]
[ROW][C]Estimates ( 11 )[/C][C]NA[/C][C]NA[/C][C]NA[/C][C]NA[/C][C]NA[/C][C]NA[/C][C]NA[/C][/ROW]
[ROW][C](p-val)[/C][C](NA )[/C][C](NA )[/C][C](NA )[/C][C](NA )[/C][C](NA )[/C][C](NA )[/C][C](NA )[/C][/ROW]
[ROW][C]Estimates ( 12 )[/C][C]NA[/C][C]NA[/C][C]NA[/C][C]NA[/C][C]NA[/C][C]NA[/C][C]NA[/C][/ROW]
[ROW][C](p-val)[/C][C](NA )[/C][C](NA )[/C][C](NA )[/C][C](NA )[/C][C](NA )[/C][C](NA )[/C][C](NA )[/C][/ROW]
[ROW][C]Estimates ( 13 )[/C][C]NA[/C][C]NA[/C][C]NA[/C][C]NA[/C][C]NA[/C][C]NA[/C][C]NA[/C][/ROW]
[ROW][C](p-val)[/C][C](NA )[/C][C](NA )[/C][C](NA )[/C][C](NA )[/C][C](NA )[/C][C](NA )[/C][C](NA )[/C][/ROW]
[/TABLE]
Source: https://freestatistics.org/blog/index.php?pk=298445&T=1

Globally Unique Identifier (entire table): ba.freestatistics.org/blog/index.php?pk=298445&T=1

As an alternative you can also use a QR Code:  

The GUIDs for individual cells are displayed in the table below:

ARIMA Parameter Estimation and Backward Selection
Iterationar1ar2ar3ma1sar1sar2sma1
Estimates ( 1 )-0.3429-0.05890.22740.00540.0610.0205-0.8385
(p-val)(0.2268 )(0.6755 )(0.0294 )(0.985 )(0.7208 )(0.8767 )(1e-04 )
Estimates ( 2 )-0.3379-0.0570.228100.0610.0207-0.8381
(p-val)(6e-04 )(0.5672 )(0.0177 )(NA )(0.721 )(0.8756 )(1e-04 )
Estimates ( 3 )-0.3359-0.05810.227900.04820-1.217
(p-val)(6e-04 )(0.5596 )(0.0182 )(NA )(0.749 )(NA )(0 )
Estimates ( 4 )-0.3441-0.06540.2368000-0.7859
(p-val)(2e-04 )(0.5001 )(0.0103 )(NA )(NA )(NA )(0 )
Estimates ( 5 )-0.321600.2586000-0.7911
(p-val)(2e-04 )(NA )(0.0029 )(NA )(NA )(NA )(0 )
Estimates ( 6 )NANANANANANANA
(p-val)(NA )(NA )(NA )(NA )(NA )(NA )(NA )
Estimates ( 7 )NANANANANANANA
(p-val)(NA )(NA )(NA )(NA )(NA )(NA )(NA )
Estimates ( 8 )NANANANANANANA
(p-val)(NA )(NA )(NA )(NA )(NA )(NA )(NA )
Estimates ( 9 )NANANANANANANA
(p-val)(NA )(NA )(NA )(NA )(NA )(NA )(NA )
Estimates ( 10 )NANANANANANANA
(p-val)(NA )(NA )(NA )(NA )(NA )(NA )(NA )
Estimates ( 11 )NANANANANANANA
(p-val)(NA )(NA )(NA )(NA )(NA )(NA )(NA )
Estimates ( 12 )NANANANANANANA
(p-val)(NA )(NA )(NA )(NA )(NA )(NA )(NA )
Estimates ( 13 )NANANANANANANA
(p-val)(NA )(NA )(NA )(NA )(NA )(NA )(NA )


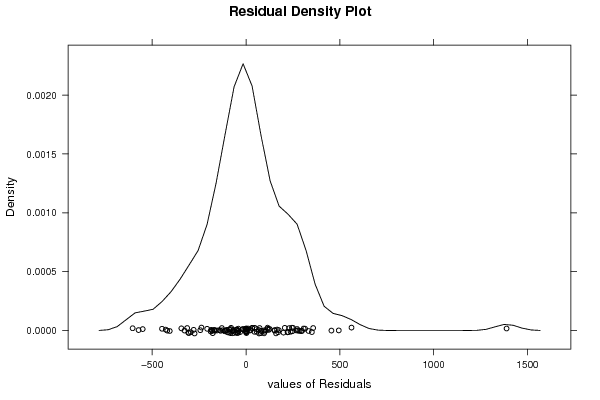
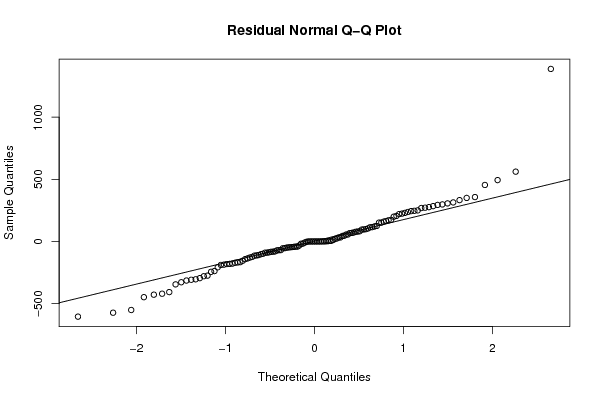
Estimated ARIMA Residuals
Value
-17.6893223626162
99.6845694448738
276.89351479493
33.2161768317775
-54.1955228755835
294.697060625328
-79.4273526687647
121.410612924336
80.415182914372
46.5921041243501
44.9235238408776
-135.742377560217
-31.5797073082935
12.4126529551502
56.9172016501139
-69.7620663006732
97.3484897530131
-154.709431320588
-108.70624207341
115.96832145552
-294.302100482571
-70.8041382770924
-344.48883149518
-274.374590789302
-53.5006224211394
-89.6157442812926
-243.698192413749
96.1721930359928
32.68404370713
-113.955038805363
-44.4238057558636
-171.182816319296
-47.0338778721865
350.812473179563
174.367985698015
-177.573460181885
1388.52353708075
298.558733517652
-89.8677198718568
-141.641860961354
55.8129817772233
-188.399492564166
152.269411360779
237.695887078002
78.4574241216592
69.5273321540388
-180.860347496877
-46.1793139341891
-419.884592253795
-82.499205770258
165.244679512839
250.644865316107
82.6514716804546
105.372854544761
170.988910032333
-49.7774656043818
269.763144692039
159.830603534748
-111.836545528502
221.294350699365
-307.613324835874
-129.122303248134
272.074835668267
5.95259757114604
-186.262880708943
314.709748769355
1.99713390482946
-40.8105824792625
-8.66457057190356
-98.4729326963015
125.194801960636
72.4101152335776
-604.319806652519
-237.544098760697
244.812418325443
230.14126929152
-16.7542256703223
-86.4974489048632
-313.691745953665
4.61199134461481
199.741019728138
-81.4269440019443
21.5785971284061
-550.701627454847
247.205655386274
-168.157571559538
455.126530124788
-572.595029645804
357.853077927771
68.4702188169917
-40.8593718650606
333.195962654232
-180.003856186958
114.877157604628
-327.653613703044
-303.76396058182
-447.745156232839
-427.65033425986
-207.089372159793
285.044777380954
494.230895711338
206.254789256447
-68.7823000040193
24.4025351206402
-279.091016707865
562.124834502838
-102.071622946716
-406.594479550425
-165.904377093009
306.924187244438
-42.9073942242677
224.544136269319
-124.208711962785
151.875381729459

\begin{tabular}{lllllllll}
\hline
Estimated ARIMA Residuals \tabularnewline
Value \tabularnewline
-17.6893223626162 \tabularnewline
99.6845694448738 \tabularnewline
276.89351479493 \tabularnewline
33.2161768317775 \tabularnewline
-54.1955228755835 \tabularnewline
294.697060625328 \tabularnewline
-79.4273526687647 \tabularnewline
121.410612924336 \tabularnewline
80.415182914372 \tabularnewline
46.5921041243501 \tabularnewline
44.9235238408776 \tabularnewline
-135.742377560217 \tabularnewline
-31.5797073082935 \tabularnewline
12.4126529551502 \tabularnewline
56.9172016501139 \tabularnewline
-69.7620663006732 \tabularnewline
97.3484897530131 \tabularnewline
-154.709431320588 \tabularnewline
-108.70624207341 \tabularnewline
115.96832145552 \tabularnewline
-294.302100482571 \tabularnewline
-70.8041382770924 \tabularnewline
-344.48883149518 \tabularnewline
-274.374590789302 \tabularnewline
-53.5006224211394 \tabularnewline
-89.6157442812926 \tabularnewline
-243.698192413749 \tabularnewline
96.1721930359928 \tabularnewline
32.68404370713 \tabularnewline
-113.955038805363 \tabularnewline
-44.4238057558636 \tabularnewline
-171.182816319296 \tabularnewline
-47.0338778721865 \tabularnewline
350.812473179563 \tabularnewline
174.367985698015 \tabularnewline
-177.573460181885 \tabularnewline
1388.52353708075 \tabularnewline
298.558733517652 \tabularnewline
-89.8677198718568 \tabularnewline
-141.641860961354 \tabularnewline
55.8129817772233 \tabularnewline
-188.399492564166 \tabularnewline
152.269411360779 \tabularnewline
237.695887078002 \tabularnewline
78.4574241216592 \tabularnewline
69.5273321540388 \tabularnewline
-180.860347496877 \tabularnewline
-46.1793139341891 \tabularnewline
-419.884592253795 \tabularnewline
-82.499205770258 \tabularnewline
165.244679512839 \tabularnewline
250.644865316107 \tabularnewline
82.6514716804546 \tabularnewline
105.372854544761 \tabularnewline
170.988910032333 \tabularnewline
-49.7774656043818 \tabularnewline
269.763144692039 \tabularnewline
159.830603534748 \tabularnewline
-111.836545528502 \tabularnewline
221.294350699365 \tabularnewline
-307.613324835874 \tabularnewline
-129.122303248134 \tabularnewline
272.074835668267 \tabularnewline
5.95259757114604 \tabularnewline
-186.262880708943 \tabularnewline
314.709748769355 \tabularnewline
1.99713390482946 \tabularnewline
-40.8105824792625 \tabularnewline
-8.66457057190356 \tabularnewline
-98.4729326963015 \tabularnewline
125.194801960636 \tabularnewline
72.4101152335776 \tabularnewline
-604.319806652519 \tabularnewline
-237.544098760697 \tabularnewline
244.812418325443 \tabularnewline
230.14126929152 \tabularnewline
-16.7542256703223 \tabularnewline
-86.4974489048632 \tabularnewline
-313.691745953665 \tabularnewline
4.61199134461481 \tabularnewline
199.741019728138 \tabularnewline
-81.4269440019443 \tabularnewline
21.5785971284061 \tabularnewline
-550.701627454847 \tabularnewline
247.205655386274 \tabularnewline
-168.157571559538 \tabularnewline
455.126530124788 \tabularnewline
-572.595029645804 \tabularnewline
357.853077927771 \tabularnewline
68.4702188169917 \tabularnewline
-40.8593718650606 \tabularnewline
333.195962654232 \tabularnewline
-180.003856186958 \tabularnewline
114.877157604628 \tabularnewline
-327.653613703044 \tabularnewline
-303.76396058182 \tabularnewline
-447.745156232839 \tabularnewline
-427.65033425986 \tabularnewline
-207.089372159793 \tabularnewline
285.044777380954 \tabularnewline
494.230895711338 \tabularnewline
206.254789256447 \tabularnewline
-68.7823000040193 \tabularnewline
24.4025351206402 \tabularnewline
-279.091016707865 \tabularnewline
562.124834502838 \tabularnewline
-102.071622946716 \tabularnewline
-406.594479550425 \tabularnewline
-165.904377093009 \tabularnewline
306.924187244438 \tabularnewline
-42.9073942242677 \tabularnewline
224.544136269319 \tabularnewline
-124.208711962785 \tabularnewline
151.875381729459 \tabularnewline
\hline
\end{tabular}
%Source: https://freestatistics.org/blog/index.php?pk=298445&T=2

[TABLE]
[ROW][C]Estimated ARIMA Residuals[/C][/ROW]
[ROW][C]Value[/C][/ROW]
[ROW][C]-17.6893223626162[/C][/ROW]
[ROW][C]99.6845694448738[/C][/ROW]
[ROW][C]276.89351479493[/C][/ROW]
[ROW][C]33.2161768317775[/C][/ROW]
[ROW][C]-54.1955228755835[/C][/ROW]
[ROW][C]294.697060625328[/C][/ROW]
[ROW][C]-79.4273526687647[/C][/ROW]
[ROW][C]121.410612924336[/C][/ROW]
[ROW][C]80.415182914372[/C][/ROW]
[ROW][C]46.5921041243501[/C][/ROW]
[ROW][C]44.9235238408776[/C][/ROW]
[ROW][C]-135.742377560217[/C][/ROW]
[ROW][C]-31.5797073082935[/C][/ROW]
[ROW][C]12.4126529551502[/C][/ROW]
[ROW][C]56.9172016501139[/C][/ROW]
[ROW][C]-69.7620663006732[/C][/ROW]
[ROW][C]97.3484897530131[/C][/ROW]
[ROW][C]-154.709431320588[/C][/ROW]
[ROW][C]-108.70624207341[/C][/ROW]
[ROW][C]115.96832145552[/C][/ROW]
[ROW][C]-294.302100482571[/C][/ROW]
[ROW][C]-70.8041382770924[/C][/ROW]
[ROW][C]-344.48883149518[/C][/ROW]
[ROW][C]-274.374590789302[/C][/ROW]
[ROW][C]-53.5006224211394[/C][/ROW]
[ROW][C]-89.6157442812926[/C][/ROW]
[ROW][C]-243.698192413749[/C][/ROW]
[ROW][C]96.1721930359928[/C][/ROW]
[ROW][C]32.68404370713[/C][/ROW]
[ROW][C]-113.955038805363[/C][/ROW]
[ROW][C]-44.4238057558636[/C][/ROW]
[ROW][C]-171.182816319296[/C][/ROW]
[ROW][C]-47.0338778721865[/C][/ROW]
[ROW][C]350.812473179563[/C][/ROW]
[ROW][C]174.367985698015[/C][/ROW]
[ROW][C]-177.573460181885[/C][/ROW]
[ROW][C]1388.52353708075[/C][/ROW]
[ROW][C]298.558733517652[/C][/ROW]
[ROW][C]-89.8677198718568[/C][/ROW]
[ROW][C]-141.641860961354[/C][/ROW]
[ROW][C]55.8129817772233[/C][/ROW]
[ROW][C]-188.399492564166[/C][/ROW]
[ROW][C]152.269411360779[/C][/ROW]
[ROW][C]237.695887078002[/C][/ROW]
[ROW][C]78.4574241216592[/C][/ROW]
[ROW][C]69.5273321540388[/C][/ROW]
[ROW][C]-180.860347496877[/C][/ROW]
[ROW][C]-46.1793139341891[/C][/ROW]
[ROW][C]-419.884592253795[/C][/ROW]
[ROW][C]-82.499205770258[/C][/ROW]
[ROW][C]165.244679512839[/C][/ROW]
[ROW][C]250.644865316107[/C][/ROW]
[ROW][C]82.6514716804546[/C][/ROW]
[ROW][C]105.372854544761[/C][/ROW]
[ROW][C]170.988910032333[/C][/ROW]
[ROW][C]-49.7774656043818[/C][/ROW]
[ROW][C]269.763144692039[/C][/ROW]
[ROW][C]159.830603534748[/C][/ROW]
[ROW][C]-111.836545528502[/C][/ROW]
[ROW][C]221.294350699365[/C][/ROW]
[ROW][C]-307.613324835874[/C][/ROW]
[ROW][C]-129.122303248134[/C][/ROW]
[ROW][C]272.074835668267[/C][/ROW]
[ROW][C]5.95259757114604[/C][/ROW]
[ROW][C]-186.262880708943[/C][/ROW]
[ROW][C]314.709748769355[/C][/ROW]
[ROW][C]1.99713390482946[/C][/ROW]
[ROW][C]-40.8105824792625[/C][/ROW]
[ROW][C]-8.66457057190356[/C][/ROW]
[ROW][C]-98.4729326963015[/C][/ROW]
[ROW][C]125.194801960636[/C][/ROW]
[ROW][C]72.4101152335776[/C][/ROW]
[ROW][C]-604.319806652519[/C][/ROW]
[ROW][C]-237.544098760697[/C][/ROW]
[ROW][C]244.812418325443[/C][/ROW]
[ROW][C]230.14126929152[/C][/ROW]
[ROW][C]-16.7542256703223[/C][/ROW]
[ROW][C]-86.4974489048632[/C][/ROW]
[ROW][C]-313.691745953665[/C][/ROW]
[ROW][C]4.61199134461481[/C][/ROW]
[ROW][C]199.741019728138[/C][/ROW]
[ROW][C]-81.4269440019443[/C][/ROW]
[ROW][C]21.5785971284061[/C][/ROW]
[ROW][C]-550.701627454847[/C][/ROW]
[ROW][C]247.205655386274[/C][/ROW]
[ROW][C]-168.157571559538[/C][/ROW]
[ROW][C]455.126530124788[/C][/ROW]
[ROW][C]-572.595029645804[/C][/ROW]
[ROW][C]357.853077927771[/C][/ROW]
[ROW][C]68.4702188169917[/C][/ROW]
[ROW][C]-40.8593718650606[/C][/ROW]
[ROW][C]333.195962654232[/C][/ROW]
[ROW][C]-180.003856186958[/C][/ROW]
[ROW][C]114.877157604628[/C][/ROW]
[ROW][C]-327.653613703044[/C][/ROW]
[ROW][C]-303.76396058182[/C][/ROW]
[ROW][C]-447.745156232839[/C][/ROW]
[ROW][C]-427.65033425986[/C][/ROW]
[ROW][C]-207.089372159793[/C][/ROW]
[ROW][C]285.044777380954[/C][/ROW]
[ROW][C]494.230895711338[/C][/ROW]
[ROW][C]206.254789256447[/C][/ROW]
[ROW][C]-68.7823000040193[/C][/ROW]
[ROW][C]24.4025351206402[/C][/ROW]
[ROW][C]-279.091016707865[/C][/ROW]
[ROW][C]562.124834502838[/C][/ROW]
[ROW][C]-102.071622946716[/C][/ROW]
[ROW][C]-406.594479550425[/C][/ROW]
[ROW][C]-165.904377093009[/C][/ROW]
[ROW][C]306.924187244438[/C][/ROW]
[ROW][C]-42.9073942242677[/C][/ROW]
[ROW][C]224.544136269319[/C][/ROW]
[ROW][C]-124.208711962785[/C][/ROW]
[ROW][C]151.875381729459[/C][/ROW]
[/TABLE]
Source: https://freestatistics.org/blog/index.php?pk=298445&T=2

Globally Unique Identifier (entire table): ba.freestatistics.org/blog/index.php?pk=298445&T=2

As an alternative you can also use a QR Code:  

The GUIDs for individual cells are displayed in the table below:

Estimated ARIMA Residuals
Value
-17.6893223626162
99.6845694448738
276.89351479493
33.2161768317775
-54.1955228755835
294.697060625328
-79.4273526687647
121.410612924336
80.415182914372
46.5921041243501
44.9235238408776
-135.742377560217
-31.5797073082935
12.4126529551502
56.9172016501139
-69.7620663006732
97.3484897530131
-154.709431320588
-108.70624207341
115.96832145552
-294.302100482571
-70.8041382770924
-344.48883149518
-274.374590789302
-53.5006224211394
-89.6157442812926
-243.698192413749
96.1721930359928
32.68404370713
-113.955038805363
-44.4238057558636
-171.182816319296
-47.0338778721865
350.812473179563
174.367985698015
-177.573460181885
1388.52353708075
298.558733517652
-89.8677198718568
-141.641860961354
55.8129817772233
-188.399492564166
152.269411360779
237.695887078002
78.4574241216592
69.5273321540388
-180.860347496877
-46.1793139341891
-419.884592253795
-82.499205770258
165.244679512839
250.644865316107
82.6514716804546
105.372854544761
170.988910032333
-49.7774656043818
269.763144692039
159.830603534748
-111.836545528502
221.294350699365
-307.613324835874
-129.122303248134
272.074835668267
5.95259757114604
-186.262880708943
314.709748769355
1.99713390482946
-40.8105824792625
-8.66457057190356
-98.4729326963015
125.194801960636
72.4101152335776
-604.319806652519
-237.544098760697
244.812418325443
230.14126929152
-16.7542256703223
-86.4974489048632
-313.691745953665
4.61199134461481
199.741019728138
-81.4269440019443
21.5785971284061
-550.701627454847
247.205655386274
-168.157571559538
455.126530124788
-572.595029645804
357.853077927771
68.4702188169917
-40.8593718650606
333.195962654232
-180.003856186958
114.877157604628
-327.653613703044
-303.76396058182
-447.745156232839
-427.65033425986
-207.089372159793
285.044777380954
494.230895711338
206.254789256447
-68.7823000040193
24.4025351206402
-279.091016707865
562.124834502838
-102.071622946716
-406.594479550425
-165.904377093009
306.924187244438
-42.9073942242677
224.544136269319
-124.208711962785
151.875381729459


Parameters (Session):
par1 = FALSE ; par2 = 1 ; par3 = 1 ; par4 = 1 ; par5 = 12 ; par6 = 3 ; par7 = 1 ; par8 = 2 ; par9 = 1 ;
Parameters (R input):
par1 = FALSE ; par2 = 1 ; par3 = 1 ; par4 = 1 ; par5 = 12 ; par6 = 3 ; par7 = 1 ; par8 = 2 ; par9 = 1 ;
R code (references can be found in the software module):
library(lattice)
if (par1 == 'TRUE') par1 <- TRUE
if (par1 == 'FALSE') par1 <- FALSE
par2 <- as.numeric(par2) #Box-Cox lambda transformation parameter
par3 <- as.numeric(par3) #degree of non-seasonal differencing
par4 <- as.numeric(par4) #degree of seasonal differencing
par5 <- as.numeric(par5) #seasonal period
par6 <- as.numeric(par6) #degree (p) of the non-seasonal AR(p) polynomial
par7 <- as.numeric(par7) #degree (q) of the non-seasonal MA(q) polynomial
par8 <- as.numeric(par8) #degree (P) of the seasonal AR(P) polynomial
par9 <- as.numeric(par9) #degree (Q) of the seasonal MA(Q) polynomial
armaGR <- function(arima.out, names, n){
try1 <- arima.out$coef
try2 <- sqrt(diag(arima.out$var.coef))
try.data.frame <- data.frame(matrix(NA,ncol=4,nrow=length(names)))
dimnames(try.data.frame) <- list(names,c('coef','std','tstat','pv'))
try.data.frame[,1] <- try1
for(i in 1:length(try2)) try.data.frame[which(rownames(try.data.frame)==names(try2)[i]),2] <- try2[i]
try.data.frame[,3] <- try.data.frame[,1] / try.data.frame[,2]
try.data.frame[,4] <- round((1-pt(abs(try.data.frame[,3]),df=n-(length(try2)+1)))*2,5)
vector <- rep(NA,length(names))
vector[is.na(try.data.frame[,4])] <- 0
maxi <- which.max(try.data.frame[,4])
continue <- max(try.data.frame[,4],na.rm=TRUE) > .05
vector[maxi] <- 0
list(summary=try.data.frame,next.vector=vector,continue=continue)
}
arimaSelect <- function(series, order=c(13,0,0), seasonal=list(order=c(2,0,0),period=12), include.mean=F){
nrc <- order[1]+order[3]+seasonal$order[1]+seasonal$order[3]
coeff <- matrix(NA, nrow=nrc*2, ncol=nrc)
pval <- matrix(NA, nrow=nrc*2, ncol=nrc)
mylist <- rep(list(NULL), nrc)
names <- NULL
if(order[1] > 0) names <- paste('ar',1:order[1],sep='')
if(order[3] > 0) names <- c( names , paste('ma',1:order[3],sep='') )
if(seasonal$order[1] > 0) names <- c(names, paste('sar',1:seasonal$order[1],sep=''))
if(seasonal$order[3] > 0) names <- c(names, paste('sma',1:seasonal$order[3],sep=''))
arima.out <- arima(series, order=order, seasonal=seasonal, include.mean=include.mean, method='ML')
mylist[[1]] <- arima.out
last.arma <- armaGR(arima.out, names, length(series))
mystop <- FALSE
i <- 1
coeff[i,] <- last.arma[[1]][,1]
pval [i,] <- last.arma[[1]][,4]
i <- 2
aic <- arima.out$aic
while(!mystop){
mylist[[i]] <- arima.out
arima.out <- arima(series, order=order, seasonal=seasonal, include.mean=include.mean, method='ML', fixed=last.arma$next.vector)
aic <- c(aic, arima.out$aic)
last.arma <- armaGR(arima.out, names, length(series))
mystop <- !last.arma$continue
coeff[i,] <- last.arma[[1]][,1]
pval [i,] <- last.arma[[1]][,4]
i <- i+1
}
list(coeff, pval, mylist, aic=aic)
}
arimaSelectplot <- function(arimaSelect.out,noms,choix){
noms <- names(arimaSelect.out[[3]][[1]]$coef)
coeff <- arimaSelect.out[[1]]
k <- min(which(is.na(coeff[,1])))-1
coeff <- coeff[1:k,]
pval <- arimaSelect.out[[2]][1:k,]
aic <- arimaSelect.out$aic[1:k]
coeff[coeff==0] <- NA
n <- ncol(coeff)
if(missing(choix)) choix <- k
layout(matrix(c(1,1,1,2,
3,3,3,2,
3,3,3,4,
5,6,7,7),nr=4),
widths=c(10,35,45,15),
heights=c(30,30,15,15))
couleurs <- rainbow(75)[1:50]#(50)
ticks <- pretty(coeff)
par(mar=c(1,1,3,1))
plot(aic,k:1-.5,type='o',pch=21,bg='blue',cex=2,axes=F,lty=2,xpd=NA)
points(aic[choix],k-choix+.5,pch=21,cex=4,bg=2,xpd=NA)
title('aic',line=2)
par(mar=c(3,0,0,0))
plot(0,axes=F,xlab='',ylab='',xlim=range(ticks),ylim=c(.1,1))
rect(xleft = min(ticks) + (0:49)/50*(max(ticks)-min(ticks)),
xright = min(ticks) + (1:50)/50*(max(ticks)-min(ticks)),
ytop = rep(1,50),
ybottom= rep(0,50),col=couleurs,border=NA)
axis(1,ticks)
rect(xleft=min(ticks),xright=max(ticks),ytop=1,ybottom=0)
text(mean(coeff,na.rm=T),.5,'coefficients',cex=2,font=2)
par(mar=c(1,1,3,1))
image(1:n,1:k,t(coeff[k:1,]),axes=F,col=couleurs,zlim=range(ticks))
for(i in 1:n) for(j in 1:k) if(!is.na(coeff[j,i])) {
if(pval[j,i]<.01) symb = 'green'
else if( (pval[j,i]<.05) & (pval[j,i]>=.01)) symb = 'orange'
else if( (pval[j,i]<.1) & (pval[j,i]>=.05)) symb = 'red'
else symb = 'black'
polygon(c(i+.5 ,i+.2 ,i+.5 ,i+.5),
c(k-j+0.5,k-j+0.5,k-j+0.8,k-j+0.5),
col=symb)
if(j==choix) {
rect(xleft=i-.5,
xright=i+.5,
ybottom=k-j+1.5,
ytop=k-j+.5,
lwd=4)
text(i,
k-j+1,
round(coeff[j,i],2),
cex=1.2,
font=2)
}
else{
rect(xleft=i-.5,xright=i+.5,ybottom=k-j+1.5,ytop=k-j+.5)
text(i,k-j+1,round(coeff[j,i],2),cex=1.2,font=1)
}
}
axis(3,1:n,noms)
par(mar=c(0.5,0,0,0.5))
plot(0,axes=F,xlab='',ylab='',type='n',xlim=c(0,8),ylim=c(-.2,.8))
cols <- c('green','orange','red','black')
niv <- c('0','0.01','0.05','0.1')
for(i in 0:3){
polygon(c(1+2*i ,1+2*i ,1+2*i-.5 ,1+2*i),
c(.4 ,.7 , .4 , .4),
col=cols[i+1])
text(2*i,0.5,niv[i+1],cex=1.5)
}
text(8,.5,1,cex=1.5)
text(4,0,'p-value',cex=2)
box()
residus <- arimaSelect.out[[3]][[choix]]$res
par(mar=c(1,2,4,1))
acf(residus,main='')
title('acf',line=.5)
par(mar=c(1,2,4,1))
pacf(residus,main='')
title('pacf',line=.5)
par(mar=c(2,2,4,1))
qqnorm(residus,main='')
title('qq-norm',line=.5)
qqline(residus)
residus
}
if (par2 == 0) x <- log(x)
if (par2 != 0) x <- x^par2
(selection <- arimaSelect(x, order=c(par6,par3,par7), seasonal=list(order=c(par8,par4,par9), period=par5)))
bitmap(file='test1.png')
resid <- arimaSelectplot(selection)
dev.off()
resid
bitmap(file='test2.png')
acf(resid,length(resid)/2, main='Residual Autocorrelation Function')
dev.off()
bitmap(file='test3.png')
pacf(resid,length(resid)/2, main='Residual Partial Autocorrelation Function')
dev.off()
bitmap(file='test4.png')
cpgram(resid, main='Residual Cumulative Periodogram')
dev.off()
bitmap(file='test5.png')
hist(resid, main='Residual Histogram', xlab='values of Residuals')
dev.off()
bitmap(file='test6.png')
densityplot(~resid,col='black',main='Residual Density Plot', xlab='values of Residuals')
dev.off()
bitmap(file='test7.png')
qqnorm(resid, main='Residual Normal Q-Q Plot')
qqline(resid)
dev.off()
ncols <- length(selection[[1]][1,])
nrows <- length(selection[[2]][,1])-1
load(file='createtable')
a<-table.start()
a<-table.row.start(a)
a<-table.element(a,'ARIMA Parameter Estimation and Backward Selection', ncols+1,TRUE)
a<-table.row.end(a)
a<-table.row.start(a)
a<-table.element(a,'Iteration', header=TRUE)
for (i in 1:ncols) {
a<-table.element(a,names(selection[[3]][[1]]$coef)[i],header=TRUE)
}
a<-table.row.end(a)
for (j in 1:nrows) {
a<-table.row.start(a)
mydum <- 'Estimates ('
mydum <- paste(mydum,j)
mydum <- paste(mydum,')')
a<-table.element(a,mydum, header=TRUE)
for (i in 1:ncols) {
a<-table.element(a,round(selection[[1]][j,i],4))
}
a<-table.row.end(a)
a<-table.row.start(a)
a<-table.element(a,'(p-val)', header=TRUE)
for (i in 1:ncols) {
mydum <- '('
mydum <- paste(mydum,round(selection[[2]][j,i],4),sep='')
mydum <- paste(mydum,')')
a<-table.element(a,mydum)
}
a<-table.row.end(a)
}
a<-table.end(a)
table.save(a,file='mytable.tab')
a<-table.start()
a<-table.row.start(a)
a<-table.element(a,'Estimated ARIMA Residuals', 1,TRUE)
a<-table.row.end(a)
a<-table.row.start(a)
a<-table.element(a,'Value', 1,TRUE)
a<-table.row.end(a)
for (i in (par4*par5+par3):length(resid)) {
a<-table.row.start(a)
a<-table.element(a,resid[i])
a<-table.row.end(a)
}
a<-table.end(a)
table.save(a,file='mytable1.tab')