Free Statistics

of Irreproducible Research!

Author's title

Author*The author of this computation has been verified*
R Software Modulerwasp_autocorrelation.wasp
Title produced by software(Partial) Autocorrelation Function
Date of computationWed, 07 Dec 2016 19:18:29 +0100
Cite this page as followsStatistical Computations at FreeStatistics.org, Office for Research Development and Education, URL https://freestatistics.org/blog/index.php?v=date/2016/Dec/07/t1481134743yj04wqybbdizkxs.htm/, Retrieved Fri, 01 Nov 2024 03:45:18 +0000
Statistical Computations at FreeStatistics.org, Office for Research Development and Education, URL https://freestatistics.org/blog/index.php?pk=298279, Retrieved Fri, 01 Nov 2024 03:45:18 +0000
QR Codes:

Original text written by user:
IsPrivate?No (this computation is public)
User-defined keywords
Estimated Impact69
Family? (F = Feedback message, R = changed R code, M = changed R Module, P = changed Parameters, D = changed Data)
-       [(Partial) Autocorrelation Function] [N1316] [2016-12-07 18:18:29] [85f5800284aab30c091766186b093bb4] [Current]
Feedback Forum

Post a new message
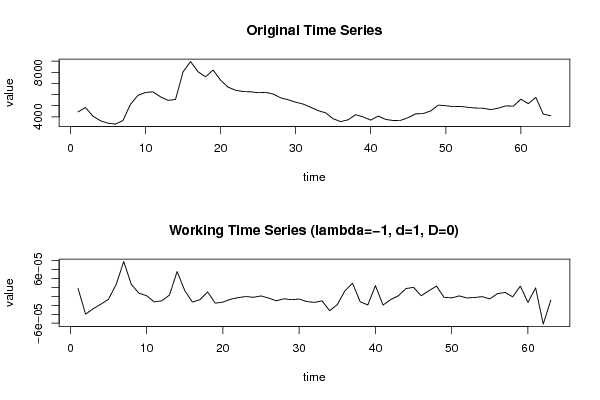
Dataseries X:
4440
4835
4055
3645
3425
3350
3670
5130
5930
6185
6240
5790
5475
5561.65
8031.65
8961.65
8045
7588.35
8200
7290
6661.65
6385
6268.35
6248.35
6165
6196.65
6050
5705
5530
5311.65
5145
4855
4556.65
4356.65
3823.35
3570
3735
4191.65
3990
3705
4065
3766.65
3666.65
3681.65
3931.65
4268.35
4291.65
4530
5053.35
4996.65
4913.35
4935
4848.35
4788.35
4771.65
4643.35
4778
4983.35
4953.35
5581.65
5185
5746.65
4240
4095


Summary of computational transaction
Raw Input view raw input (R code)
Raw Outputview raw output of R engine
Computing time1 seconds
R ServerBig Analytics Cloud Computing Center

\begin{tabular}{lllllllll}
\hline
Summary of computational transaction \tabularnewline
Raw Input view raw input (R code)  \tabularnewline
Raw Outputview raw output of R engine  \tabularnewline
Computing time1 seconds \tabularnewline
R ServerBig Analytics Cloud Computing Center \tabularnewline
\hline
\end{tabular}
%Source: https://freestatistics.org/blog/index.php?pk=298279&T=0

[TABLE]
[ROW]
Summary of computational transaction[/C][/ROW] [ROW]Raw Input[/C] view raw input (R code) [/C][/ROW] [ROW]Raw Output[/C]view raw output of R engine [/C][/ROW] [ROW]Computing time[/C]1 seconds[/C][/ROW] [ROW]R Server[/C]Big Analytics Cloud Computing Center[/C][/ROW] [/TABLE] Source: https://freestatistics.org/blog/index.php?pk=298279&T=0

Globally Unique Identifier (entire table): ba.freestatistics.org/blog/index.php?pk=298279&T=0

As an alternative you can also use a QR Code:  

The GUIDs for individual cells are displayed in the table below:

Summary of computational transaction
Raw Input view raw input (R code)
Raw Outputview raw output of R engine
Computing time1 seconds
R ServerBig Analytics Cloud Computing Center


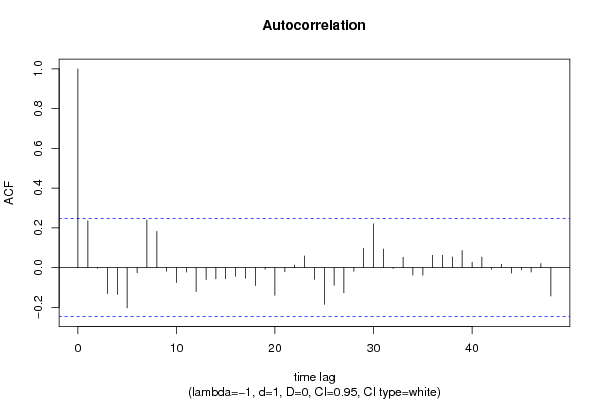
Autocorrelation Function
Time lag kACF(k)T-STATP-value
10.236291.87550.03268
2-0.003479-0.02760.489028
3-0.130889-1.03890.151411
4-0.134766-1.06970.144424
5-0.202881-1.61030.056164
6-0.025707-0.2040.419487
70.2388851.89610.031268
80.1815181.44080.077303
9-0.018612-0.14770.441514
10-0.075071-0.59590.276702
11-0.022527-0.17880.429333
12-0.120236-0.95430.171779
13-0.059736-0.47410.318521
14-0.055765-0.44260.329779
15-0.056054-0.44490.328953
16-0.04362-0.34620.365164
17-0.053402-0.42390.336554
18-0.089779-0.71260.239363
19-0.008281-0.06570.473903
20-0.139456-1.10690.136273
21-0.020647-0.16390.435176
220.0128980.10240.459391
230.0584060.46360.322271
24-0.058357-0.46320.322412
25-0.184908-1.46770.073585
26-0.08918-0.70780.240827
27-0.126883-1.00710.158869
28-0.018427-0.14630.442093
290.097750.77590.220366
300.2203061.74860.042614
310.0930470.73850.231466
32-0.003897-0.03090.48771
330.0517940.41110.341196
34-0.03753-0.29790.383386
35-0.037877-0.30060.38234
360.0615320.48840.313482
370.062460.49580.310893
380.0531930.42220.337155
390.0854290.67810.250105
400.026830.2130.416023
410.0527860.4190.33833
42-0.008286-0.06580.473886
430.0162020.12860.449041
44-0.027001-0.21430.415498
45-0.011259-0.08940.464538
46-0.022613-0.17950.429066
470.0199650.15850.437297
48-0.143429-1.13840.129626

\begin{tabular}{lllllllll}
\hline
Autocorrelation Function \tabularnewline
Time lag k & ACF(k) & T-STAT & P-value \tabularnewline
1 & 0.23629 & 1.8755 & 0.03268 \tabularnewline
2 & -0.003479 & -0.0276 & 0.489028 \tabularnewline
3 & -0.130889 & -1.0389 & 0.151411 \tabularnewline
4 & -0.134766 & -1.0697 & 0.144424 \tabularnewline
5 & -0.202881 & -1.6103 & 0.056164 \tabularnewline
6 & -0.025707 & -0.204 & 0.419487 \tabularnewline
7 & 0.238885 & 1.8961 & 0.031268 \tabularnewline
8 & 0.181518 & 1.4408 & 0.077303 \tabularnewline
9 & -0.018612 & -0.1477 & 0.441514 \tabularnewline
10 & -0.075071 & -0.5959 & 0.276702 \tabularnewline
11 & -0.022527 & -0.1788 & 0.429333 \tabularnewline
12 & -0.120236 & -0.9543 & 0.171779 \tabularnewline
13 & -0.059736 & -0.4741 & 0.318521 \tabularnewline
14 & -0.055765 & -0.4426 & 0.329779 \tabularnewline
15 & -0.056054 & -0.4449 & 0.328953 \tabularnewline
16 & -0.04362 & -0.3462 & 0.365164 \tabularnewline
17 & -0.053402 & -0.4239 & 0.336554 \tabularnewline
18 & -0.089779 & -0.7126 & 0.239363 \tabularnewline
19 & -0.008281 & -0.0657 & 0.473903 \tabularnewline
20 & -0.139456 & -1.1069 & 0.136273 \tabularnewline
21 & -0.020647 & -0.1639 & 0.435176 \tabularnewline
22 & 0.012898 & 0.1024 & 0.459391 \tabularnewline
23 & 0.058406 & 0.4636 & 0.322271 \tabularnewline
24 & -0.058357 & -0.4632 & 0.322412 \tabularnewline
25 & -0.184908 & -1.4677 & 0.073585 \tabularnewline
26 & -0.08918 & -0.7078 & 0.240827 \tabularnewline
27 & -0.126883 & -1.0071 & 0.158869 \tabularnewline
28 & -0.018427 & -0.1463 & 0.442093 \tabularnewline
29 & 0.09775 & 0.7759 & 0.220366 \tabularnewline
30 & 0.220306 & 1.7486 & 0.042614 \tabularnewline
31 & 0.093047 & 0.7385 & 0.231466 \tabularnewline
32 & -0.003897 & -0.0309 & 0.48771 \tabularnewline
33 & 0.051794 & 0.4111 & 0.341196 \tabularnewline
34 & -0.03753 & -0.2979 & 0.383386 \tabularnewline
35 & -0.037877 & -0.3006 & 0.38234 \tabularnewline
36 & 0.061532 & 0.4884 & 0.313482 \tabularnewline
37 & 0.06246 & 0.4958 & 0.310893 \tabularnewline
38 & 0.053193 & 0.4222 & 0.337155 \tabularnewline
39 & 0.085429 & 0.6781 & 0.250105 \tabularnewline
40 & 0.02683 & 0.213 & 0.416023 \tabularnewline
41 & 0.052786 & 0.419 & 0.33833 \tabularnewline
42 & -0.008286 & -0.0658 & 0.473886 \tabularnewline
43 & 0.016202 & 0.1286 & 0.449041 \tabularnewline
44 & -0.027001 & -0.2143 & 0.415498 \tabularnewline
45 & -0.011259 & -0.0894 & 0.464538 \tabularnewline
46 & -0.022613 & -0.1795 & 0.429066 \tabularnewline
47 & 0.019965 & 0.1585 & 0.437297 \tabularnewline
48 & -0.143429 & -1.1384 & 0.129626 \tabularnewline
\hline
\end{tabular}
%Source: https://freestatistics.org/blog/index.php?pk=298279&T=1

[TABLE]
[ROW][C]Autocorrelation Function[/C][/ROW]
[ROW][C]Time lag k[/C][C]ACF(k)[/C][C]T-STAT[/C][C]P-value[/C][/ROW]
[ROW][C]1[/C][C]0.23629[/C][C]1.8755[/C][C]0.03268[/C][/ROW]
[ROW][C]2[/C][C]-0.003479[/C][C]-0.0276[/C][C]0.489028[/C][/ROW]
[ROW][C]3[/C][C]-0.130889[/C][C]-1.0389[/C][C]0.151411[/C][/ROW]
[ROW][C]4[/C][C]-0.134766[/C][C]-1.0697[/C][C]0.144424[/C][/ROW]
[ROW][C]5[/C][C]-0.202881[/C][C]-1.6103[/C][C]0.056164[/C][/ROW]
[ROW][C]6[/C][C]-0.025707[/C][C]-0.204[/C][C]0.419487[/C][/ROW]
[ROW][C]7[/C][C]0.238885[/C][C]1.8961[/C][C]0.031268[/C][/ROW]
[ROW][C]8[/C][C]0.181518[/C][C]1.4408[/C][C]0.077303[/C][/ROW]
[ROW][C]9[/C][C]-0.018612[/C][C]-0.1477[/C][C]0.441514[/C][/ROW]
[ROW][C]10[/C][C]-0.075071[/C][C]-0.5959[/C][C]0.276702[/C][/ROW]
[ROW][C]11[/C][C]-0.022527[/C][C]-0.1788[/C][C]0.429333[/C][/ROW]
[ROW][C]12[/C][C]-0.120236[/C][C]-0.9543[/C][C]0.171779[/C][/ROW]
[ROW][C]13[/C][C]-0.059736[/C][C]-0.4741[/C][C]0.318521[/C][/ROW]
[ROW][C]14[/C][C]-0.055765[/C][C]-0.4426[/C][C]0.329779[/C][/ROW]
[ROW][C]15[/C][C]-0.056054[/C][C]-0.4449[/C][C]0.328953[/C][/ROW]
[ROW][C]16[/C][C]-0.04362[/C][C]-0.3462[/C][C]0.365164[/C][/ROW]
[ROW][C]17[/C][C]-0.053402[/C][C]-0.4239[/C][C]0.336554[/C][/ROW]
[ROW][C]18[/C][C]-0.089779[/C][C]-0.7126[/C][C]0.239363[/C][/ROW]
[ROW][C]19[/C][C]-0.008281[/C][C]-0.0657[/C][C]0.473903[/C][/ROW]
[ROW][C]20[/C][C]-0.139456[/C][C]-1.1069[/C][C]0.136273[/C][/ROW]
[ROW][C]21[/C][C]-0.020647[/C][C]-0.1639[/C][C]0.435176[/C][/ROW]
[ROW][C]22[/C][C]0.012898[/C][C]0.1024[/C][C]0.459391[/C][/ROW]
[ROW][C]23[/C][C]0.058406[/C][C]0.4636[/C][C]0.322271[/C][/ROW]
[ROW][C]24[/C][C]-0.058357[/C][C]-0.4632[/C][C]0.322412[/C][/ROW]
[ROW][C]25[/C][C]-0.184908[/C][C]-1.4677[/C][C]0.073585[/C][/ROW]
[ROW][C]26[/C][C]-0.08918[/C][C]-0.7078[/C][C]0.240827[/C][/ROW]
[ROW][C]27[/C][C]-0.126883[/C][C]-1.0071[/C][C]0.158869[/C][/ROW]
[ROW][C]28[/C][C]-0.018427[/C][C]-0.1463[/C][C]0.442093[/C][/ROW]
[ROW][C]29[/C][C]0.09775[/C][C]0.7759[/C][C]0.220366[/C][/ROW]
[ROW][C]30[/C][C]0.220306[/C][C]1.7486[/C][C]0.042614[/C][/ROW]
[ROW][C]31[/C][C]0.093047[/C][C]0.7385[/C][C]0.231466[/C][/ROW]
[ROW][C]32[/C][C]-0.003897[/C][C]-0.0309[/C][C]0.48771[/C][/ROW]
[ROW][C]33[/C][C]0.051794[/C][C]0.4111[/C][C]0.341196[/C][/ROW]
[ROW][C]34[/C][C]-0.03753[/C][C]-0.2979[/C][C]0.383386[/C][/ROW]
[ROW][C]35[/C][C]-0.037877[/C][C]-0.3006[/C][C]0.38234[/C][/ROW]
[ROW][C]36[/C][C]0.061532[/C][C]0.4884[/C][C]0.313482[/C][/ROW]
[ROW][C]37[/C][C]0.06246[/C][C]0.4958[/C][C]0.310893[/C][/ROW]
[ROW][C]38[/C][C]0.053193[/C][C]0.4222[/C][C]0.337155[/C][/ROW]
[ROW][C]39[/C][C]0.085429[/C][C]0.6781[/C][C]0.250105[/C][/ROW]
[ROW][C]40[/C][C]0.02683[/C][C]0.213[/C][C]0.416023[/C][/ROW]
[ROW][C]41[/C][C]0.052786[/C][C]0.419[/C][C]0.33833[/C][/ROW]
[ROW][C]42[/C][C]-0.008286[/C][C]-0.0658[/C][C]0.473886[/C][/ROW]
[ROW][C]43[/C][C]0.016202[/C][C]0.1286[/C][C]0.449041[/C][/ROW]
[ROW][C]44[/C][C]-0.027001[/C][C]-0.2143[/C][C]0.415498[/C][/ROW]
[ROW][C]45[/C][C]-0.011259[/C][C]-0.0894[/C][C]0.464538[/C][/ROW]
[ROW][C]46[/C][C]-0.022613[/C][C]-0.1795[/C][C]0.429066[/C][/ROW]
[ROW][C]47[/C][C]0.019965[/C][C]0.1585[/C][C]0.437297[/C][/ROW]
[ROW][C]48[/C][C]-0.143429[/C][C]-1.1384[/C][C]0.129626[/C][/ROW]
[/TABLE]
Source: https://freestatistics.org/blog/index.php?pk=298279&T=1

Globally Unique Identifier (entire table): ba.freestatistics.org/blog/index.php?pk=298279&T=1

As an alternative you can also use a QR Code:  

The GUIDs for individual cells are displayed in the table below:

Autocorrelation Function
Time lag kACF(k)T-STATP-value
10.236291.87550.03268
2-0.003479-0.02760.489028
3-0.130889-1.03890.151411
4-0.134766-1.06970.144424
5-0.202881-1.61030.056164
6-0.025707-0.2040.419487
70.2388851.89610.031268
80.1815181.44080.077303
9-0.018612-0.14770.441514
10-0.075071-0.59590.276702
11-0.022527-0.17880.429333
12-0.120236-0.95430.171779
13-0.059736-0.47410.318521
14-0.055765-0.44260.329779
15-0.056054-0.44490.328953
16-0.04362-0.34620.365164
17-0.053402-0.42390.336554
18-0.089779-0.71260.239363
19-0.008281-0.06570.473903
20-0.139456-1.10690.136273
21-0.020647-0.16390.435176
220.0128980.10240.459391
230.0584060.46360.322271
24-0.058357-0.46320.322412
25-0.184908-1.46770.073585
26-0.08918-0.70780.240827
27-0.126883-1.00710.158869
28-0.018427-0.14630.442093
290.097750.77590.220366
300.2203061.74860.042614
310.0930470.73850.231466
32-0.003897-0.03090.48771
330.0517940.41110.341196
34-0.03753-0.29790.383386
35-0.037877-0.30060.38234
360.0615320.48840.313482
370.062460.49580.310893
380.0531930.42220.337155
390.0854290.67810.250105
400.026830.2130.416023
410.0527860.4190.33833
42-0.008286-0.06580.473886
430.0162020.12860.449041
44-0.027001-0.21430.415498
45-0.011259-0.08940.464538
46-0.022613-0.17950.429066
470.0199650.15850.437297
48-0.143429-1.13840.129626


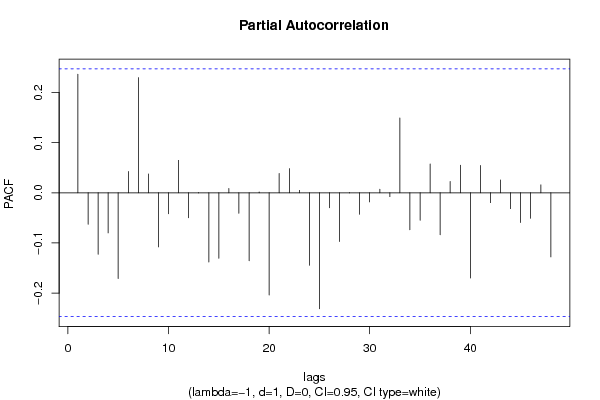
Partial Autocorrelation Function
Time lag kPACF(k)T-STATP-value
10.236291.87550.03268
2-0.06282-0.49860.309893
3-0.122465-0.9720.167374
4-0.079967-0.63470.263954
5-0.170998-1.35730.089772
60.0424060.33660.368772
70.2296471.82280.036542
80.03750.29760.383476
9-0.107876-0.85620.197556
10-0.041828-0.3320.370495
110.0647460.51390.304558
12-0.049849-0.39570.346845
13-0.000312-0.00250.499016
14-0.138136-1.09640.138535
15-0.130468-1.03560.152184
160.0085440.06780.473075
17-0.040899-0.32460.37327
18-0.135483-1.07540.143157
190.0015350.01220.495159
20-0.203765-1.61730.055401
210.038550.3060.380313
220.0482040.38260.35165
230.0048890.03880.484585
24-0.144568-1.14750.127763
25-0.231086-1.83420.035675
26-0.029939-0.23760.406468
27-0.096981-0.76980.222158
28-0.000281-0.00220.499112
29-0.042647-0.33850.368056
30-0.018126-0.14390.44303
310.0070290.05580.477841
32-0.007593-0.06030.476068
330.1491461.18380.120468
34-0.073722-0.58520.280268
35-0.054713-0.43430.332788
360.0574460.4560.324992
37-0.083671-0.66410.254519
380.0224740.17840.429499
390.055050.43690.331821
40-0.170047-1.34970.090971
410.0543990.43180.33369
42-0.019678-0.15620.438191
430.0255820.2030.419875
44-0.031619-0.2510.401328
45-0.059357-0.47110.319587
46-0.050681-0.40230.344425
470.0158080.12550.450275
48-0.127749-1.0140.157236

\begin{tabular}{lllllllll}
\hline
Partial Autocorrelation Function \tabularnewline
Time lag k & PACF(k) & T-STAT & P-value \tabularnewline
1 & 0.23629 & 1.8755 & 0.03268 \tabularnewline
2 & -0.06282 & -0.4986 & 0.309893 \tabularnewline
3 & -0.122465 & -0.972 & 0.167374 \tabularnewline
4 & -0.079967 & -0.6347 & 0.263954 \tabularnewline
5 & -0.170998 & -1.3573 & 0.089772 \tabularnewline
6 & 0.042406 & 0.3366 & 0.368772 \tabularnewline
7 & 0.229647 & 1.8228 & 0.036542 \tabularnewline
8 & 0.0375 & 0.2976 & 0.383476 \tabularnewline
9 & -0.107876 & -0.8562 & 0.197556 \tabularnewline
10 & -0.041828 & -0.332 & 0.370495 \tabularnewline
11 & 0.064746 & 0.5139 & 0.304558 \tabularnewline
12 & -0.049849 & -0.3957 & 0.346845 \tabularnewline
13 & -0.000312 & -0.0025 & 0.499016 \tabularnewline
14 & -0.138136 & -1.0964 & 0.138535 \tabularnewline
15 & -0.130468 & -1.0356 & 0.152184 \tabularnewline
16 & 0.008544 & 0.0678 & 0.473075 \tabularnewline
17 & -0.040899 & -0.3246 & 0.37327 \tabularnewline
18 & -0.135483 & -1.0754 & 0.143157 \tabularnewline
19 & 0.001535 & 0.0122 & 0.495159 \tabularnewline
20 & -0.203765 & -1.6173 & 0.055401 \tabularnewline
21 & 0.03855 & 0.306 & 0.380313 \tabularnewline
22 & 0.048204 & 0.3826 & 0.35165 \tabularnewline
23 & 0.004889 & 0.0388 & 0.484585 \tabularnewline
24 & -0.144568 & -1.1475 & 0.127763 \tabularnewline
25 & -0.231086 & -1.8342 & 0.035675 \tabularnewline
26 & -0.029939 & -0.2376 & 0.406468 \tabularnewline
27 & -0.096981 & -0.7698 & 0.222158 \tabularnewline
28 & -0.000281 & -0.0022 & 0.499112 \tabularnewline
29 & -0.042647 & -0.3385 & 0.368056 \tabularnewline
30 & -0.018126 & -0.1439 & 0.44303 \tabularnewline
31 & 0.007029 & 0.0558 & 0.477841 \tabularnewline
32 & -0.007593 & -0.0603 & 0.476068 \tabularnewline
33 & 0.149146 & 1.1838 & 0.120468 \tabularnewline
34 & -0.073722 & -0.5852 & 0.280268 \tabularnewline
35 & -0.054713 & -0.4343 & 0.332788 \tabularnewline
36 & 0.057446 & 0.456 & 0.324992 \tabularnewline
37 & -0.083671 & -0.6641 & 0.254519 \tabularnewline
38 & 0.022474 & 0.1784 & 0.429499 \tabularnewline
39 & 0.05505 & 0.4369 & 0.331821 \tabularnewline
40 & -0.170047 & -1.3497 & 0.090971 \tabularnewline
41 & 0.054399 & 0.4318 & 0.33369 \tabularnewline
42 & -0.019678 & -0.1562 & 0.438191 \tabularnewline
43 & 0.025582 & 0.203 & 0.419875 \tabularnewline
44 & -0.031619 & -0.251 & 0.401328 \tabularnewline
45 & -0.059357 & -0.4711 & 0.319587 \tabularnewline
46 & -0.050681 & -0.4023 & 0.344425 \tabularnewline
47 & 0.015808 & 0.1255 & 0.450275 \tabularnewline
48 & -0.127749 & -1.014 & 0.157236 \tabularnewline
\hline
\end{tabular}
%Source: https://freestatistics.org/blog/index.php?pk=298279&T=2

[TABLE]
[ROW][C]Partial Autocorrelation Function[/C][/ROW]
[ROW][C]Time lag k[/C][C]PACF(k)[/C][C]T-STAT[/C][C]P-value[/C][/ROW]
[ROW][C]1[/C][C]0.23629[/C][C]1.8755[/C][C]0.03268[/C][/ROW]
[ROW][C]2[/C][C]-0.06282[/C][C]-0.4986[/C][C]0.309893[/C][/ROW]
[ROW][C]3[/C][C]-0.122465[/C][C]-0.972[/C][C]0.167374[/C][/ROW]
[ROW][C]4[/C][C]-0.079967[/C][C]-0.6347[/C][C]0.263954[/C][/ROW]
[ROW][C]5[/C][C]-0.170998[/C][C]-1.3573[/C][C]0.089772[/C][/ROW]
[ROW][C]6[/C][C]0.042406[/C][C]0.3366[/C][C]0.368772[/C][/ROW]
[ROW][C]7[/C][C]0.229647[/C][C]1.8228[/C][C]0.036542[/C][/ROW]
[ROW][C]8[/C][C]0.0375[/C][C]0.2976[/C][C]0.383476[/C][/ROW]
[ROW][C]9[/C][C]-0.107876[/C][C]-0.8562[/C][C]0.197556[/C][/ROW]
[ROW][C]10[/C][C]-0.041828[/C][C]-0.332[/C][C]0.370495[/C][/ROW]
[ROW][C]11[/C][C]0.064746[/C][C]0.5139[/C][C]0.304558[/C][/ROW]
[ROW][C]12[/C][C]-0.049849[/C][C]-0.3957[/C][C]0.346845[/C][/ROW]
[ROW][C]13[/C][C]-0.000312[/C][C]-0.0025[/C][C]0.499016[/C][/ROW]
[ROW][C]14[/C][C]-0.138136[/C][C]-1.0964[/C][C]0.138535[/C][/ROW]
[ROW][C]15[/C][C]-0.130468[/C][C]-1.0356[/C][C]0.152184[/C][/ROW]
[ROW][C]16[/C][C]0.008544[/C][C]0.0678[/C][C]0.473075[/C][/ROW]
[ROW][C]17[/C][C]-0.040899[/C][C]-0.3246[/C][C]0.37327[/C][/ROW]
[ROW][C]18[/C][C]-0.135483[/C][C]-1.0754[/C][C]0.143157[/C][/ROW]
[ROW][C]19[/C][C]0.001535[/C][C]0.0122[/C][C]0.495159[/C][/ROW]
[ROW][C]20[/C][C]-0.203765[/C][C]-1.6173[/C][C]0.055401[/C][/ROW]
[ROW][C]21[/C][C]0.03855[/C][C]0.306[/C][C]0.380313[/C][/ROW]
[ROW][C]22[/C][C]0.048204[/C][C]0.3826[/C][C]0.35165[/C][/ROW]
[ROW][C]23[/C][C]0.004889[/C][C]0.0388[/C][C]0.484585[/C][/ROW]
[ROW][C]24[/C][C]-0.144568[/C][C]-1.1475[/C][C]0.127763[/C][/ROW]
[ROW][C]25[/C][C]-0.231086[/C][C]-1.8342[/C][C]0.035675[/C][/ROW]
[ROW][C]26[/C][C]-0.029939[/C][C]-0.2376[/C][C]0.406468[/C][/ROW]
[ROW][C]27[/C][C]-0.096981[/C][C]-0.7698[/C][C]0.222158[/C][/ROW]
[ROW][C]28[/C][C]-0.000281[/C][C]-0.0022[/C][C]0.499112[/C][/ROW]
[ROW][C]29[/C][C]-0.042647[/C][C]-0.3385[/C][C]0.368056[/C][/ROW]
[ROW][C]30[/C][C]-0.018126[/C][C]-0.1439[/C][C]0.44303[/C][/ROW]
[ROW][C]31[/C][C]0.007029[/C][C]0.0558[/C][C]0.477841[/C][/ROW]
[ROW][C]32[/C][C]-0.007593[/C][C]-0.0603[/C][C]0.476068[/C][/ROW]
[ROW][C]33[/C][C]0.149146[/C][C]1.1838[/C][C]0.120468[/C][/ROW]
[ROW][C]34[/C][C]-0.073722[/C][C]-0.5852[/C][C]0.280268[/C][/ROW]
[ROW][C]35[/C][C]-0.054713[/C][C]-0.4343[/C][C]0.332788[/C][/ROW]
[ROW][C]36[/C][C]0.057446[/C][C]0.456[/C][C]0.324992[/C][/ROW]
[ROW][C]37[/C][C]-0.083671[/C][C]-0.6641[/C][C]0.254519[/C][/ROW]
[ROW][C]38[/C][C]0.022474[/C][C]0.1784[/C][C]0.429499[/C][/ROW]
[ROW][C]39[/C][C]0.05505[/C][C]0.4369[/C][C]0.331821[/C][/ROW]
[ROW][C]40[/C][C]-0.170047[/C][C]-1.3497[/C][C]0.090971[/C][/ROW]
[ROW][C]41[/C][C]0.054399[/C][C]0.4318[/C][C]0.33369[/C][/ROW]
[ROW][C]42[/C][C]-0.019678[/C][C]-0.1562[/C][C]0.438191[/C][/ROW]
[ROW][C]43[/C][C]0.025582[/C][C]0.203[/C][C]0.419875[/C][/ROW]
[ROW][C]44[/C][C]-0.031619[/C][C]-0.251[/C][C]0.401328[/C][/ROW]
[ROW][C]45[/C][C]-0.059357[/C][C]-0.4711[/C][C]0.319587[/C][/ROW]
[ROW][C]46[/C][C]-0.050681[/C][C]-0.4023[/C][C]0.344425[/C][/ROW]
[ROW][C]47[/C][C]0.015808[/C][C]0.1255[/C][C]0.450275[/C][/ROW]
[ROW][C]48[/C][C]-0.127749[/C][C]-1.014[/C][C]0.157236[/C][/ROW]
[/TABLE]
Source: https://freestatistics.org/blog/index.php?pk=298279&T=2

Globally Unique Identifier (entire table): ba.freestatistics.org/blog/index.php?pk=298279&T=2

As an alternative you can also use a QR Code:  

The GUIDs for individual cells are displayed in the table below:

Partial Autocorrelation Function
Time lag kPACF(k)T-STATP-value
10.236291.87550.03268
2-0.06282-0.49860.309893
3-0.122465-0.9720.167374
4-0.079967-0.63470.263954
5-0.170998-1.35730.089772
60.0424060.33660.368772
70.2296471.82280.036542
80.03750.29760.383476
9-0.107876-0.85620.197556
10-0.041828-0.3320.370495
110.0647460.51390.304558
12-0.049849-0.39570.346845
13-0.000312-0.00250.499016
14-0.138136-1.09640.138535
15-0.130468-1.03560.152184
160.0085440.06780.473075
17-0.040899-0.32460.37327
18-0.135483-1.07540.143157
190.0015350.01220.495159
20-0.203765-1.61730.055401
210.038550.3060.380313
220.0482040.38260.35165
230.0048890.03880.484585
24-0.144568-1.14750.127763
25-0.231086-1.83420.035675
26-0.029939-0.23760.406468
27-0.096981-0.76980.222158
28-0.000281-0.00220.499112
29-0.042647-0.33850.368056
30-0.018126-0.14390.44303
310.0070290.05580.477841
32-0.007593-0.06030.476068
330.1491461.18380.120468
34-0.073722-0.58520.280268
35-0.054713-0.43430.332788
360.0574460.4560.324992
37-0.083671-0.66410.254519
380.0224740.17840.429499
390.055050.43690.331821
40-0.170047-1.34970.090971
410.0543990.43180.33369
42-0.019678-0.15620.438191
430.0255820.2030.419875
44-0.031619-0.2510.401328
45-0.059357-0.47110.319587
46-0.050681-0.40230.344425
470.0158080.12550.450275
48-0.127749-1.0140.157236


Parameters (Session):
par1 = -1.0 ; par2 = 1 ; par3 = 0 ; par4 = 1 ;
Parameters (R input):
par1 = 48 ; par2 = -1.0 ; par3 = 1 ; par4 = 0 ; par5 = 4 ; par6 = White Noise ; par7 = 0.95 ; par8 = ;
R code (references can be found in the software module):
par8 <- ''
par7 <- '0.95'
par6 <- 'White Noise'
par5 <- '12'
par4 <- '0'
par3 <- '1'
par2 <- '-1.0'
par1 <- '48'
if (par1 == 'Default') {
par1 = 10*log10(length(x))
} else {
par1 <- as.numeric(par1)
}
par2 <- as.numeric(par2)
par3 <- as.numeric(par3)
par4 <- as.numeric(par4)
par5 <- as.numeric(par5)
if (par6 == 'White Noise') par6 <- 'white' else par6 <- 'ma'
par7 <- as.numeric(par7)
if (par8 != '') par8 <- as.numeric(par8)
x <- na.omit(x)
ox <- x
if (par8 == '') {
if (par2 == 0) {
x <- log(x)
} else {
x <- (x ^ par2 - 1) / par2
}
} else {
x <- log(x,base=par8)
}
if (par3 > 0) x <- diff(x,lag=1,difference=par3)
if (par4 > 0) x <- diff(x,lag=par5,difference=par4)
bitmap(file='picts.png')
op <- par(mfrow=c(2,1))
plot(ox,type='l',main='Original Time Series',xlab='time',ylab='value')
if (par8=='') {
mytitle <- paste('Working Time Series (lambda=',par2,', d=',par3,', D=',par4,')',sep='')
mysub <- paste('(lambda=',par2,', d=',par3,', D=',par4,', CI=', par7, ', CI type=',par6,')',sep='')
} else {
mytitle <- paste('Working Time Series (base=',par8,', d=',par3,', D=',par4,')',sep='')
mysub <- paste('(base=',par8,', d=',par3,', D=',par4,', CI=', par7, ', CI type=',par6,')',sep='')
}
plot(x,type='l', main=mytitle,xlab='time',ylab='value')
par(op)
dev.off()
bitmap(file='pic1.png')
racf <- acf(x, par1, main='Autocorrelation', xlab='time lag', ylab='ACF', ci.type=par6, ci=par7, sub=mysub)
dev.off()
bitmap(file='pic2.png')
rpacf <- pacf(x,par1,main='Partial Autocorrelation',xlab='lags',ylab='PACF',sub=mysub)
dev.off()
(myacf <- c(racf$acf))
(mypacf <- c(rpacf$acf))
lengthx <- length(x)
sqrtn <- sqrt(lengthx)
load(file='createtable')
a<-table.start()
a<-table.row.start(a)
a<-table.element(a,'Autocorrelation Function',4,TRUE)
a<-table.row.end(a)
a<-table.row.start(a)
a<-table.element(a,'Time lag k',header=TRUE)
a<-table.element(a,'ACF(k)',header=TRUE)
a<-table.element(a,'T-STAT',header=TRUE)
a<-table.element(a,'P-value',header=TRUE)
a<-table.row.end(a)
for (i in 2:(par1+1)) {
a<-table.row.start(a)
a<-table.element(a,i-1,header=TRUE)
a<-table.element(a,round(myacf[i],6))
mytstat <- myacf[i]*sqrtn
a<-table.element(a,round(mytstat,4))
a<-table.element(a,round(1-pt(abs(mytstat),lengthx),6))
a<-table.row.end(a)
}
a<-table.end(a)
table.save(a,file='mytable.tab')
a<-table.start()
a<-table.row.start(a)
a<-table.element(a,'Partial Autocorrelation Function',4,TRUE)
a<-table.row.end(a)
a<-table.row.start(a)
a<-table.element(a,'Time lag k',header=TRUE)
a<-table.element(a,'PACF(k)',header=TRUE)
a<-table.element(a,'T-STAT',header=TRUE)
a<-table.element(a,'P-value',header=TRUE)
a<-table.row.end(a)
for (i in 1:par1) {
a<-table.row.start(a)
a<-table.element(a,i,header=TRUE)
a<-table.element(a,round(mypacf[i],6))
mytstat <- mypacf[i]*sqrtn
a<-table.element(a,round(mytstat,4))
a<-table.element(a,round(1-pt(abs(mytstat),lengthx),6))
a<-table.row.end(a)
}
a<-table.end(a)
table.save(a,file='mytable1.tab')