Free Statistics

of Irreproducible Research!

Author's title

Author*The author of this computation has been verified*
R Software Modulerwasp_exponentialsmoothing.wasp
Title produced by softwareExponential Smoothing
Date of computationWed, 07 Dec 2016 18:53:37 +0100
Cite this page as followsStatistical Computations at FreeStatistics.org, Office for Research Development and Education, URL https://freestatistics.org/blog/index.php?v=date/2016/Dec/07/t14811333459vguzvdg6n2m2rj.htm/, Retrieved Fri, 01 Nov 2024 03:36:24 +0000
Statistical Computations at FreeStatistics.org, Office for Research Development and Education, URL https://freestatistics.org/blog/index.php?pk=298268, Retrieved Fri, 01 Nov 2024 03:36:24 +0000
QR Codes:

Original text written by user:
IsPrivate?No (this computation is public)
User-defined keywords
Estimated Impact89
Family? (F = Feedback message, R = changed R code, M = changed R Module, P = changed Parameters, D = changed Data)
-       [Exponential Smoothing] [N1172] [2016-12-07 17:53:37] [40b26b3aac7c05a245868a452a1f2cfc] [Current]
Feedback Forum

Post a new message
Dataseries X:
3228
3480.8
3621.8
3667.6
3458.4
3594.2
3780.8
3807.8
3595.4
3798
3966
3985.4
3755.4
3972
4189.6
4142.8


Summary of computational transaction
Raw Input view raw input (R code)
Raw Outputview raw output of R engine
Computing time1 seconds
R ServerBig Analytics Cloud Computing Center

\begin{tabular}{lllllllll}
\hline
Summary of computational transaction \tabularnewline
Raw Input view raw input (R code)  \tabularnewline
Raw Outputview raw output of R engine  \tabularnewline
Computing time1 seconds \tabularnewline
R ServerBig Analytics Cloud Computing Center \tabularnewline
\hline
\end{tabular}
%Source: https://freestatistics.org/blog/index.php?pk=298268&T=0

[TABLE]
[ROW]
Summary of computational transaction[/C][/ROW] [ROW]Raw Input[/C] view raw input (R code) [/C][/ROW] [ROW]Raw Output[/C]view raw output of R engine [/C][/ROW] [ROW]Computing time[/C]1 seconds[/C][/ROW] [ROW]R Server[/C]Big Analytics Cloud Computing Center[/C][/ROW] [/TABLE] Source: https://freestatistics.org/blog/index.php?pk=298268&T=0

Globally Unique Identifier (entire table): ba.freestatistics.org/blog/index.php?pk=298268&T=0

As an alternative you can also use a QR Code:  

The GUIDs for individual cells are displayed in the table below:

Summary of computational transaction
Raw Input view raw input (R code)
Raw Outputview raw output of R engine
Computing time1 seconds
R ServerBig Analytics Cloud Computing Center


Estimated Parameters of Exponential Smoothing
ParameterValue
alpha0.233427486768638
beta0.221195458235927
gamma0.91713308348315

\begin{tabular}{lllllllll}
\hline
Estimated Parameters of Exponential Smoothing \tabularnewline
Parameter & Value \tabularnewline
alpha & 0.233427486768638 \tabularnewline
beta & 0.221195458235927 \tabularnewline
gamma & 0.91713308348315 \tabularnewline
\hline
\end{tabular}
%Source: https://freestatistics.org/blog/index.php?pk=298268&T=1

[TABLE]
[ROW][C]Estimated Parameters of Exponential Smoothing[/C][/ROW]
[ROW][C]Parameter[/C][C]Value[/C][/ROW]
[ROW][C]alpha[/C][C]0.233427486768638[/C][/ROW]
[ROW][C]beta[/C][C]0.221195458235927[/C][/ROW]
[ROW][C]gamma[/C][C]0.91713308348315[/C][/ROW]
[/TABLE]
Source: https://freestatistics.org/blog/index.php?pk=298268&T=1

Globally Unique Identifier (entire table): ba.freestatistics.org/blog/index.php?pk=298268&T=1

As an alternative you can also use a QR Code:  

The GUIDs for individual cells are displayed in the table below:

Estimated Parameters of Exponential Smoothing
ParameterValue
alpha0.233427486768638
beta0.221195458235927
gamma0.91713308348315


Interpolation Forecasts of Exponential Smoothing
tObservedFittedResiduals
53458.43384.8387573.5612499999993
63594.23541.9406630811352.2593369188735
73780.83740.3934356922440.4065643077652
83807.83798.965761553048.8342384469629
93595.43656.26654204386-60.866542043861
1037983769.111063120228.8889368797977
1139663954.6668143083511.3331856916507
123985.43983.645925682791.75407431720714
133755.43789.31556926274-33.9155692627392
1439723971.969884221090.0301157789081117
154189.64137.3727645857952.2272354142142
164142.84170.20069776893-27.4006977689323

\begin{tabular}{lllllllll}
\hline
Interpolation Forecasts of Exponential Smoothing \tabularnewline
t & Observed & Fitted & Residuals \tabularnewline
5 & 3458.4 & 3384.83875 & 73.5612499999993 \tabularnewline
6 & 3594.2 & 3541.94066308113 & 52.2593369188735 \tabularnewline
7 & 3780.8 & 3740.39343569224 & 40.4065643077652 \tabularnewline
8 & 3807.8 & 3798.96576155304 & 8.8342384469629 \tabularnewline
9 & 3595.4 & 3656.26654204386 & -60.866542043861 \tabularnewline
10 & 3798 & 3769.1110631202 & 28.8889368797977 \tabularnewline
11 & 3966 & 3954.66681430835 & 11.3331856916507 \tabularnewline
12 & 3985.4 & 3983.64592568279 & 1.75407431720714 \tabularnewline
13 & 3755.4 & 3789.31556926274 & -33.9155692627392 \tabularnewline
14 & 3972 & 3971.96988422109 & 0.0301157789081117 \tabularnewline
15 & 4189.6 & 4137.37276458579 & 52.2272354142142 \tabularnewline
16 & 4142.8 & 4170.20069776893 & -27.4006977689323 \tabularnewline
\hline
\end{tabular}
%Source: https://freestatistics.org/blog/index.php?pk=298268&T=2

[TABLE]
[ROW][C]Interpolation Forecasts of Exponential Smoothing[/C][/ROW]
[ROW][C]t[/C][C]Observed[/C][C]Fitted[/C][C]Residuals[/C][/ROW]
[ROW][C]5[/C][C]3458.4[/C][C]3384.83875[/C][C]73.5612499999993[/C][/ROW]
[ROW][C]6[/C][C]3594.2[/C][C]3541.94066308113[/C][C]52.2593369188735[/C][/ROW]
[ROW][C]7[/C][C]3780.8[/C][C]3740.39343569224[/C][C]40.4065643077652[/C][/ROW]
[ROW][C]8[/C][C]3807.8[/C][C]3798.96576155304[/C][C]8.8342384469629[/C][/ROW]
[ROW][C]9[/C][C]3595.4[/C][C]3656.26654204386[/C][C]-60.866542043861[/C][/ROW]
[ROW][C]10[/C][C]3798[/C][C]3769.1110631202[/C][C]28.8889368797977[/C][/ROW]
[ROW][C]11[/C][C]3966[/C][C]3954.66681430835[/C][C]11.3331856916507[/C][/ROW]
[ROW][C]12[/C][C]3985.4[/C][C]3983.64592568279[/C][C]1.75407431720714[/C][/ROW]
[ROW][C]13[/C][C]3755.4[/C][C]3789.31556926274[/C][C]-33.9155692627392[/C][/ROW]
[ROW][C]14[/C][C]3972[/C][C]3971.96988422109[/C][C]0.0301157789081117[/C][/ROW]
[ROW][C]15[/C][C]4189.6[/C][C]4137.37276458579[/C][C]52.2272354142142[/C][/ROW]
[ROW][C]16[/C][C]4142.8[/C][C]4170.20069776893[/C][C]-27.4006977689323[/C][/ROW]
[/TABLE]
Source: https://freestatistics.org/blog/index.php?pk=298268&T=2

Globally Unique Identifier (entire table): ba.freestatistics.org/blog/index.php?pk=298268&T=2

As an alternative you can also use a QR Code:  

The GUIDs for individual cells are displayed in the table below:

Interpolation Forecasts of Exponential Smoothing
tObservedFittedResiduals
53458.43384.8387573.5612499999993
63594.23541.9406630811352.2593369188735
73780.83740.3934356922440.4065643077652
83807.83798.965761553048.8342384469629
93595.43656.26654204386-60.866542043861
1037983769.111063120228.8889368797977
1139663954.6668143083511.3331856916507
123985.43983.645925682791.75407431720714
133755.43789.31556926274-33.9155692627392
1439723971.969884221090.0301157789081117
154189.64137.3727645857952.2272354142142
164142.84170.20069776893-27.4006977689323


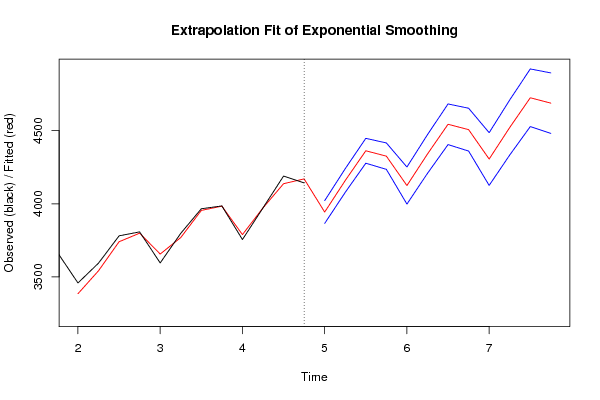
Extrapolation Forecasts of Exponential Smoothing
tForecast95% Lower Bound95% Upper Bound
173943.519568562163865.681815420764021.35732170356
184159.239616041734078.301094542594240.17813754087
194362.614471083484277.538762014824447.69018015214
204325.854009184174235.568259248794416.13975911955
214124.832989509053998.077148958654251.58883005946
224340.553036988634208.147543985774472.95852999148
234543.927892030384404.934695146284682.92108891448
244507.167430131074360.664766278424653.67009398372
254306.146410455954125.875676052184486.41714485972
264521.866457935524333.583615204584710.14930066646
274725.241312977274528.121395245464922.36123070908
284688.480851077964481.726548158264895.23515399767

\begin{tabular}{lllllllll}
\hline
Extrapolation Forecasts of Exponential Smoothing \tabularnewline
t & Forecast & 95% Lower Bound & 95% Upper Bound \tabularnewline
17 & 3943.51956856216 & 3865.68181542076 & 4021.35732170356 \tabularnewline
18 & 4159.23961604173 & 4078.30109454259 & 4240.17813754087 \tabularnewline
19 & 4362.61447108348 & 4277.53876201482 & 4447.69018015214 \tabularnewline
20 & 4325.85400918417 & 4235.56825924879 & 4416.13975911955 \tabularnewline
21 & 4124.83298950905 & 3998.07714895865 & 4251.58883005946 \tabularnewline
22 & 4340.55303698863 & 4208.14754398577 & 4472.95852999148 \tabularnewline
23 & 4543.92789203038 & 4404.93469514628 & 4682.92108891448 \tabularnewline
24 & 4507.16743013107 & 4360.66476627842 & 4653.67009398372 \tabularnewline
25 & 4306.14641045595 & 4125.87567605218 & 4486.41714485972 \tabularnewline
26 & 4521.86645793552 & 4333.58361520458 & 4710.14930066646 \tabularnewline
27 & 4725.24131297727 & 4528.12139524546 & 4922.36123070908 \tabularnewline
28 & 4688.48085107796 & 4481.72654815826 & 4895.23515399767 \tabularnewline
\hline
\end{tabular}
%Source: https://freestatistics.org/blog/index.php?pk=298268&T=3

[TABLE]
[ROW][C]Extrapolation Forecasts of Exponential Smoothing[/C][/ROW]
[ROW][C]t[/C][C]Forecast[/C][C]95% Lower Bound[/C][C]95% Upper Bound[/C][/ROW]
[ROW][C]17[/C][C]3943.51956856216[/C][C]3865.68181542076[/C][C]4021.35732170356[/C][/ROW]
[ROW][C]18[/C][C]4159.23961604173[/C][C]4078.30109454259[/C][C]4240.17813754087[/C][/ROW]
[ROW][C]19[/C][C]4362.61447108348[/C][C]4277.53876201482[/C][C]4447.69018015214[/C][/ROW]
[ROW][C]20[/C][C]4325.85400918417[/C][C]4235.56825924879[/C][C]4416.13975911955[/C][/ROW]
[ROW][C]21[/C][C]4124.83298950905[/C][C]3998.07714895865[/C][C]4251.58883005946[/C][/ROW]
[ROW][C]22[/C][C]4340.55303698863[/C][C]4208.14754398577[/C][C]4472.95852999148[/C][/ROW]
[ROW][C]23[/C][C]4543.92789203038[/C][C]4404.93469514628[/C][C]4682.92108891448[/C][/ROW]
[ROW][C]24[/C][C]4507.16743013107[/C][C]4360.66476627842[/C][C]4653.67009398372[/C][/ROW]
[ROW][C]25[/C][C]4306.14641045595[/C][C]4125.87567605218[/C][C]4486.41714485972[/C][/ROW]
[ROW][C]26[/C][C]4521.86645793552[/C][C]4333.58361520458[/C][C]4710.14930066646[/C][/ROW]
[ROW][C]27[/C][C]4725.24131297727[/C][C]4528.12139524546[/C][C]4922.36123070908[/C][/ROW]
[ROW][C]28[/C][C]4688.48085107796[/C][C]4481.72654815826[/C][C]4895.23515399767[/C][/ROW]
[/TABLE]
Source: https://freestatistics.org/blog/index.php?pk=298268&T=3

Globally Unique Identifier (entire table): ba.freestatistics.org/blog/index.php?pk=298268&T=3

As an alternative you can also use a QR Code:  

The GUIDs for individual cells are displayed in the table below:

Extrapolation Forecasts of Exponential Smoothing
tForecast95% Lower Bound95% Upper Bound
173943.519568562163865.681815420764021.35732170356
184159.239616041734078.301094542594240.17813754087
194362.614471083484277.538762014824447.69018015214
204325.854009184174235.568259248794416.13975911955
214124.832989509053998.077148958654251.58883005946
224340.553036988634208.147543985774472.95852999148
234543.927892030384404.934695146284682.92108891448
244507.167430131074360.664766278424653.67009398372
254306.146410455954125.875676052184486.41714485972
264521.866457935524333.583615204584710.14930066646
274725.241312977274528.121395245464922.36123070908
284688.480851077964481.726548158264895.23515399767


Parameters (Session):
par4 = 12 ;
Parameters (R input):
par1 = 4 ; par2 = Triple ; par3 = additive ; par4 = 12 ;
R code (references can be found in the software module):
par1 <- as.numeric(par1)
par4 <- as.numeric(par4)
if (par2 == 'Single') K <- 1
if (par2 == 'Double') K <- 2
if (par2 == 'Triple') K <- par1
nx <- length(x)
nxmK <- nx - K
x <- ts(x, frequency = par1)
if (par2 == 'Single') fit <- HoltWinters(x, gamma=F, beta=F)
if (par2 == 'Double') fit <- HoltWinters(x, gamma=F)
if (par2 == 'Triple') fit <- HoltWinters(x, seasonal=par3)
fit
myresid <- x - fit$fitted[,'xhat']
bitmap(file='test1.png')
op <- par(mfrow=c(2,1))
plot(fit,ylab='Observed (black) / Fitted (red)',main='Interpolation Fit of Exponential Smoothing')
plot(myresid,ylab='Residuals',main='Interpolation Prediction Errors')
par(op)
dev.off()
bitmap(file='test2.png')
p <- predict(fit, par4, prediction.interval=TRUE)
np <- length(p[,1])
plot(fit,p,ylab='Observed (black) / Fitted (red)',main='Extrapolation Fit of Exponential Smoothing')
dev.off()
bitmap(file='test3.png')
op <- par(mfrow = c(2,2))
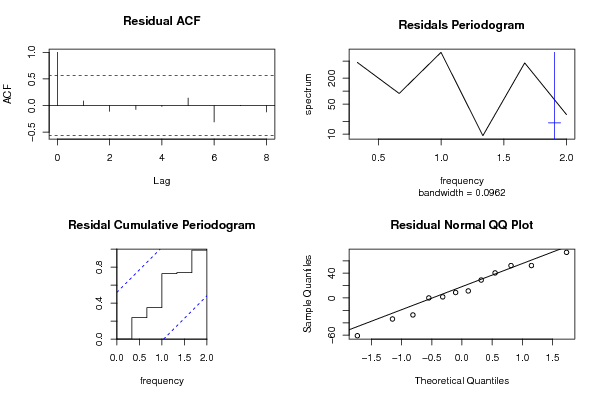
acf(as.numeric(myresid),lag.max = nx/2,main='Residual ACF')
spectrum(myresid,main='Residals Periodogram')
cpgram(myresid,main='Residal Cumulative Periodogram')
qqnorm(myresid,main='Residual Normal QQ Plot')
qqline(myresid)
par(op)
dev.off()
load(file='createtable')
a<-table.start()
a<-table.row.start(a)
a<-table.element(a,'Estimated Parameters of Exponential Smoothing',2,TRUE)
a<-table.row.end(a)
a<-table.row.start(a)
a<-table.element(a,'Parameter',header=TRUE)
a<-table.element(a,'Value',header=TRUE)
a<-table.row.end(a)
a<-table.row.start(a)
a<-table.element(a,'alpha',header=TRUE)
a<-table.element(a,fit$alpha)
a<-table.row.end(a)
a<-table.row.start(a)
a<-table.element(a,'beta',header=TRUE)
a<-table.element(a,fit$beta)
a<-table.row.end(a)
a<-table.row.start(a)
a<-table.element(a,'gamma',header=TRUE)
a<-table.element(a,fit$gamma)
a<-table.row.end(a)
a<-table.end(a)
table.save(a,file='mytable.tab')
a<-table.start()
a<-table.row.start(a)
a<-table.element(a,'Interpolation Forecasts of Exponential Smoothing',4,TRUE)
a<-table.row.end(a)
a<-table.row.start(a)
a<-table.element(a,'t',header=TRUE)
a<-table.element(a,'Observed',header=TRUE)
a<-table.element(a,'Fitted',header=TRUE)
a<-table.element(a,'Residuals',header=TRUE)
a<-table.row.end(a)
for (i in 1:nxmK) {
a<-table.row.start(a)
a<-table.element(a,i+K,header=TRUE)
a<-table.element(a,x[i+K])
a<-table.element(a,fit$fitted[i,'xhat'])
a<-table.element(a,myresid[i])
a<-table.row.end(a)
}
a<-table.end(a)
table.save(a,file='mytable1.tab')
a<-table.start()
a<-table.row.start(a)
a<-table.element(a,'Extrapolation Forecasts of Exponential Smoothing',4,TRUE)
a<-table.row.end(a)
a<-table.row.start(a)
a<-table.element(a,'t',header=TRUE)
a<-table.element(a,'Forecast',header=TRUE)
a<-table.element(a,'95% Lower Bound',header=TRUE)
a<-table.element(a,'95% Upper Bound',header=TRUE)
a<-table.row.end(a)
for (i in 1:np) {
a<-table.row.start(a)
a<-table.element(a,nx+i,header=TRUE)
a<-table.element(a,p[i,'fit'])
a<-table.element(a,p[i,'lwr'])
a<-table.element(a,p[i,'upr'])
a<-table.row.end(a)
}
a<-table.end(a)
table.save(a,file='mytable2.tab')