Free Statistics

of Irreproducible Research!

Author's title

Author*The author of this computation has been verified*
R Software Modulerwasp_autocorrelation.wasp
Title produced by software(Partial) Autocorrelation Function
Date of computationWed, 07 Dec 2016 16:51:28 +0100
Cite this page as followsStatistical Computations at FreeStatistics.org, Office for Research Development and Education, URL https://freestatistics.org/blog/index.php?v=date/2016/Dec/07/t1481126285k0jp17q521hql5n.htm/, Retrieved Fri, 01 Nov 2024 03:38:06 +0000
Statistical Computations at FreeStatistics.org, Office for Research Development and Education, URL https://freestatistics.org/blog/index.php?pk=298219, Retrieved Fri, 01 Nov 2024 03:38:06 +0000
QR Codes:

Original text written by user:
IsPrivate?No (this computation is public)
User-defined keywords
Estimated Impact96
Family? (F = Feedback message, R = changed R code, M = changed R Module, P = changed Parameters, D = changed Data)
-       [(Partial) Autocorrelation Function] [Autocorrelation F...] [2016-12-07 15:51:28] [153c3207812fd13fe5ceee3276565119] [Current]
Feedback Forum

Post a new message
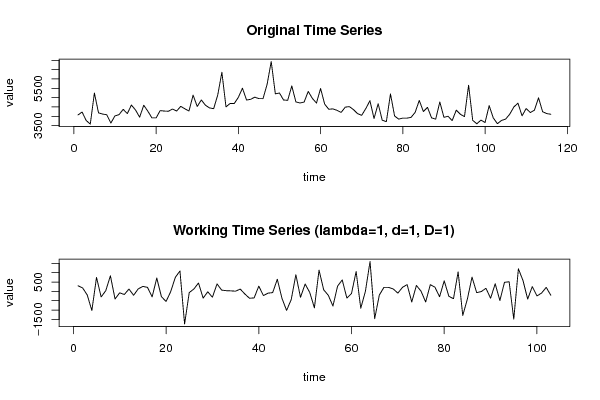
Dataseries X:
4070
4229.2
3775.2
3584.2
5248
4182.4
4119
4082.4
3639.8
4020.6
4089.6
4373.6
4143.2
4604
4336.4
3953.6
4591.6
4272.4
3911.2
3911.2
4306.2
4280.2
4270.6
4387.8
4282.8
4534
4400.6
4282.8
5135.8
4524
4875.6
4593.8
4447.8
4406.6
5148.2
6357.6
4503.2
4688.2
4682.2
5012.6
5505.4
4871.8
4909.6
5025.6
4946.8
4943.6
5712.4
6932.4
5201.8
5247
4873.6
4854.8
5626.4
4769.4
4713.2
4762.4
5333.2
4960.8
4708.8
5490
4650.4
4376
4397.2
4318.6
4207.4
4488.6
4520
4358.8
4142.4
4052.8
4413.4
4837.4
3882.6
4672
3790
3713.4
5199.2
4016.2
3849.2
3903.4
3901.2
3943.2
4209.8
4850.2
4256.6
4479.6
3914
3849.4
4768
3944
4002.2
3768
4330.8
4109
3983
5666.8
3783
3599
3796.8
3663.8
4572.8
3914.6
3604
3777.4
3848.6
4110.6
4500.6
4701.6
4026
4415.4
4200.8
4325.8
4991.8
4244.2
4146.2
4109.2


Summary of computational transaction
Raw Input view raw input (R code)
Raw Outputview raw output of R engine
Computing time1 seconds
R ServerBig Analytics Cloud Computing Center

\begin{tabular}{lllllllll}
\hline
Summary of computational transaction \tabularnewline
Raw Input view raw input (R code)  \tabularnewline
Raw Outputview raw output of R engine  \tabularnewline
Computing time1 seconds \tabularnewline
R ServerBig Analytics Cloud Computing Center \tabularnewline
\hline
\end{tabular}
%Source: https://freestatistics.org/blog/index.php?pk=298219&T=0

[TABLE]
[ROW]
Summary of computational transaction[/C][/ROW] [ROW]Raw Input[/C] view raw input (R code) [/C][/ROW] [ROW]Raw Output[/C]view raw output of R engine [/C][/ROW] [ROW]Computing time[/C]1 seconds[/C][/ROW] [ROW]R Server[/C]Big Analytics Cloud Computing Center[/C][/ROW] [/TABLE] Source: https://freestatistics.org/blog/index.php?pk=298219&T=0

Globally Unique Identifier (entire table): ba.freestatistics.org/blog/index.php?pk=298219&T=0

As an alternative you can also use a QR Code:  

The GUIDs for individual cells are displayed in the table below:

Summary of computational transaction
Raw Input view raw input (R code)
Raw Outputview raw output of R engine
Computing time1 seconds
R ServerBig Analytics Cloud Computing Center


Autocorrelation Function
Time lag kACF(k)T-STATP-value
1-0.354011-3.59280.000252
2-0.301315-3.0580.00142
30.2441442.47780.007423
4-0.108561-1.10180.136565
50.0588890.59770.27569
60.0317920.32270.373805
7-0.11575-1.17470.121406
80.1052411.06810.14399
9-0.096303-0.97740.165338
100.0849050.86170.19543
110.2214292.24730.013378
12-0.444811-4.51438e-06
130.1907931.93630.027783
140.101471.02980.152755
15-0.177988-1.80640.03689
160.0829610.8420.200881
170.0509870.51750.302973
18-0.158876-1.61240.054966
190.1812891.83990.034333
20-0.078195-0.79360.214628

\begin{tabular}{lllllllll}
\hline
Autocorrelation Function \tabularnewline
Time lag k & ACF(k) & T-STAT & P-value \tabularnewline
1 & -0.354011 & -3.5928 & 0.000252 \tabularnewline
2 & -0.301315 & -3.058 & 0.00142 \tabularnewline
3 & 0.244144 & 2.4778 & 0.007423 \tabularnewline
4 & -0.108561 & -1.1018 & 0.136565 \tabularnewline
5 & 0.058889 & 0.5977 & 0.27569 \tabularnewline
6 & 0.031792 & 0.3227 & 0.373805 \tabularnewline
7 & -0.11575 & -1.1747 & 0.121406 \tabularnewline
8 & 0.105241 & 1.0681 & 0.14399 \tabularnewline
9 & -0.096303 & -0.9774 & 0.165338 \tabularnewline
10 & 0.084905 & 0.8617 & 0.19543 \tabularnewline
11 & 0.221429 & 2.2473 & 0.013378 \tabularnewline
12 & -0.444811 & -4.5143 & 8e-06 \tabularnewline
13 & 0.190793 & 1.9363 & 0.027783 \tabularnewline
14 & 0.10147 & 1.0298 & 0.152755 \tabularnewline
15 & -0.177988 & -1.8064 & 0.03689 \tabularnewline
16 & 0.082961 & 0.842 & 0.200881 \tabularnewline
17 & 0.050987 & 0.5175 & 0.302973 \tabularnewline
18 & -0.158876 & -1.6124 & 0.054966 \tabularnewline
19 & 0.181289 & 1.8399 & 0.034333 \tabularnewline
20 & -0.078195 & -0.7936 & 0.214628 \tabularnewline
\hline
\end{tabular}
%Source: https://freestatistics.org/blog/index.php?pk=298219&T=1

[TABLE]
[ROW][C]Autocorrelation Function[/C][/ROW]
[ROW][C]Time lag k[/C][C]ACF(k)[/C][C]T-STAT[/C][C]P-value[/C][/ROW]
[ROW][C]1[/C][C]-0.354011[/C][C]-3.5928[/C][C]0.000252[/C][/ROW]
[ROW][C]2[/C][C]-0.301315[/C][C]-3.058[/C][C]0.00142[/C][/ROW]
[ROW][C]3[/C][C]0.244144[/C][C]2.4778[/C][C]0.007423[/C][/ROW]
[ROW][C]4[/C][C]-0.108561[/C][C]-1.1018[/C][C]0.136565[/C][/ROW]
[ROW][C]5[/C][C]0.058889[/C][C]0.5977[/C][C]0.27569[/C][/ROW]
[ROW][C]6[/C][C]0.031792[/C][C]0.3227[/C][C]0.373805[/C][/ROW]
[ROW][C]7[/C][C]-0.11575[/C][C]-1.1747[/C][C]0.121406[/C][/ROW]
[ROW][C]8[/C][C]0.105241[/C][C]1.0681[/C][C]0.14399[/C][/ROW]
[ROW][C]9[/C][C]-0.096303[/C][C]-0.9774[/C][C]0.165338[/C][/ROW]
[ROW][C]10[/C][C]0.084905[/C][C]0.8617[/C][C]0.19543[/C][/ROW]
[ROW][C]11[/C][C]0.221429[/C][C]2.2473[/C][C]0.013378[/C][/ROW]
[ROW][C]12[/C][C]-0.444811[/C][C]-4.5143[/C][C]8e-06[/C][/ROW]
[ROW][C]13[/C][C]0.190793[/C][C]1.9363[/C][C]0.027783[/C][/ROW]
[ROW][C]14[/C][C]0.10147[/C][C]1.0298[/C][C]0.152755[/C][/ROW]
[ROW][C]15[/C][C]-0.177988[/C][C]-1.8064[/C][C]0.03689[/C][/ROW]
[ROW][C]16[/C][C]0.082961[/C][C]0.842[/C][C]0.200881[/C][/ROW]
[ROW][C]17[/C][C]0.050987[/C][C]0.5175[/C][C]0.302973[/C][/ROW]
[ROW][C]18[/C][C]-0.158876[/C][C]-1.6124[/C][C]0.054966[/C][/ROW]
[ROW][C]19[/C][C]0.181289[/C][C]1.8399[/C][C]0.034333[/C][/ROW]
[ROW][C]20[/C][C]-0.078195[/C][C]-0.7936[/C][C]0.214628[/C][/ROW]
[/TABLE]
Source: https://freestatistics.org/blog/index.php?pk=298219&T=1

Globally Unique Identifier (entire table): ba.freestatistics.org/blog/index.php?pk=298219&T=1

As an alternative you can also use a QR Code:  

The GUIDs for individual cells are displayed in the table below:

Autocorrelation Function
Time lag kACF(k)T-STATP-value
1-0.354011-3.59280.000252
2-0.301315-3.0580.00142
30.2441442.47780.007423
4-0.108561-1.10180.136565
50.0588890.59770.27569
60.0317920.32270.373805
7-0.11575-1.17470.121406
80.1052411.06810.14399
9-0.096303-0.97740.165338
100.0849050.86170.19543
110.2214292.24730.013378
12-0.444811-4.51438e-06
130.1907931.93630.027783
140.101471.02980.152755
15-0.177988-1.80640.03689
160.0829610.8420.200881
170.0509870.51750.302973
18-0.158876-1.61240.054966
190.1812891.83990.034333
20-0.078195-0.79360.214628


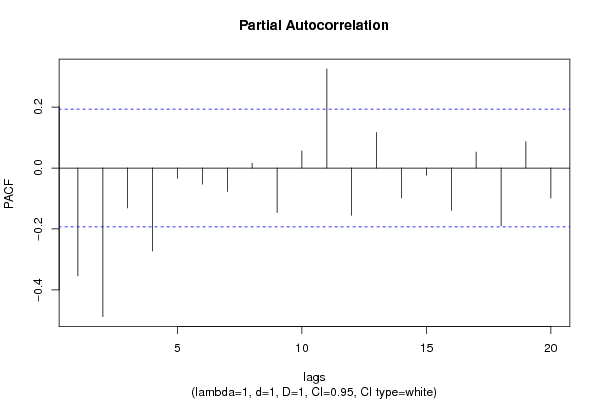
Partial Autocorrelation Function
Time lag kPACF(k)T-STATP-value
1-0.354011-3.59280.000252
2-0.487768-4.95031e-06
3-0.130863-1.32810.093539
4-0.272384-2.76440.003379
5-0.033761-0.34260.366285
6-0.052974-0.53760.295996
7-0.076936-0.78080.218351
80.0151310.15360.439127
9-0.146311-1.48490.070313
100.055990.56820.285554
110.3250093.29850.000668
12-0.155188-1.5750.059163
130.1167471.18480.119402
14-0.098031-0.99490.161056
15-0.0243-0.24660.402847
16-0.138629-1.40690.081229
170.0521270.5290.298962
18-0.189794-1.92620.028418
190.0865780.87870.190812
20-0.098608-1.00080.159644

\begin{tabular}{lllllllll}
\hline
Partial Autocorrelation Function \tabularnewline
Time lag k & PACF(k) & T-STAT & P-value \tabularnewline
1 & -0.354011 & -3.5928 & 0.000252 \tabularnewline
2 & -0.487768 & -4.9503 & 1e-06 \tabularnewline
3 & -0.130863 & -1.3281 & 0.093539 \tabularnewline
4 & -0.272384 & -2.7644 & 0.003379 \tabularnewline
5 & -0.033761 & -0.3426 & 0.366285 \tabularnewline
6 & -0.052974 & -0.5376 & 0.295996 \tabularnewline
7 & -0.076936 & -0.7808 & 0.218351 \tabularnewline
8 & 0.015131 & 0.1536 & 0.439127 \tabularnewline
9 & -0.146311 & -1.4849 & 0.070313 \tabularnewline
10 & 0.05599 & 0.5682 & 0.285554 \tabularnewline
11 & 0.325009 & 3.2985 & 0.000668 \tabularnewline
12 & -0.155188 & -1.575 & 0.059163 \tabularnewline
13 & 0.116747 & 1.1848 & 0.119402 \tabularnewline
14 & -0.098031 & -0.9949 & 0.161056 \tabularnewline
15 & -0.0243 & -0.2466 & 0.402847 \tabularnewline
16 & -0.138629 & -1.4069 & 0.081229 \tabularnewline
17 & 0.052127 & 0.529 & 0.298962 \tabularnewline
18 & -0.189794 & -1.9262 & 0.028418 \tabularnewline
19 & 0.086578 & 0.8787 & 0.190812 \tabularnewline
20 & -0.098608 & -1.0008 & 0.159644 \tabularnewline
\hline
\end{tabular}
%Source: https://freestatistics.org/blog/index.php?pk=298219&T=2

[TABLE]
[ROW][C]Partial Autocorrelation Function[/C][/ROW]
[ROW][C]Time lag k[/C][C]PACF(k)[/C][C]T-STAT[/C][C]P-value[/C][/ROW]
[ROW][C]1[/C][C]-0.354011[/C][C]-3.5928[/C][C]0.000252[/C][/ROW]
[ROW][C]2[/C][C]-0.487768[/C][C]-4.9503[/C][C]1e-06[/C][/ROW]
[ROW][C]3[/C][C]-0.130863[/C][C]-1.3281[/C][C]0.093539[/C][/ROW]
[ROW][C]4[/C][C]-0.272384[/C][C]-2.7644[/C][C]0.003379[/C][/ROW]
[ROW][C]5[/C][C]-0.033761[/C][C]-0.3426[/C][C]0.366285[/C][/ROW]
[ROW][C]6[/C][C]-0.052974[/C][C]-0.5376[/C][C]0.295996[/C][/ROW]
[ROW][C]7[/C][C]-0.076936[/C][C]-0.7808[/C][C]0.218351[/C][/ROW]
[ROW][C]8[/C][C]0.015131[/C][C]0.1536[/C][C]0.439127[/C][/ROW]
[ROW][C]9[/C][C]-0.146311[/C][C]-1.4849[/C][C]0.070313[/C][/ROW]
[ROW][C]10[/C][C]0.05599[/C][C]0.5682[/C][C]0.285554[/C][/ROW]
[ROW][C]11[/C][C]0.325009[/C][C]3.2985[/C][C]0.000668[/C][/ROW]
[ROW][C]12[/C][C]-0.155188[/C][C]-1.575[/C][C]0.059163[/C][/ROW]
[ROW][C]13[/C][C]0.116747[/C][C]1.1848[/C][C]0.119402[/C][/ROW]
[ROW][C]14[/C][C]-0.098031[/C][C]-0.9949[/C][C]0.161056[/C][/ROW]
[ROW][C]15[/C][C]-0.0243[/C][C]-0.2466[/C][C]0.402847[/C][/ROW]
[ROW][C]16[/C][C]-0.138629[/C][C]-1.4069[/C][C]0.081229[/C][/ROW]
[ROW][C]17[/C][C]0.052127[/C][C]0.529[/C][C]0.298962[/C][/ROW]
[ROW][C]18[/C][C]-0.189794[/C][C]-1.9262[/C][C]0.028418[/C][/ROW]
[ROW][C]19[/C][C]0.086578[/C][C]0.8787[/C][C]0.190812[/C][/ROW]
[ROW][C]20[/C][C]-0.098608[/C][C]-1.0008[/C][C]0.159644[/C][/ROW]
[/TABLE]
Source: https://freestatistics.org/blog/index.php?pk=298219&T=2

Globally Unique Identifier (entire table): ba.freestatistics.org/blog/index.php?pk=298219&T=2

As an alternative you can also use a QR Code:  

The GUIDs for individual cells are displayed in the table below:

Partial Autocorrelation Function
Time lag kPACF(k)T-STATP-value
1-0.354011-3.59280.000252
2-0.487768-4.95031e-06
3-0.130863-1.32810.093539
4-0.272384-2.76440.003379
5-0.033761-0.34260.366285
6-0.052974-0.53760.295996
7-0.076936-0.78080.218351
80.0151310.15360.439127
9-0.146311-1.48490.070313
100.055990.56820.285554
110.3250093.29850.000668
12-0.155188-1.5750.059163
130.1167471.18480.119402
14-0.098031-0.99490.161056
15-0.0243-0.24660.402847
16-0.138629-1.40690.081229
170.0521270.5290.298962
18-0.189794-1.92620.028418
190.0865780.87870.190812
20-0.098608-1.00080.159644


Parameters (Session):
Parameters (R input):
par1 = Default ; par2 = 1 ; par3 = 1 ; par4 = 1 ; par5 = 12 ; par6 = White Noise ; par7 = 0.95 ; par8 = ;
R code (references can be found in the software module):
par8 <- ''
par7 <- '0.95'
par6 <- 'White Noise'
par5 <- '12'
par4 <- '0'
par3 <- '0'
par2 <- '1'
par1 <- 'Default'
if (par1 == 'Default') {
par1 = 10*log10(length(x))
} else {
par1 <- as.numeric(par1)
}
par2 <- as.numeric(par2)
par3 <- as.numeric(par3)
par4 <- as.numeric(par4)
par5 <- as.numeric(par5)
if (par6 == 'White Noise') par6 <- 'white' else par6 <- 'ma'
par7 <- as.numeric(par7)
if (par8 != '') par8 <- as.numeric(par8)
x <- na.omit(x)
ox <- x
if (par8 == '') {
if (par2 == 0) {
x <- log(x)
} else {
x <- (x ^ par2 - 1) / par2
}
} else {
x <- log(x,base=par8)
}
if (par3 > 0) x <- diff(x,lag=1,difference=par3)
if (par4 > 0) x <- diff(x,lag=par5,difference=par4)
bitmap(file='picts.png')
op <- par(mfrow=c(2,1))
plot(ox,type='l',main='Original Time Series',xlab='time',ylab='value')
if (par8=='') {
mytitle <- paste('Working Time Series (lambda=',par2,', d=',par3,', D=',par4,')',sep='')
mysub <- paste('(lambda=',par2,', d=',par3,', D=',par4,', CI=', par7, ', CI type=',par6,')',sep='')
} else {
mytitle <- paste('Working Time Series (base=',par8,', d=',par3,', D=',par4,')',sep='')
mysub <- paste('(base=',par8,', d=',par3,', D=',par4,', CI=', par7, ', CI type=',par6,')',sep='')
}
plot(x,type='l', main=mytitle,xlab='time',ylab='value')
par(op)
dev.off()
bitmap(file='pic1.png')
racf <- acf(x, par1, main='Autocorrelation', xlab='time lag', ylab='ACF', ci.type=par6, ci=par7, sub=mysub)
dev.off()
bitmap(file='pic2.png')
rpacf <- pacf(x,par1,main='Partial Autocorrelation',xlab='lags',ylab='PACF',sub=mysub)
dev.off()
(myacf <- c(racf$acf))
(mypacf <- c(rpacf$acf))
lengthx <- length(x)
sqrtn <- sqrt(lengthx)
load(file='createtable')
a<-table.start()
a<-table.row.start(a)
a<-table.element(a,'Autocorrelation Function',4,TRUE)
a<-table.row.end(a)
a<-table.row.start(a)
a<-table.element(a,'Time lag k',header=TRUE)
a<-table.element(a,'ACF(k)',header=TRUE)
a<-table.element(a,'T-STAT',header=TRUE)
a<-table.element(a,'P-value',header=TRUE)
a<-table.row.end(a)
for (i in 2:(par1+1)) {
a<-table.row.start(a)
a<-table.element(a,i-1,header=TRUE)
a<-table.element(a,round(myacf[i],6))
mytstat <- myacf[i]*sqrtn
a<-table.element(a,round(mytstat,4))
a<-table.element(a,round(1-pt(abs(mytstat),lengthx),6))
a<-table.row.end(a)
}
a<-table.end(a)
table.save(a,file='mytable.tab')
a<-table.start()
a<-table.row.start(a)
a<-table.element(a,'Partial Autocorrelation Function',4,TRUE)
a<-table.row.end(a)
a<-table.row.start(a)
a<-table.element(a,'Time lag k',header=TRUE)
a<-table.element(a,'PACF(k)',header=TRUE)
a<-table.element(a,'T-STAT',header=TRUE)
a<-table.element(a,'P-value',header=TRUE)
a<-table.row.end(a)
for (i in 1:par1) {
a<-table.row.start(a)
a<-table.element(a,i,header=TRUE)
a<-table.element(a,round(mypacf[i],6))
mytstat <- mypacf[i]*sqrtn
a<-table.element(a,round(mytstat,4))
a<-table.element(a,round(1-pt(abs(mytstat),lengthx),6))
a<-table.row.end(a)
}
a<-table.end(a)
table.save(a,file='mytable1.tab')