Free Statistics

of Irreproducible Research!

Author's title

Author*The author of this computation has been verified*
R Software Modulerwasp_decompose.wasp
Title produced by softwareClassical Decomposition
Date of computationWed, 07 Dec 2016 14:24:32 +0100
Cite this page as followsStatistical Computations at FreeStatistics.org, Office for Research Development and Education, URL https://freestatistics.org/blog/index.php?v=date/2016/Dec/07/t1481117093vnto18kxgjvdign.htm/, Retrieved Fri, 01 Nov 2024 03:47:14 +0000
Statistical Computations at FreeStatistics.org, Office for Research Development and Education, URL https://freestatistics.org/blog/index.php?pk=298096, Retrieved Fri, 01 Nov 2024 03:47:14 +0000
QR Codes:

Original text written by user:
IsPrivate?No (this computation is public)
User-defined keywords
Estimated Impact94
Family? (F = Feedback message, R = changed R code, M = changed R Module, P = changed Parameters, D = changed Data)
-       [Classical Decomposition] [Paper N1268] [2016-12-07 13:24:32] [3146b6c9a81fba6ba78c11f749c05198] [Current]
Feedback Forum

Post a new message
Dataseries X:
3719.8
3646.4
3644.6
3713.2
3708.4
3689.6
3652
3590.2
3549.6
3580.6
3599.8
3647
3693.8
3755.6
3832.6
3917.4
4004
4086
4108.8
4179.2
4210.6
4276.6
4361.2
4452
4496.4
4581.6
4694
4749
4790
4837
4915
4929.8
5058
5150
5240
5318
5397.2
5474.6
5500.8
5552
5637.8
5622.8
5633.8
5567.8
5522


Summary of computational transaction
Raw Input view raw input (R code)
Raw Outputview raw output of R engine
Computing time1 seconds
R ServerBig Analytics Cloud Computing Center

\begin{tabular}{lllllllll}
\hline
Summary of computational transaction \tabularnewline
Raw Input view raw input (R code)  \tabularnewline
Raw Outputview raw output of R engine  \tabularnewline
Computing time1 seconds \tabularnewline
R ServerBig Analytics Cloud Computing Center \tabularnewline
\hline
\end{tabular}
%Source: https://freestatistics.org/blog/index.php?pk=298096&T=0

[TABLE]
[ROW]
Summary of computational transaction[/C][/ROW] [ROW]Raw Input[/C] view raw input (R code) [/C][/ROW] [ROW]Raw Output[/C]view raw output of R engine [/C][/ROW] [ROW]Computing time[/C]1 seconds[/C][/ROW] [ROW]R Server[/C]Big Analytics Cloud Computing Center[/C][/ROW] [/TABLE] Source: https://freestatistics.org/blog/index.php?pk=298096&T=0

Globally Unique Identifier (entire table): ba.freestatistics.org/blog/index.php?pk=298096&T=0

As an alternative you can also use a QR Code:  

The GUIDs for individual cells are displayed in the table below:

Summary of computational transaction
Raw Input view raw input (R code)
Raw Outputview raw output of R engine
Computing time1 seconds
R ServerBig Analytics Cloud Computing Center


Classical Decomposition by Moving Averages
tObservationsFitTrendSeasonalRandom
13719.8NANA-0.702662NA
23646.4NANA19.1057NA
33644.6NANA36.1112NA
43713.2NANA28.9432NA
53708.4NANA25.8765NA
63689.6NANA21.3932NA
736523650.993644.026.969561.01377
83590.23613.563647.48-33.9193-23.364
93549.63614.443659.87-45.4249-64.8418
103580.63642.463676.21-33.7443-61.864
113599.83675.553697.03-21.4804-75.7529
1236473722.743725.87-3.12766-75.739
133693.83760.713761.42-0.702662-66.914
143755.63824.13804.9919.1057-68.4973
153832.63893.193857.0736.1112-60.5862
163917.43942.563913.6228.9432-25.1598
1740044000.223974.3425.87653.78183
18408640614039.6121.393224.9985
194108.84113.564106.596.96956-4.76123
204179.24140.534174.45-33.919338.6693
214210.64199.334244.76-45.424911.2666
224276.64281.564315.3-33.7443-4.95567
234361.24361.224382.7-21.4804-0.0195602
2444524443.614446.74-3.127668.386
254496.44510.924511.62-0.702662-14.5223
264581.64595.64576.4919.1057-13.9973
2746944679.194643.0736.111214.8138
2847494743.724714.7728.94325.28183
2947904813.664787.7825.8765-23.6598
3048374881.884860.4821.3932-44.8765
3149154941.074934.16.96956-26.0696
324929.84974.925008.84-33.9193-45.1223
3350585034.245079.67-45.424923.7582
34515051135146.74-33.744337.0027
3552405194.045215.52-21.480445.9554
3653185280.465283.59-3.1276637.536
375397.25345.585346.28-0.70266251.6193
385474.65421.925402.8219.105752.6777
395500.85484.845448.7336.111215.9554
405552NANA28.9432NA
415637.8NANA25.8765NA
425622.8NANA21.3932NA
435633.8NANA6.96956NA
445567.8NANA-33.9193NA
455522NANA-45.4249NA

\begin{tabular}{lllllllll}
\hline
Classical Decomposition by Moving Averages \tabularnewline
t & Observations & Fit & Trend & Seasonal & Random \tabularnewline
1 & 3719.8 & NA & NA & -0.702662 & NA \tabularnewline
2 & 3646.4 & NA & NA & 19.1057 & NA \tabularnewline
3 & 3644.6 & NA & NA & 36.1112 & NA \tabularnewline
4 & 3713.2 & NA & NA & 28.9432 & NA \tabularnewline
5 & 3708.4 & NA & NA & 25.8765 & NA \tabularnewline
6 & 3689.6 & NA & NA & 21.3932 & NA \tabularnewline
7 & 3652 & 3650.99 & 3644.02 & 6.96956 & 1.01377 \tabularnewline
8 & 3590.2 & 3613.56 & 3647.48 & -33.9193 & -23.364 \tabularnewline
9 & 3549.6 & 3614.44 & 3659.87 & -45.4249 & -64.8418 \tabularnewline
10 & 3580.6 & 3642.46 & 3676.21 & -33.7443 & -61.864 \tabularnewline
11 & 3599.8 & 3675.55 & 3697.03 & -21.4804 & -75.7529 \tabularnewline
12 & 3647 & 3722.74 & 3725.87 & -3.12766 & -75.739 \tabularnewline
13 & 3693.8 & 3760.71 & 3761.42 & -0.702662 & -66.914 \tabularnewline
14 & 3755.6 & 3824.1 & 3804.99 & 19.1057 & -68.4973 \tabularnewline
15 & 3832.6 & 3893.19 & 3857.07 & 36.1112 & -60.5862 \tabularnewline
16 & 3917.4 & 3942.56 & 3913.62 & 28.9432 & -25.1598 \tabularnewline
17 & 4004 & 4000.22 & 3974.34 & 25.8765 & 3.78183 \tabularnewline
18 & 4086 & 4061 & 4039.61 & 21.3932 & 24.9985 \tabularnewline
19 & 4108.8 & 4113.56 & 4106.59 & 6.96956 & -4.76123 \tabularnewline
20 & 4179.2 & 4140.53 & 4174.45 & -33.9193 & 38.6693 \tabularnewline
21 & 4210.6 & 4199.33 & 4244.76 & -45.4249 & 11.2666 \tabularnewline
22 & 4276.6 & 4281.56 & 4315.3 & -33.7443 & -4.95567 \tabularnewline
23 & 4361.2 & 4361.22 & 4382.7 & -21.4804 & -0.0195602 \tabularnewline
24 & 4452 & 4443.61 & 4446.74 & -3.12766 & 8.386 \tabularnewline
25 & 4496.4 & 4510.92 & 4511.62 & -0.702662 & -14.5223 \tabularnewline
26 & 4581.6 & 4595.6 & 4576.49 & 19.1057 & -13.9973 \tabularnewline
27 & 4694 & 4679.19 & 4643.07 & 36.1112 & 14.8138 \tabularnewline
28 & 4749 & 4743.72 & 4714.77 & 28.9432 & 5.28183 \tabularnewline
29 & 4790 & 4813.66 & 4787.78 & 25.8765 & -23.6598 \tabularnewline
30 & 4837 & 4881.88 & 4860.48 & 21.3932 & -44.8765 \tabularnewline
31 & 4915 & 4941.07 & 4934.1 & 6.96956 & -26.0696 \tabularnewline
32 & 4929.8 & 4974.92 & 5008.84 & -33.9193 & -45.1223 \tabularnewline
33 & 5058 & 5034.24 & 5079.67 & -45.4249 & 23.7582 \tabularnewline
34 & 5150 & 5113 & 5146.74 & -33.7443 & 37.0027 \tabularnewline
35 & 5240 & 5194.04 & 5215.52 & -21.4804 & 45.9554 \tabularnewline
36 & 5318 & 5280.46 & 5283.59 & -3.12766 & 37.536 \tabularnewline
37 & 5397.2 & 5345.58 & 5346.28 & -0.702662 & 51.6193 \tabularnewline
38 & 5474.6 & 5421.92 & 5402.82 & 19.1057 & 52.6777 \tabularnewline
39 & 5500.8 & 5484.84 & 5448.73 & 36.1112 & 15.9554 \tabularnewline
40 & 5552 & NA & NA & 28.9432 & NA \tabularnewline
41 & 5637.8 & NA & NA & 25.8765 & NA \tabularnewline
42 & 5622.8 & NA & NA & 21.3932 & NA \tabularnewline
43 & 5633.8 & NA & NA & 6.96956 & NA \tabularnewline
44 & 5567.8 & NA & NA & -33.9193 & NA \tabularnewline
45 & 5522 & NA & NA & -45.4249 & NA \tabularnewline
\hline
\end{tabular}
%Source: https://freestatistics.org/blog/index.php?pk=298096&T=1

[TABLE]
[ROW][C]Classical Decomposition by Moving Averages[/C][/ROW]
[ROW][C]t[/C][C]Observations[/C][C]Fit[/C][C]Trend[/C][C]Seasonal[/C][C]Random[/C][/ROW]
[ROW][C]1[/C][C]3719.8[/C][C]NA[/C][C]NA[/C][C]-0.702662[/C][C]NA[/C][/ROW]
[ROW][C]2[/C][C]3646.4[/C][C]NA[/C][C]NA[/C][C]19.1057[/C][C]NA[/C][/ROW]
[ROW][C]3[/C][C]3644.6[/C][C]NA[/C][C]NA[/C][C]36.1112[/C][C]NA[/C][/ROW]
[ROW][C]4[/C][C]3713.2[/C][C]NA[/C][C]NA[/C][C]28.9432[/C][C]NA[/C][/ROW]
[ROW][C]5[/C][C]3708.4[/C][C]NA[/C][C]NA[/C][C]25.8765[/C][C]NA[/C][/ROW]
[ROW][C]6[/C][C]3689.6[/C][C]NA[/C][C]NA[/C][C]21.3932[/C][C]NA[/C][/ROW]
[ROW][C]7[/C][C]3652[/C][C]3650.99[/C][C]3644.02[/C][C]6.96956[/C][C]1.01377[/C][/ROW]
[ROW][C]8[/C][C]3590.2[/C][C]3613.56[/C][C]3647.48[/C][C]-33.9193[/C][C]-23.364[/C][/ROW]
[ROW][C]9[/C][C]3549.6[/C][C]3614.44[/C][C]3659.87[/C][C]-45.4249[/C][C]-64.8418[/C][/ROW]
[ROW][C]10[/C][C]3580.6[/C][C]3642.46[/C][C]3676.21[/C][C]-33.7443[/C][C]-61.864[/C][/ROW]
[ROW][C]11[/C][C]3599.8[/C][C]3675.55[/C][C]3697.03[/C][C]-21.4804[/C][C]-75.7529[/C][/ROW]
[ROW][C]12[/C][C]3647[/C][C]3722.74[/C][C]3725.87[/C][C]-3.12766[/C][C]-75.739[/C][/ROW]
[ROW][C]13[/C][C]3693.8[/C][C]3760.71[/C][C]3761.42[/C][C]-0.702662[/C][C]-66.914[/C][/ROW]
[ROW][C]14[/C][C]3755.6[/C][C]3824.1[/C][C]3804.99[/C][C]19.1057[/C][C]-68.4973[/C][/ROW]
[ROW][C]15[/C][C]3832.6[/C][C]3893.19[/C][C]3857.07[/C][C]36.1112[/C][C]-60.5862[/C][/ROW]
[ROW][C]16[/C][C]3917.4[/C][C]3942.56[/C][C]3913.62[/C][C]28.9432[/C][C]-25.1598[/C][/ROW]
[ROW][C]17[/C][C]4004[/C][C]4000.22[/C][C]3974.34[/C][C]25.8765[/C][C]3.78183[/C][/ROW]
[ROW][C]18[/C][C]4086[/C][C]4061[/C][C]4039.61[/C][C]21.3932[/C][C]24.9985[/C][/ROW]
[ROW][C]19[/C][C]4108.8[/C][C]4113.56[/C][C]4106.59[/C][C]6.96956[/C][C]-4.76123[/C][/ROW]
[ROW][C]20[/C][C]4179.2[/C][C]4140.53[/C][C]4174.45[/C][C]-33.9193[/C][C]38.6693[/C][/ROW]
[ROW][C]21[/C][C]4210.6[/C][C]4199.33[/C][C]4244.76[/C][C]-45.4249[/C][C]11.2666[/C][/ROW]
[ROW][C]22[/C][C]4276.6[/C][C]4281.56[/C][C]4315.3[/C][C]-33.7443[/C][C]-4.95567[/C][/ROW]
[ROW][C]23[/C][C]4361.2[/C][C]4361.22[/C][C]4382.7[/C][C]-21.4804[/C][C]-0.0195602[/C][/ROW]
[ROW][C]24[/C][C]4452[/C][C]4443.61[/C][C]4446.74[/C][C]-3.12766[/C][C]8.386[/C][/ROW]
[ROW][C]25[/C][C]4496.4[/C][C]4510.92[/C][C]4511.62[/C][C]-0.702662[/C][C]-14.5223[/C][/ROW]
[ROW][C]26[/C][C]4581.6[/C][C]4595.6[/C][C]4576.49[/C][C]19.1057[/C][C]-13.9973[/C][/ROW]
[ROW][C]27[/C][C]4694[/C][C]4679.19[/C][C]4643.07[/C][C]36.1112[/C][C]14.8138[/C][/ROW]
[ROW][C]28[/C][C]4749[/C][C]4743.72[/C][C]4714.77[/C][C]28.9432[/C][C]5.28183[/C][/ROW]
[ROW][C]29[/C][C]4790[/C][C]4813.66[/C][C]4787.78[/C][C]25.8765[/C][C]-23.6598[/C][/ROW]
[ROW][C]30[/C][C]4837[/C][C]4881.88[/C][C]4860.48[/C][C]21.3932[/C][C]-44.8765[/C][/ROW]
[ROW][C]31[/C][C]4915[/C][C]4941.07[/C][C]4934.1[/C][C]6.96956[/C][C]-26.0696[/C][/ROW]
[ROW][C]32[/C][C]4929.8[/C][C]4974.92[/C][C]5008.84[/C][C]-33.9193[/C][C]-45.1223[/C][/ROW]
[ROW][C]33[/C][C]5058[/C][C]5034.24[/C][C]5079.67[/C][C]-45.4249[/C][C]23.7582[/C][/ROW]
[ROW][C]34[/C][C]5150[/C][C]5113[/C][C]5146.74[/C][C]-33.7443[/C][C]37.0027[/C][/ROW]
[ROW][C]35[/C][C]5240[/C][C]5194.04[/C][C]5215.52[/C][C]-21.4804[/C][C]45.9554[/C][/ROW]
[ROW][C]36[/C][C]5318[/C][C]5280.46[/C][C]5283.59[/C][C]-3.12766[/C][C]37.536[/C][/ROW]
[ROW][C]37[/C][C]5397.2[/C][C]5345.58[/C][C]5346.28[/C][C]-0.702662[/C][C]51.6193[/C][/ROW]
[ROW][C]38[/C][C]5474.6[/C][C]5421.92[/C][C]5402.82[/C][C]19.1057[/C][C]52.6777[/C][/ROW]
[ROW][C]39[/C][C]5500.8[/C][C]5484.84[/C][C]5448.73[/C][C]36.1112[/C][C]15.9554[/C][/ROW]
[ROW][C]40[/C][C]5552[/C][C]NA[/C][C]NA[/C][C]28.9432[/C][C]NA[/C][/ROW]
[ROW][C]41[/C][C]5637.8[/C][C]NA[/C][C]NA[/C][C]25.8765[/C][C]NA[/C][/ROW]
[ROW][C]42[/C][C]5622.8[/C][C]NA[/C][C]NA[/C][C]21.3932[/C][C]NA[/C][/ROW]
[ROW][C]43[/C][C]5633.8[/C][C]NA[/C][C]NA[/C][C]6.96956[/C][C]NA[/C][/ROW]
[ROW][C]44[/C][C]5567.8[/C][C]NA[/C][C]NA[/C][C]-33.9193[/C][C]NA[/C][/ROW]
[ROW][C]45[/C][C]5522[/C][C]NA[/C][C]NA[/C][C]-45.4249[/C][C]NA[/C][/ROW]
[/TABLE]
Source: https://freestatistics.org/blog/index.php?pk=298096&T=1

Globally Unique Identifier (entire table): ba.freestatistics.org/blog/index.php?pk=298096&T=1

As an alternative you can also use a QR Code:  

The GUIDs for individual cells are displayed in the table below:

Classical Decomposition by Moving Averages
tObservationsFitTrendSeasonalRandom
13719.8NANA-0.702662NA
23646.4NANA19.1057NA
33644.6NANA36.1112NA
43713.2NANA28.9432NA
53708.4NANA25.8765NA
63689.6NANA21.3932NA
736523650.993644.026.969561.01377
83590.23613.563647.48-33.9193-23.364
93549.63614.443659.87-45.4249-64.8418
103580.63642.463676.21-33.7443-61.864
113599.83675.553697.03-21.4804-75.7529
1236473722.743725.87-3.12766-75.739
133693.83760.713761.42-0.702662-66.914
143755.63824.13804.9919.1057-68.4973
153832.63893.193857.0736.1112-60.5862
163917.43942.563913.6228.9432-25.1598
1740044000.223974.3425.87653.78183
18408640614039.6121.393224.9985
194108.84113.564106.596.96956-4.76123
204179.24140.534174.45-33.919338.6693
214210.64199.334244.76-45.424911.2666
224276.64281.564315.3-33.7443-4.95567
234361.24361.224382.7-21.4804-0.0195602
2444524443.614446.74-3.127668.386
254496.44510.924511.62-0.702662-14.5223
264581.64595.64576.4919.1057-13.9973
2746944679.194643.0736.111214.8138
2847494743.724714.7728.94325.28183
2947904813.664787.7825.8765-23.6598
3048374881.884860.4821.3932-44.8765
3149154941.074934.16.96956-26.0696
324929.84974.925008.84-33.9193-45.1223
3350585034.245079.67-45.424923.7582
34515051135146.74-33.744337.0027
3552405194.045215.52-21.480445.9554
3653185280.465283.59-3.1276637.536
375397.25345.585346.28-0.70266251.6193
385474.65421.925402.8219.105752.6777
395500.85484.845448.7336.111215.9554
405552NANA28.9432NA
415637.8NANA25.8765NA
425622.8NANA21.3932NA
435633.8NANA6.96956NA
445567.8NANA-33.9193NA
455522NANA-45.4249NA


Parameters (Session):
par1 = additive ; par2 = 12 ;
Parameters (R input):
par1 = additive ; par2 = 12 ;
R code (references can be found in the software module):
par2 <- as.numeric(par2)
x <- ts(x,freq=par2)
m <- decompose(x,type=par1)
m$figure
bitmap(file='test1.png')
plot(m)
dev.off()
mylagmax <- length(x)/2
bitmap(file='test2.png')
op <- par(mfrow = c(2,2))
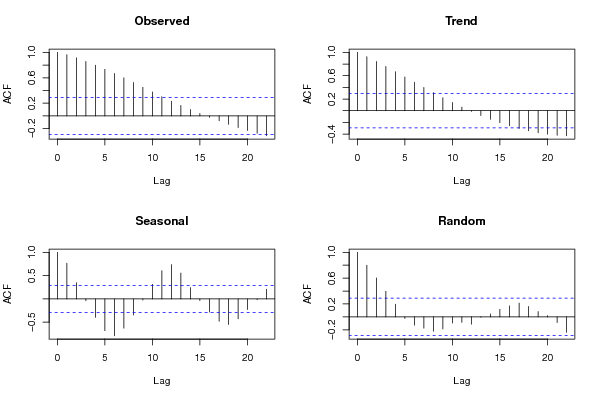
acf(as.numeric(x),lag.max = mylagmax,main='Observed')
acf(as.numeric(m$trend),na.action=na.pass,lag.max = mylagmax,main='Trend')
acf(as.numeric(m$seasonal),na.action=na.pass,lag.max = mylagmax,main='Seasonal')
acf(as.numeric(m$random),na.action=na.pass,lag.max = mylagmax,main='Random')
par(op)
dev.off()
bitmap(file='test3.png')
op <- par(mfrow = c(2,2))
spectrum(as.numeric(x),main='Observed')
spectrum(as.numeric(m$trend[!is.na(m$trend)]),main='Trend')
spectrum(as.numeric(m$seasonal[!is.na(m$seasonal)]),main='Seasonal')
spectrum(as.numeric(m$random[!is.na(m$random)]),main='Random')
par(op)
dev.off()
bitmap(file='test4.png')
op <- par(mfrow = c(2,2))
cpgram(as.numeric(x),main='Observed')
cpgram(as.numeric(m$trend[!is.na(m$trend)]),main='Trend')
cpgram(as.numeric(m$seasonal[!is.na(m$seasonal)]),main='Seasonal')
cpgram(as.numeric(m$random[!is.na(m$random)]),main='Random')
par(op)
dev.off()
load(file='createtable')
a<-table.start()
a<-table.row.start(a)
a<-table.element(a,'Classical Decomposition by Moving Averages',6,TRUE)
a<-table.row.end(a)
a<-table.row.start(a)
a<-table.element(a,'t',header=TRUE)
a<-table.element(a,'Observations',header=TRUE)
a<-table.element(a,'Fit',header=TRUE)
a<-table.element(a,'Trend',header=TRUE)
a<-table.element(a,'Seasonal',header=TRUE)
a<-table.element(a,'Random',header=TRUE)
a<-table.row.end(a)
for (i in 1:length(m$trend)) {
a<-table.row.start(a)
a<-table.element(a,i,header=TRUE)
a<-table.element(a,x[i])
if (par1 == 'additive') a<-table.element(a,signif(m$trend[i]+m$seasonal[i],6)) else a<-table.element(a,signif(m$trend[i]*m$seasonal[i],6))
a<-table.element(a,signif(m$trend[i],6))
a<-table.element(a,signif(m$seasonal[i],6))
a<-table.element(a,signif(m$random[i],6))
a<-table.row.end(a)
}
a<-table.end(a)
table.save(a,file='mytable.tab')