Free Statistics

of Irreproducible Research!

Author's title

Author*The author of this computation has been verified*
R Software Modulerwasp_multipleregression.wasp
Title produced by softwareMultiple Regression
Date of computationMon, 05 Dec 2016 16:06:09 +0100
Cite this page as followsStatistical Computations at FreeStatistics.org, Office for Research Development and Education, URL https://freestatistics.org/blog/index.php?v=date/2016/Dec/05/t14809508519emdlnx8q1n89nh.htm/, Retrieved Fri, 01 Nov 2024 03:39:23 +0000
Statistical Computations at FreeStatistics.org, Office for Research Development and Education, URL https://freestatistics.org/blog/index.php?pk=297739, Retrieved Fri, 01 Nov 2024 03:39:23 +0000
QR Codes:

Original text written by user:
IsPrivate?No (this computation is public)
User-defined keywords
Estimated Impact172
Family? (F = Feedback message, R = changed R code, M = changed R Module, P = changed Parameters, D = changed Data)
-       [Multiple Regression] [] [2016-12-05 15:06:09] [df90c754990be6fd2b18fcd529010a59] [Current]
Feedback Forum

Post a new message
Dataseries X:
14	4	3	3	3
19	5	4	4	3
17	4	5	5	3
17	NA	4	4	3
15	NA	4	4	4
20	5	3	5	3
15	5	3	5	NA
19	NA	4	5	3
15	NA	4	5	4
15	5	4	5	3
19	5	4	5	3
NA	4	4	4	3
20	4	4	4	4
18	4	3	4	3
15	4	4	4	4
14	5	4	5	3
20	NA	4	4	4
NA	NA	NA	NA	NA
16	3	4	4	NA
16	NA	4	5	4
16	5	4	4	3
10	NA	4	4	3
19	5	4	4	3
19	NA	4	4	3
16	NA	4	5	4
15	NA	3	5	3
18	4	4	4	4
17	4	4	4	3
19	4	4	5	3
17	4	4	5	3
NA	3	4	3	3
19	4	3	5	3
20	5	4	4	4
5	NA	4	5	2
19	4	2	4	3
16	5	4	5	3
15	NA	4	4	3
16	3	3	4	4
18	2	4	4	4
16	5	4	5	4
15	NA	4	4	3
17	5	4	5	3
NA	4	3	3	3
20	4	4	5	3
19	4	4	4	3
7	3	4	5	3
13	NA	4	5	3
16	4	4	4	3
16	3	4	3	3
NA	NA	3	NA	NA
18	5	4	5	3
18	NA	5	5	3
16	NA	5	4	4
17	2	3	3	3
19	3	4	4	3
16	2	4	4	3
19	NA	4	4	3
13	5	5	4	3
16	4	4	4	4
13	NA	4	4	3
12	5	4	5	3
17	5	4	4	3
17	4	5	4	3
17	5	4	4	3
16	4	4	4	3
16	4	2	4	2
14	5	4	5	3
16	3	4	4	3
13	2	4	4	4
16	5	4	4	3
14	NA	4	4	3
20	NA	4	4	3
12	NA	4	3	3
13	NA	3	4	3
18	NA	5	4	4
14	4	4	4	3
19	5	3	5	3
18	3	4	4	3
14	2	4	4	5
18	5	4	5	3
19	NA	4	5	3
15	1	3	3	3
14	NA	4	5	3
17	5	4	4	4
19	NA	4	5	4
13	5	5	5	5
19	4	4	5	4
18	5	4	5	4
20	NA	4	4	3
15	5	4	4	4
15	5	4	2	3
15	NA	4	4	3
20	4	5	5	3
15	NA	4	5	3
19	4	5	5	3
18	NA	4	4	3
18	4	4	4	4
15	4	5	4	5
20	5	4	5	4
17	5	4	4	3
12	NA	4	NA	NA
18	NA	4	5	4
19	4	4	4	3
20	2	4	4	3
NA	NA	4	4	3
17	NA	4	5	4
15	NA	4	4	4
16	NA	4	5	3
18	NA	4	4	3
18	4	4	4	4
14	NA	4	4	4
15	NA	4	3	3
12	NA	4	4	3
17	3	3	3	3
14	5	4	5	NA
18	4	4	4	4
17	5	4	4	3
17	NA	4	5	4
20	5	4	4	3
16	3	4	4	3
14	4	4	4	3
15	3	4	4	3
18	NA	4	4	4
20	4	4	4	3
17	NA	4	5	4
17	4	4	4	3
17	5	4	4	3
17	NA	4	5	3
15	NA	4	4	3
17	NA	4	4	3
18	2	3	3	3
17	4	4	4	NA
20	4	5	4	5
15	NA	3	4	3
16	2	3	3	3
15	NA	4	4	NA
18	4	4	5	5
11	NA	NA	3	NA
15	4	4	4	3
18	5	5	5	4
20	4	5	5	3
19	NA	3	4	3
14	3	4	4	3
16	4	4	4	NA
15	3	4	3	3
17	4	5	5	3
18	2	4	4	4
20	5	5	5	4
17	4	3	4	3
18	NA	4	4	4
15	NA	3	3	3
16	4	4	4	4
11	5	4	4	3
15	4	4	4	3
18	2	4	3	3
17	NA	4	4	3
16	5	4	5	3
12	NA	4	3	3
19	NA	4	4	3
18	5	4	5	4
15	4	4	4	3
17	5	5	5	3
19	3	4	4	4
18	NA	4	4	3
19	4	NA	4	4
16	NA	3	4	3
16	4	4	4	4
16	NA	4	3	3
14	3	4	4	5


Summary of computational transaction
Raw Input view raw input (R code)
Raw Outputview raw output of R engine
Computing time7 seconds
R ServerBig Analytics Cloud Computing Center

\begin{tabular}{lllllllll}
\hline
Summary of computational transaction \tabularnewline
Raw Input view raw input (R code)  \tabularnewline
Raw Outputview raw output of R engine  \tabularnewline
Computing time7 seconds \tabularnewline
R ServerBig Analytics Cloud Computing Center \tabularnewline
\hline
\end{tabular}
%Source: https://freestatistics.org/blog/index.php?pk=297739&T=0

[TABLE]
[ROW]
Summary of computational transaction[/C][/ROW] [ROW]Raw Input[/C] view raw input (R code) [/C][/ROW] [ROW]Raw Output[/C]view raw output of R engine [/C][/ROW] [ROW]Computing time[/C]7 seconds[/C][/ROW] [ROW]R Server[/C]Big Analytics Cloud Computing Center[/C][/ROW] [/TABLE] Source: https://freestatistics.org/blog/index.php?pk=297739&T=0

Globally Unique Identifier (entire table): ba.freestatistics.org/blog/index.php?pk=297739&T=0

As an alternative you can also use a QR Code:  

The GUIDs for individual cells are displayed in the table below:

Summary of computational transaction
Raw Input view raw input (R code)
Raw Outputview raw output of R engine
Computing time7 seconds
R ServerBig Analytics Cloud Computing Center


Multiple Linear Regression - Estimated Regression Equation
ITHSUM[t] = + 14.928 + 0.0932036Retour[t] -0.257259Kwaliteit[t] + 0.510287Tevredenheid[t] + 0.117075Verwachtingen[t] + e[t]

\begin{tabular}{lllllllll}
\hline
Multiple Linear Regression - Estimated Regression Equation \tabularnewline
ITHSUM[t] =  +  14.928 +  0.0932036Retour[t] -0.257259Kwaliteit[t] +  0.510287Tevredenheid[t] +  0.117075Verwachtingen[t]  + e[t] \tabularnewline
 \tabularnewline
\hline
\end{tabular}
%Source: https://freestatistics.org/blog/index.php?pk=297739&T=1

[TABLE]
[ROW][C]Multiple Linear Regression - Estimated Regression Equation[/C][/ROW]
[ROW][C]ITHSUM[t] =  +  14.928 +  0.0932036Retour[t] -0.257259Kwaliteit[t] +  0.510287Tevredenheid[t] +  0.117075Verwachtingen[t]  + e[t][/C][/ROW]
[ROW][C][/C][/ROW]
[/TABLE]
Source: https://freestatistics.org/blog/index.php?pk=297739&T=1

Globally Unique Identifier (entire table): ba.freestatistics.org/blog/index.php?pk=297739&T=1

As an alternative you can also use a QR Code:  

The GUIDs for individual cells are displayed in the table below:

Multiple Linear Regression - Estimated Regression Equation
ITHSUM[t] = + 14.928 + 0.0932036Retour[t] -0.257259Kwaliteit[t] + 0.510287Tevredenheid[t] + 0.117075Verwachtingen[t] + e[t]


Multiple Linear Regression - Ordinary Least Squares
VariableParameterS.D.T-STATH0: parameter = 02-tail p-value1-tail p-value
(Intercept)+14.93 2.104+7.0930e+00 2.324e-10 1.162e-10
Retour+0.0932 0.2706+3.4450e-01 0.7313 0.3656
Kwaliteit-0.2573 0.4478-5.7450e-01 0.567 0.2835
Tevredenheid+0.5103 0.4305+1.1850e+00 0.2388 0.1194
Verwachtingen+0.1171 0.4002+2.9250e-01 0.7705 0.3853

\begin{tabular}{lllllllll}
\hline
Multiple Linear Regression - Ordinary Least Squares \tabularnewline
Variable & Parameter & S.D. & T-STATH0: parameter = 0 & 2-tail p-value & 1-tail p-value \tabularnewline
(Intercept) & +14.93 &  2.104 & +7.0930e+00 &  2.324e-10 &  1.162e-10 \tabularnewline
Retour & +0.0932 &  0.2706 & +3.4450e-01 &  0.7313 &  0.3656 \tabularnewline
Kwaliteit & -0.2573 &  0.4478 & -5.7450e-01 &  0.567 &  0.2835 \tabularnewline
Tevredenheid & +0.5103 &  0.4305 & +1.1850e+00 &  0.2388 &  0.1194 \tabularnewline
Verwachtingen & +0.1171 &  0.4002 & +2.9250e-01 &  0.7705 &  0.3853 \tabularnewline
\hline
\end{tabular}
%Source: https://freestatistics.org/blog/index.php?pk=297739&T=2

[TABLE]
[ROW][C]Multiple Linear Regression - Ordinary Least Squares[/C][/ROW]
[ROW][C]Variable[/C][C]Parameter[/C][C]S.D.[/C][C]T-STATH0: parameter = 0[/C][C]2-tail p-value[/C][C]1-tail p-value[/C][/ROW]
[ROW][C](Intercept)[/C][C]+14.93[/C][C] 2.104[/C][C]+7.0930e+00[/C][C] 2.324e-10[/C][C] 1.162e-10[/C][/ROW]
[ROW][C]Retour[/C][C]+0.0932[/C][C] 0.2706[/C][C]+3.4450e-01[/C][C] 0.7313[/C][C] 0.3656[/C][/ROW]
[ROW][C]Kwaliteit[/C][C]-0.2573[/C][C] 0.4478[/C][C]-5.7450e-01[/C][C] 0.567[/C][C] 0.2835[/C][/ROW]
[ROW][C]Tevredenheid[/C][C]+0.5103[/C][C] 0.4305[/C][C]+1.1850e+00[/C][C] 0.2388[/C][C] 0.1194[/C][/ROW]
[ROW][C]Verwachtingen[/C][C]+0.1171[/C][C] 0.4002[/C][C]+2.9250e-01[/C][C] 0.7705[/C][C] 0.3853[/C][/ROW]
[/TABLE]
Source: https://freestatistics.org/blog/index.php?pk=297739&T=2

Globally Unique Identifier (entire table): ba.freestatistics.org/blog/index.php?pk=297739&T=2

As an alternative you can also use a QR Code:  

The GUIDs for individual cells are displayed in the table below:

Multiple Linear Regression - Ordinary Least Squares
VariableParameterS.D.T-STATH0: parameter = 02-tail p-value1-tail p-value
(Intercept)+14.93 2.104+7.0930e+00 2.324e-10 1.162e-10
Retour+0.0932 0.2706+3.4450e-01 0.7313 0.3656
Kwaliteit-0.2573 0.4478-5.7450e-01 0.567 0.2835
Tevredenheid+0.5103 0.4305+1.1850e+00 0.2388 0.1194
Verwachtingen+0.1171 0.4002+2.9250e-01 0.7705 0.3853


Multiple Linear Regression - Regression Statistics
Multiple R 0.1579
R-squared 0.02492
Adjusted R-squared-0.01613
F-TEST (value) 0.607
F-TEST (DF numerator)4
F-TEST (DF denominator)95
p-value 0.6585
Multiple Linear Regression - Residual Statistics
Residual Standard Deviation 2.299
Sum Squared Residuals 501.9

\begin{tabular}{lllllllll}
\hline
Multiple Linear Regression - Regression Statistics \tabularnewline
Multiple R &  0.1579 \tabularnewline
R-squared &  0.02492 \tabularnewline
Adjusted R-squared & -0.01613 \tabularnewline
F-TEST (value) &  0.607 \tabularnewline
F-TEST (DF numerator) & 4 \tabularnewline
F-TEST (DF denominator) & 95 \tabularnewline
p-value &  0.6585 \tabularnewline
Multiple Linear Regression - Residual Statistics \tabularnewline
Residual Standard Deviation &  2.299 \tabularnewline
Sum Squared Residuals &  501.9 \tabularnewline
\hline
\end{tabular}
%Source: https://freestatistics.org/blog/index.php?pk=297739&T=3

[TABLE]
[ROW][C]Multiple Linear Regression - Regression Statistics[/C][/ROW]
[ROW][C]Multiple R[/C][C] 0.1579[/C][/ROW]
[ROW][C]R-squared[/C][C] 0.02492[/C][/ROW]
[ROW][C]Adjusted R-squared[/C][C]-0.01613[/C][/ROW]
[ROW][C]F-TEST (value)[/C][C] 0.607[/C][/ROW]
[ROW][C]F-TEST (DF numerator)[/C][C]4[/C][/ROW]
[ROW][C]F-TEST (DF denominator)[/C][C]95[/C][/ROW]
[ROW][C]p-value[/C][C] 0.6585[/C][/ROW]
[ROW][C]Multiple Linear Regression - Residual Statistics[/C][/ROW]
[ROW][C]Residual Standard Deviation[/C][C] 2.299[/C][/ROW]
[ROW][C]Sum Squared Residuals[/C][C] 501.9[/C][/ROW]
[/TABLE]
Source: https://freestatistics.org/blog/index.php?pk=297739&T=3

Globally Unique Identifier (entire table): ba.freestatistics.org/blog/index.php?pk=297739&T=3

As an alternative you can also use a QR Code:  

The GUIDs for individual cells are displayed in the table below:

Multiple Linear Regression - Regression Statistics
Multiple R 0.1579
R-squared 0.02492
Adjusted R-squared-0.01613
F-TEST (value) 0.607
F-TEST (DF numerator)4
F-TEST (DF denominator)95
p-value 0.6585
Multiple Linear Regression - Residual Statistics
Residual Standard Deviation 2.299
Sum Squared Residuals 501.9


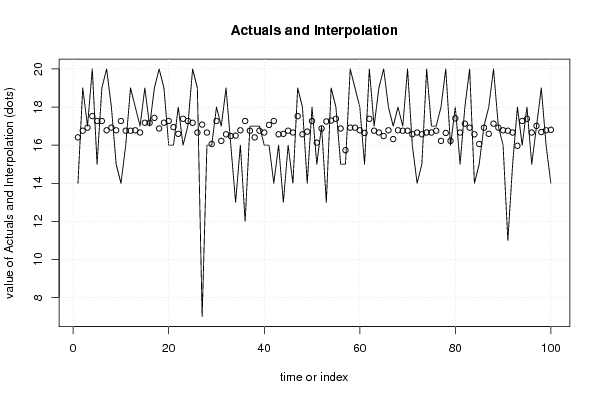
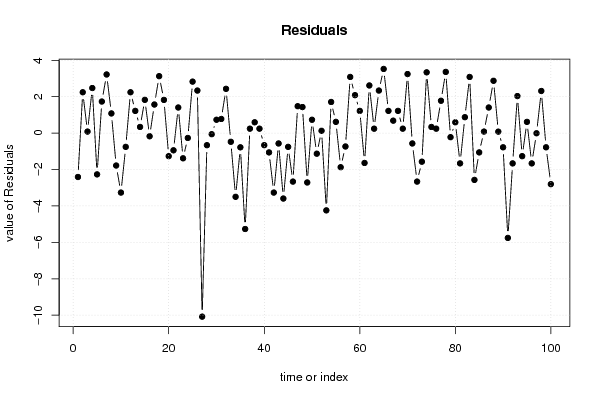
Multiple Linear Regression - Actuals, Interpolation, and Residuals
Time or IndexActualsInterpolationForecastResidualsPrediction Error
1 14 16.41-2.411
2 19 16.76 2.243
3 17 16.92 0.08283
4 20 17.52 2.475
5 15 17.27-2.268
6 19 17.27 1.732
7 20 16.78 3.219
8 18 16.92 1.079
9 15 16.78-1.781
10 14 17.27-3.268
11 16 16.76-0.7573
12 19 16.76 2.243
13 18 16.78 1.219
14 17 16.66 0.3359
15 19 17.17 1.826
16 17 17.17-0.1744
17 19 17.43 1.568
18 20 16.87 3.126
19 19 17.18 1.821
20 16 17.27-1.268
21 16 16.95-0.9453
22 18 16.59 1.405
23 16 17.38-1.385
24 17 17.27-0.2676
25 20 17.17 2.826
26 19 16.66 2.336
27 7 17.08-10.08
28 16 16.66-0.6641
29 16 16.06-0.06066
30 18 17.27 0.7324
31 17 16.22 0.7753
32 19 16.57 2.429
33 16 16.48-0.4777
34 13 16.5-3.5
35 16 16.78-0.7812
36 12 17.27-5.268
37 17 16.76 0.2427
38 17 16.41 0.5931
39 17 16.76 0.2427
40 16 16.66-0.6641
41 16 17.06-1.062
42 14 17.27-3.268
43 16 16.57-0.5709
44 13 16.59-3.595
45 16 16.76-0.7573
46 14 16.66-2.664
47 19 17.52 1.475
48 18 16.57 1.429
49 14 16.71-2.712
50 18 17.27 0.7324
51 15 16.13-1.132
52 17 16.87 0.1256
53 13 17.24-4.245
54 19 17.29 1.708
55 18 17.38 0.6153
56 15 16.87-1.874
57 15 15.74-0.7368
58 20 16.92 3.083
59 19 16.92 2.083
60 18 16.78 1.219
61 15 16.64-1.641
62 20 17.38 2.615
63 17 16.76 0.2427
64 19 16.66 2.336
65 20 16.48 3.522
66 18 16.78 1.219
67 17 16.32 0.6821
68 18 16.78 1.219
69 17 16.76 0.2427
70 20 16.76 3.243
71 16 16.57-0.5709
72 14 16.66-2.664
73 15 16.57-1.571
74 20 16.66 3.336
75 17 16.66 0.3359
76 17 16.76 0.2427
77 18 16.22 1.775
78 20 16.64 3.359
79 16 16.22-0.2247
80 18 17.41 0.5914
81 15 16.66-1.664
82 18 17.13 0.8725
83 20 16.92 3.083
84 14 16.57-2.571
85 15 16.06-1.061
86 17 16.92 0.08283
87 18 16.59 1.405
88 20 17.13 2.873
89 17 16.92 0.0786
90 16 16.78-0.7812
91 11 16.76-5.757
92 15 16.66-1.664
93 18 15.97 2.033
94 16 17.27-1.268
95 18 17.38 0.6153
96 15 16.66-1.664
97 17 17.01-0.01038
98 19 16.69 2.312
99 16 16.78-0.7812
100 14 16.81-2.805

\begin{tabular}{lllllllll}
\hline
Multiple Linear Regression - Actuals, Interpolation, and Residuals \tabularnewline
Time or Index & Actuals & InterpolationForecast & ResidualsPrediction Error \tabularnewline
1 &  14 &  16.41 & -2.411 \tabularnewline
2 &  19 &  16.76 &  2.243 \tabularnewline
3 &  17 &  16.92 &  0.08283 \tabularnewline
4 &  20 &  17.52 &  2.475 \tabularnewline
5 &  15 &  17.27 & -2.268 \tabularnewline
6 &  19 &  17.27 &  1.732 \tabularnewline
7 &  20 &  16.78 &  3.219 \tabularnewline
8 &  18 &  16.92 &  1.079 \tabularnewline
9 &  15 &  16.78 & -1.781 \tabularnewline
10 &  14 &  17.27 & -3.268 \tabularnewline
11 &  16 &  16.76 & -0.7573 \tabularnewline
12 &  19 &  16.76 &  2.243 \tabularnewline
13 &  18 &  16.78 &  1.219 \tabularnewline
14 &  17 &  16.66 &  0.3359 \tabularnewline
15 &  19 &  17.17 &  1.826 \tabularnewline
16 &  17 &  17.17 & -0.1744 \tabularnewline
17 &  19 &  17.43 &  1.568 \tabularnewline
18 &  20 &  16.87 &  3.126 \tabularnewline
19 &  19 &  17.18 &  1.821 \tabularnewline
20 &  16 &  17.27 & -1.268 \tabularnewline
21 &  16 &  16.95 & -0.9453 \tabularnewline
22 &  18 &  16.59 &  1.405 \tabularnewline
23 &  16 &  17.38 & -1.385 \tabularnewline
24 &  17 &  17.27 & -0.2676 \tabularnewline
25 &  20 &  17.17 &  2.826 \tabularnewline
26 &  19 &  16.66 &  2.336 \tabularnewline
27 &  7 &  17.08 & -10.08 \tabularnewline
28 &  16 &  16.66 & -0.6641 \tabularnewline
29 &  16 &  16.06 & -0.06066 \tabularnewline
30 &  18 &  17.27 &  0.7324 \tabularnewline
31 &  17 &  16.22 &  0.7753 \tabularnewline
32 &  19 &  16.57 &  2.429 \tabularnewline
33 &  16 &  16.48 & -0.4777 \tabularnewline
34 &  13 &  16.5 & -3.5 \tabularnewline
35 &  16 &  16.78 & -0.7812 \tabularnewline
36 &  12 &  17.27 & -5.268 \tabularnewline
37 &  17 &  16.76 &  0.2427 \tabularnewline
38 &  17 &  16.41 &  0.5931 \tabularnewline
39 &  17 &  16.76 &  0.2427 \tabularnewline
40 &  16 &  16.66 & -0.6641 \tabularnewline
41 &  16 &  17.06 & -1.062 \tabularnewline
42 &  14 &  17.27 & -3.268 \tabularnewline
43 &  16 &  16.57 & -0.5709 \tabularnewline
44 &  13 &  16.59 & -3.595 \tabularnewline
45 &  16 &  16.76 & -0.7573 \tabularnewline
46 &  14 &  16.66 & -2.664 \tabularnewline
47 &  19 &  17.52 &  1.475 \tabularnewline
48 &  18 &  16.57 &  1.429 \tabularnewline
49 &  14 &  16.71 & -2.712 \tabularnewline
50 &  18 &  17.27 &  0.7324 \tabularnewline
51 &  15 &  16.13 & -1.132 \tabularnewline
52 &  17 &  16.87 &  0.1256 \tabularnewline
53 &  13 &  17.24 & -4.245 \tabularnewline
54 &  19 &  17.29 &  1.708 \tabularnewline
55 &  18 &  17.38 &  0.6153 \tabularnewline
56 &  15 &  16.87 & -1.874 \tabularnewline
57 &  15 &  15.74 & -0.7368 \tabularnewline
58 &  20 &  16.92 &  3.083 \tabularnewline
59 &  19 &  16.92 &  2.083 \tabularnewline
60 &  18 &  16.78 &  1.219 \tabularnewline
61 &  15 &  16.64 & -1.641 \tabularnewline
62 &  20 &  17.38 &  2.615 \tabularnewline
63 &  17 &  16.76 &  0.2427 \tabularnewline
64 &  19 &  16.66 &  2.336 \tabularnewline
65 &  20 &  16.48 &  3.522 \tabularnewline
66 &  18 &  16.78 &  1.219 \tabularnewline
67 &  17 &  16.32 &  0.6821 \tabularnewline
68 &  18 &  16.78 &  1.219 \tabularnewline
69 &  17 &  16.76 &  0.2427 \tabularnewline
70 &  20 &  16.76 &  3.243 \tabularnewline
71 &  16 &  16.57 & -0.5709 \tabularnewline
72 &  14 &  16.66 & -2.664 \tabularnewline
73 &  15 &  16.57 & -1.571 \tabularnewline
74 &  20 &  16.66 &  3.336 \tabularnewline
75 &  17 &  16.66 &  0.3359 \tabularnewline
76 &  17 &  16.76 &  0.2427 \tabularnewline
77 &  18 &  16.22 &  1.775 \tabularnewline
78 &  20 &  16.64 &  3.359 \tabularnewline
79 &  16 &  16.22 & -0.2247 \tabularnewline
80 &  18 &  17.41 &  0.5914 \tabularnewline
81 &  15 &  16.66 & -1.664 \tabularnewline
82 &  18 &  17.13 &  0.8725 \tabularnewline
83 &  20 &  16.92 &  3.083 \tabularnewline
84 &  14 &  16.57 & -2.571 \tabularnewline
85 &  15 &  16.06 & -1.061 \tabularnewline
86 &  17 &  16.92 &  0.08283 \tabularnewline
87 &  18 &  16.59 &  1.405 \tabularnewline
88 &  20 &  17.13 &  2.873 \tabularnewline
89 &  17 &  16.92 &  0.0786 \tabularnewline
90 &  16 &  16.78 & -0.7812 \tabularnewline
91 &  11 &  16.76 & -5.757 \tabularnewline
92 &  15 &  16.66 & -1.664 \tabularnewline
93 &  18 &  15.97 &  2.033 \tabularnewline
94 &  16 &  17.27 & -1.268 \tabularnewline
95 &  18 &  17.38 &  0.6153 \tabularnewline
96 &  15 &  16.66 & -1.664 \tabularnewline
97 &  17 &  17.01 & -0.01038 \tabularnewline
98 &  19 &  16.69 &  2.312 \tabularnewline
99 &  16 &  16.78 & -0.7812 \tabularnewline
100 &  14 &  16.81 & -2.805 \tabularnewline
\hline
\end{tabular}
%Source: https://freestatistics.org/blog/index.php?pk=297739&T=4

[TABLE]
[ROW][C]Multiple Linear Regression - Actuals, Interpolation, and Residuals[/C][/ROW]
[ROW][C]Time or Index[/C][C]Actuals[/C][C]InterpolationForecast[/C][C]ResidualsPrediction Error[/C][/ROW]
[ROW][C]1[/C][C] 14[/C][C] 16.41[/C][C]-2.411[/C][/ROW]
[ROW][C]2[/C][C] 19[/C][C] 16.76[/C][C] 2.243[/C][/ROW]
[ROW][C]3[/C][C] 17[/C][C] 16.92[/C][C] 0.08283[/C][/ROW]
[ROW][C]4[/C][C] 20[/C][C] 17.52[/C][C] 2.475[/C][/ROW]
[ROW][C]5[/C][C] 15[/C][C] 17.27[/C][C]-2.268[/C][/ROW]
[ROW][C]6[/C][C] 19[/C][C] 17.27[/C][C] 1.732[/C][/ROW]
[ROW][C]7[/C][C] 20[/C][C] 16.78[/C][C] 3.219[/C][/ROW]
[ROW][C]8[/C][C] 18[/C][C] 16.92[/C][C] 1.079[/C][/ROW]
[ROW][C]9[/C][C] 15[/C][C] 16.78[/C][C]-1.781[/C][/ROW]
[ROW][C]10[/C][C] 14[/C][C] 17.27[/C][C]-3.268[/C][/ROW]
[ROW][C]11[/C][C] 16[/C][C] 16.76[/C][C]-0.7573[/C][/ROW]
[ROW][C]12[/C][C] 19[/C][C] 16.76[/C][C] 2.243[/C][/ROW]
[ROW][C]13[/C][C] 18[/C][C] 16.78[/C][C] 1.219[/C][/ROW]
[ROW][C]14[/C][C] 17[/C][C] 16.66[/C][C] 0.3359[/C][/ROW]
[ROW][C]15[/C][C] 19[/C][C] 17.17[/C][C] 1.826[/C][/ROW]
[ROW][C]16[/C][C] 17[/C][C] 17.17[/C][C]-0.1744[/C][/ROW]
[ROW][C]17[/C][C] 19[/C][C] 17.43[/C][C] 1.568[/C][/ROW]
[ROW][C]18[/C][C] 20[/C][C] 16.87[/C][C] 3.126[/C][/ROW]
[ROW][C]19[/C][C] 19[/C][C] 17.18[/C][C] 1.821[/C][/ROW]
[ROW][C]20[/C][C] 16[/C][C] 17.27[/C][C]-1.268[/C][/ROW]
[ROW][C]21[/C][C] 16[/C][C] 16.95[/C][C]-0.9453[/C][/ROW]
[ROW][C]22[/C][C] 18[/C][C] 16.59[/C][C] 1.405[/C][/ROW]
[ROW][C]23[/C][C] 16[/C][C] 17.38[/C][C]-1.385[/C][/ROW]
[ROW][C]24[/C][C] 17[/C][C] 17.27[/C][C]-0.2676[/C][/ROW]
[ROW][C]25[/C][C] 20[/C][C] 17.17[/C][C] 2.826[/C][/ROW]
[ROW][C]26[/C][C] 19[/C][C] 16.66[/C][C] 2.336[/C][/ROW]
[ROW][C]27[/C][C] 7[/C][C] 17.08[/C][C]-10.08[/C][/ROW]
[ROW][C]28[/C][C] 16[/C][C] 16.66[/C][C]-0.6641[/C][/ROW]
[ROW][C]29[/C][C] 16[/C][C] 16.06[/C][C]-0.06066[/C][/ROW]
[ROW][C]30[/C][C] 18[/C][C] 17.27[/C][C] 0.7324[/C][/ROW]
[ROW][C]31[/C][C] 17[/C][C] 16.22[/C][C] 0.7753[/C][/ROW]
[ROW][C]32[/C][C] 19[/C][C] 16.57[/C][C] 2.429[/C][/ROW]
[ROW][C]33[/C][C] 16[/C][C] 16.48[/C][C]-0.4777[/C][/ROW]
[ROW][C]34[/C][C] 13[/C][C] 16.5[/C][C]-3.5[/C][/ROW]
[ROW][C]35[/C][C] 16[/C][C] 16.78[/C][C]-0.7812[/C][/ROW]
[ROW][C]36[/C][C] 12[/C][C] 17.27[/C][C]-5.268[/C][/ROW]
[ROW][C]37[/C][C] 17[/C][C] 16.76[/C][C] 0.2427[/C][/ROW]
[ROW][C]38[/C][C] 17[/C][C] 16.41[/C][C] 0.5931[/C][/ROW]
[ROW][C]39[/C][C] 17[/C][C] 16.76[/C][C] 0.2427[/C][/ROW]
[ROW][C]40[/C][C] 16[/C][C] 16.66[/C][C]-0.6641[/C][/ROW]
[ROW][C]41[/C][C] 16[/C][C] 17.06[/C][C]-1.062[/C][/ROW]
[ROW][C]42[/C][C] 14[/C][C] 17.27[/C][C]-3.268[/C][/ROW]
[ROW][C]43[/C][C] 16[/C][C] 16.57[/C][C]-0.5709[/C][/ROW]
[ROW][C]44[/C][C] 13[/C][C] 16.59[/C][C]-3.595[/C][/ROW]
[ROW][C]45[/C][C] 16[/C][C] 16.76[/C][C]-0.7573[/C][/ROW]
[ROW][C]46[/C][C] 14[/C][C] 16.66[/C][C]-2.664[/C][/ROW]
[ROW][C]47[/C][C] 19[/C][C] 17.52[/C][C] 1.475[/C][/ROW]
[ROW][C]48[/C][C] 18[/C][C] 16.57[/C][C] 1.429[/C][/ROW]
[ROW][C]49[/C][C] 14[/C][C] 16.71[/C][C]-2.712[/C][/ROW]
[ROW][C]50[/C][C] 18[/C][C] 17.27[/C][C] 0.7324[/C][/ROW]
[ROW][C]51[/C][C] 15[/C][C] 16.13[/C][C]-1.132[/C][/ROW]
[ROW][C]52[/C][C] 17[/C][C] 16.87[/C][C] 0.1256[/C][/ROW]
[ROW][C]53[/C][C] 13[/C][C] 17.24[/C][C]-4.245[/C][/ROW]
[ROW][C]54[/C][C] 19[/C][C] 17.29[/C][C] 1.708[/C][/ROW]
[ROW][C]55[/C][C] 18[/C][C] 17.38[/C][C] 0.6153[/C][/ROW]
[ROW][C]56[/C][C] 15[/C][C] 16.87[/C][C]-1.874[/C][/ROW]
[ROW][C]57[/C][C] 15[/C][C] 15.74[/C][C]-0.7368[/C][/ROW]
[ROW][C]58[/C][C] 20[/C][C] 16.92[/C][C] 3.083[/C][/ROW]
[ROW][C]59[/C][C] 19[/C][C] 16.92[/C][C] 2.083[/C][/ROW]
[ROW][C]60[/C][C] 18[/C][C] 16.78[/C][C] 1.219[/C][/ROW]
[ROW][C]61[/C][C] 15[/C][C] 16.64[/C][C]-1.641[/C][/ROW]
[ROW][C]62[/C][C] 20[/C][C] 17.38[/C][C] 2.615[/C][/ROW]
[ROW][C]63[/C][C] 17[/C][C] 16.76[/C][C] 0.2427[/C][/ROW]
[ROW][C]64[/C][C] 19[/C][C] 16.66[/C][C] 2.336[/C][/ROW]
[ROW][C]65[/C][C] 20[/C][C] 16.48[/C][C] 3.522[/C][/ROW]
[ROW][C]66[/C][C] 18[/C][C] 16.78[/C][C] 1.219[/C][/ROW]
[ROW][C]67[/C][C] 17[/C][C] 16.32[/C][C] 0.6821[/C][/ROW]
[ROW][C]68[/C][C] 18[/C][C] 16.78[/C][C] 1.219[/C][/ROW]
[ROW][C]69[/C][C] 17[/C][C] 16.76[/C][C] 0.2427[/C][/ROW]
[ROW][C]70[/C][C] 20[/C][C] 16.76[/C][C] 3.243[/C][/ROW]
[ROW][C]71[/C][C] 16[/C][C] 16.57[/C][C]-0.5709[/C][/ROW]
[ROW][C]72[/C][C] 14[/C][C] 16.66[/C][C]-2.664[/C][/ROW]
[ROW][C]73[/C][C] 15[/C][C] 16.57[/C][C]-1.571[/C][/ROW]
[ROW][C]74[/C][C] 20[/C][C] 16.66[/C][C] 3.336[/C][/ROW]
[ROW][C]75[/C][C] 17[/C][C] 16.66[/C][C] 0.3359[/C][/ROW]
[ROW][C]76[/C][C] 17[/C][C] 16.76[/C][C] 0.2427[/C][/ROW]
[ROW][C]77[/C][C] 18[/C][C] 16.22[/C][C] 1.775[/C][/ROW]
[ROW][C]78[/C][C] 20[/C][C] 16.64[/C][C] 3.359[/C][/ROW]
[ROW][C]79[/C][C] 16[/C][C] 16.22[/C][C]-0.2247[/C][/ROW]
[ROW][C]80[/C][C] 18[/C][C] 17.41[/C][C] 0.5914[/C][/ROW]
[ROW][C]81[/C][C] 15[/C][C] 16.66[/C][C]-1.664[/C][/ROW]
[ROW][C]82[/C][C] 18[/C][C] 17.13[/C][C] 0.8725[/C][/ROW]
[ROW][C]83[/C][C] 20[/C][C] 16.92[/C][C] 3.083[/C][/ROW]
[ROW][C]84[/C][C] 14[/C][C] 16.57[/C][C]-2.571[/C][/ROW]
[ROW][C]85[/C][C] 15[/C][C] 16.06[/C][C]-1.061[/C][/ROW]
[ROW][C]86[/C][C] 17[/C][C] 16.92[/C][C] 0.08283[/C][/ROW]
[ROW][C]87[/C][C] 18[/C][C] 16.59[/C][C] 1.405[/C][/ROW]
[ROW][C]88[/C][C] 20[/C][C] 17.13[/C][C] 2.873[/C][/ROW]
[ROW][C]89[/C][C] 17[/C][C] 16.92[/C][C] 0.0786[/C][/ROW]
[ROW][C]90[/C][C] 16[/C][C] 16.78[/C][C]-0.7812[/C][/ROW]
[ROW][C]91[/C][C] 11[/C][C] 16.76[/C][C]-5.757[/C][/ROW]
[ROW][C]92[/C][C] 15[/C][C] 16.66[/C][C]-1.664[/C][/ROW]
[ROW][C]93[/C][C] 18[/C][C] 15.97[/C][C] 2.033[/C][/ROW]
[ROW][C]94[/C][C] 16[/C][C] 17.27[/C][C]-1.268[/C][/ROW]
[ROW][C]95[/C][C] 18[/C][C] 17.38[/C][C] 0.6153[/C][/ROW]
[ROW][C]96[/C][C] 15[/C][C] 16.66[/C][C]-1.664[/C][/ROW]
[ROW][C]97[/C][C] 17[/C][C] 17.01[/C][C]-0.01038[/C][/ROW]
[ROW][C]98[/C][C] 19[/C][C] 16.69[/C][C] 2.312[/C][/ROW]
[ROW][C]99[/C][C] 16[/C][C] 16.78[/C][C]-0.7812[/C][/ROW]
[ROW][C]100[/C][C] 14[/C][C] 16.81[/C][C]-2.805[/C][/ROW]
[/TABLE]
Source: https://freestatistics.org/blog/index.php?pk=297739&T=4

Globally Unique Identifier (entire table): ba.freestatistics.org/blog/index.php?pk=297739&T=4

As an alternative you can also use a QR Code:  

The GUIDs for individual cells are displayed in the table below:

Multiple Linear Regression - Actuals, Interpolation, and Residuals
Time or IndexActualsInterpolationForecastResidualsPrediction Error
1 14 16.41-2.411
2 19 16.76 2.243
3 17 16.92 0.08283
4 20 17.52 2.475
5 15 17.27-2.268
6 19 17.27 1.732
7 20 16.78 3.219
8 18 16.92 1.079
9 15 16.78-1.781
10 14 17.27-3.268
11 16 16.76-0.7573
12 19 16.76 2.243
13 18 16.78 1.219
14 17 16.66 0.3359
15 19 17.17 1.826
16 17 17.17-0.1744
17 19 17.43 1.568
18 20 16.87 3.126
19 19 17.18 1.821
20 16 17.27-1.268
21 16 16.95-0.9453
22 18 16.59 1.405
23 16 17.38-1.385
24 17 17.27-0.2676
25 20 17.17 2.826
26 19 16.66 2.336
27 7 17.08-10.08
28 16 16.66-0.6641
29 16 16.06-0.06066
30 18 17.27 0.7324
31 17 16.22 0.7753
32 19 16.57 2.429
33 16 16.48-0.4777
34 13 16.5-3.5
35 16 16.78-0.7812
36 12 17.27-5.268
37 17 16.76 0.2427
38 17 16.41 0.5931
39 17 16.76 0.2427
40 16 16.66-0.6641
41 16 17.06-1.062
42 14 17.27-3.268
43 16 16.57-0.5709
44 13 16.59-3.595
45 16 16.76-0.7573
46 14 16.66-2.664
47 19 17.52 1.475
48 18 16.57 1.429
49 14 16.71-2.712
50 18 17.27 0.7324
51 15 16.13-1.132
52 17 16.87 0.1256
53 13 17.24-4.245
54 19 17.29 1.708
55 18 17.38 0.6153
56 15 16.87-1.874
57 15 15.74-0.7368
58 20 16.92 3.083
59 19 16.92 2.083
60 18 16.78 1.219
61 15 16.64-1.641
62 20 17.38 2.615
63 17 16.76 0.2427
64 19 16.66 2.336
65 20 16.48 3.522
66 18 16.78 1.219
67 17 16.32 0.6821
68 18 16.78 1.219
69 17 16.76 0.2427
70 20 16.76 3.243
71 16 16.57-0.5709
72 14 16.66-2.664
73 15 16.57-1.571
74 20 16.66 3.336
75 17 16.66 0.3359
76 17 16.76 0.2427
77 18 16.22 1.775
78 20 16.64 3.359
79 16 16.22-0.2247
80 18 17.41 0.5914
81 15 16.66-1.664
82 18 17.13 0.8725
83 20 16.92 3.083
84 14 16.57-2.571
85 15 16.06-1.061
86 17 16.92 0.08283
87 18 16.59 1.405
88 20 17.13 2.873
89 17 16.92 0.0786
90 16 16.78-0.7812
91 11 16.76-5.757
92 15 16.66-1.664
93 18 15.97 2.033
94 16 17.27-1.268
95 18 17.38 0.6153
96 15 16.66-1.664
97 17 17.01-0.01038
98 19 16.69 2.312
99 16 16.78-0.7812
100 14 16.81-2.805


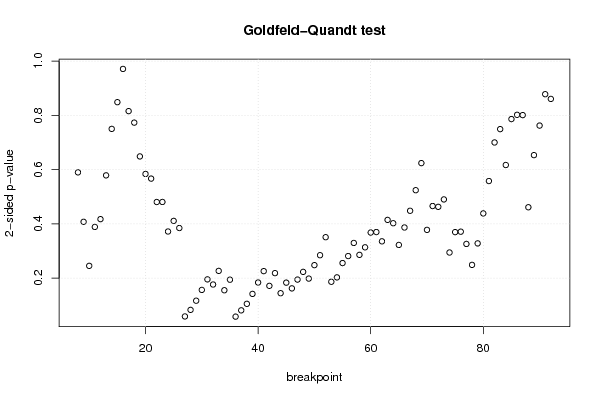
Goldfeld-Quandt test for Heteroskedasticity
p-valuesAlternative Hypothesis
breakpoint indexgreater2-sidedless
8 0.7051 0.5898 0.2949
9 0.7962 0.4076 0.2038
10 0.8774 0.2452 0.1226
11 0.8057 0.3886 0.1943
12 0.7913 0.4174 0.2087
13 0.7106 0.5788 0.2894
14 0.625 0.7501 0.375
15 0.5757 0.8485 0.4243
16 0.4855 0.971 0.5145
17 0.4078 0.8156 0.5922
18 0.3866 0.7731 0.6134
19 0.3243 0.6485 0.6757
20 0.292 0.5839 0.708
21 0.2834 0.5668 0.7166
22 0.2403 0.4805 0.7597
23 0.2404 0.4808 0.7596
24 0.1859 0.3718 0.8141
25 0.2055 0.4109 0.7945
26 0.1923 0.3847 0.8077
27 0.9706 0.05874 0.02937
28 0.9585 0.08299 0.04149
29 0.9417 0.1167 0.05835
30 0.9218 0.1565 0.07824
31 0.9023 0.1954 0.09772
32 0.9118 0.1764 0.08821
33 0.8867 0.2267 0.1133
34 0.9223 0.1553 0.07766
35 0.9029 0.1941 0.09707
36 0.971 0.05797 0.02899
37 0.9594 0.08126 0.04063
38 0.9474 0.1053 0.05264
39 0.9291 0.1419 0.07094
40 0.9081 0.1838 0.09192
41 0.8871 0.2258 0.1129
42 0.9142 0.1715 0.08575
43 0.8908 0.2184 0.1092
44 0.9278 0.1444 0.07218
45 0.9084 0.1833 0.09163
46 0.9189 0.1622 0.0811
47 0.9027 0.1946 0.09731
48 0.8885 0.223 0.1115
49 0.9008 0.1983 0.09915
50 0.8761 0.2478 0.1239
51 0.8578 0.2845 0.1422
52 0.8246 0.3508 0.1754
53 0.9067 0.1865 0.09327
54 0.8986 0.2027 0.1014
55 0.8723 0.2555 0.1277
56 0.8593 0.2814 0.1407
57 0.8352 0.3296 0.1648
58 0.8571 0.2858 0.1429
59 0.8432 0.3135 0.1568
60 0.816 0.368 0.184
61 0.8151 0.3698 0.1849
62 0.8322 0.3356 0.1678
63 0.7927 0.4146 0.2073
64 0.7988 0.4023 0.2012
65 0.8389 0.3223 0.1611
66 0.8067 0.3867 0.1933
67 0.7759 0.4482 0.2241
68 0.738 0.524 0.262
69 0.6881 0.6239 0.3119
70 0.8111 0.3778 0.1889
71 0.7671 0.4657 0.2329
72 0.7686 0.4628 0.2314
73 0.755 0.49 0.245
74 0.8528 0.2944 0.1472
75 0.8152 0.3696 0.1848
76 0.8144 0.3711 0.1856
77 0.837 0.326 0.163
78 0.8756 0.2487 0.1244
79 0.836 0.328 0.164
80 0.7808 0.4385 0.2192
81 0.721 0.5579 0.279
82 0.65 0.7 0.35
83 0.6254 0.7492 0.3746
84 0.6915 0.6169 0.3085
85 0.6069 0.7863 0.3931
86 0.5991 0.8019 0.4009
87 0.5996 0.8009 0.4004
88 0.7694 0.4612 0.2306
89 0.6733 0.6534 0.3267
90 0.6189 0.7623 0.3811
91 0.561 0.8779 0.439
92 0.4302 0.8605 0.5698

\begin{tabular}{lllllllll}
\hline
Goldfeld-Quandt test for Heteroskedasticity \tabularnewline
p-values & Alternative Hypothesis \tabularnewline
breakpoint index & greater & 2-sided & less \tabularnewline
8 &  0.7051 &  0.5898 &  0.2949 \tabularnewline
9 &  0.7962 &  0.4076 &  0.2038 \tabularnewline
10 &  0.8774 &  0.2452 &  0.1226 \tabularnewline
11 &  0.8057 &  0.3886 &  0.1943 \tabularnewline
12 &  0.7913 &  0.4174 &  0.2087 \tabularnewline
13 &  0.7106 &  0.5788 &  0.2894 \tabularnewline
14 &  0.625 &  0.7501 &  0.375 \tabularnewline
15 &  0.5757 &  0.8485 &  0.4243 \tabularnewline
16 &  0.4855 &  0.971 &  0.5145 \tabularnewline
17 &  0.4078 &  0.8156 &  0.5922 \tabularnewline
18 &  0.3866 &  0.7731 &  0.6134 \tabularnewline
19 &  0.3243 &  0.6485 &  0.6757 \tabularnewline
20 &  0.292 &  0.5839 &  0.708 \tabularnewline
21 &  0.2834 &  0.5668 &  0.7166 \tabularnewline
22 &  0.2403 &  0.4805 &  0.7597 \tabularnewline
23 &  0.2404 &  0.4808 &  0.7596 \tabularnewline
24 &  0.1859 &  0.3718 &  0.8141 \tabularnewline
25 &  0.2055 &  0.4109 &  0.7945 \tabularnewline
26 &  0.1923 &  0.3847 &  0.8077 \tabularnewline
27 &  0.9706 &  0.05874 &  0.02937 \tabularnewline
28 &  0.9585 &  0.08299 &  0.04149 \tabularnewline
29 &  0.9417 &  0.1167 &  0.05835 \tabularnewline
30 &  0.9218 &  0.1565 &  0.07824 \tabularnewline
31 &  0.9023 &  0.1954 &  0.09772 \tabularnewline
32 &  0.9118 &  0.1764 &  0.08821 \tabularnewline
33 &  0.8867 &  0.2267 &  0.1133 \tabularnewline
34 &  0.9223 &  0.1553 &  0.07766 \tabularnewline
35 &  0.9029 &  0.1941 &  0.09707 \tabularnewline
36 &  0.971 &  0.05797 &  0.02899 \tabularnewline
37 &  0.9594 &  0.08126 &  0.04063 \tabularnewline
38 &  0.9474 &  0.1053 &  0.05264 \tabularnewline
39 &  0.9291 &  0.1419 &  0.07094 \tabularnewline
40 &  0.9081 &  0.1838 &  0.09192 \tabularnewline
41 &  0.8871 &  0.2258 &  0.1129 \tabularnewline
42 &  0.9142 &  0.1715 &  0.08575 \tabularnewline
43 &  0.8908 &  0.2184 &  0.1092 \tabularnewline
44 &  0.9278 &  0.1444 &  0.07218 \tabularnewline
45 &  0.9084 &  0.1833 &  0.09163 \tabularnewline
46 &  0.9189 &  0.1622 &  0.0811 \tabularnewline
47 &  0.9027 &  0.1946 &  0.09731 \tabularnewline
48 &  0.8885 &  0.223 &  0.1115 \tabularnewline
49 &  0.9008 &  0.1983 &  0.09915 \tabularnewline
50 &  0.8761 &  0.2478 &  0.1239 \tabularnewline
51 &  0.8578 &  0.2845 &  0.1422 \tabularnewline
52 &  0.8246 &  0.3508 &  0.1754 \tabularnewline
53 &  0.9067 &  0.1865 &  0.09327 \tabularnewline
54 &  0.8986 &  0.2027 &  0.1014 \tabularnewline
55 &  0.8723 &  0.2555 &  0.1277 \tabularnewline
56 &  0.8593 &  0.2814 &  0.1407 \tabularnewline
57 &  0.8352 &  0.3296 &  0.1648 \tabularnewline
58 &  0.8571 &  0.2858 &  0.1429 \tabularnewline
59 &  0.8432 &  0.3135 &  0.1568 \tabularnewline
60 &  0.816 &  0.368 &  0.184 \tabularnewline
61 &  0.8151 &  0.3698 &  0.1849 \tabularnewline
62 &  0.8322 &  0.3356 &  0.1678 \tabularnewline
63 &  0.7927 &  0.4146 &  0.2073 \tabularnewline
64 &  0.7988 &  0.4023 &  0.2012 \tabularnewline
65 &  0.8389 &  0.3223 &  0.1611 \tabularnewline
66 &  0.8067 &  0.3867 &  0.1933 \tabularnewline
67 &  0.7759 &  0.4482 &  0.2241 \tabularnewline
68 &  0.738 &  0.524 &  0.262 \tabularnewline
69 &  0.6881 &  0.6239 &  0.3119 \tabularnewline
70 &  0.8111 &  0.3778 &  0.1889 \tabularnewline
71 &  0.7671 &  0.4657 &  0.2329 \tabularnewline
72 &  0.7686 &  0.4628 &  0.2314 \tabularnewline
73 &  0.755 &  0.49 &  0.245 \tabularnewline
74 &  0.8528 &  0.2944 &  0.1472 \tabularnewline
75 &  0.8152 &  0.3696 &  0.1848 \tabularnewline
76 &  0.8144 &  0.3711 &  0.1856 \tabularnewline
77 &  0.837 &  0.326 &  0.163 \tabularnewline
78 &  0.8756 &  0.2487 &  0.1244 \tabularnewline
79 &  0.836 &  0.328 &  0.164 \tabularnewline
80 &  0.7808 &  0.4385 &  0.2192 \tabularnewline
81 &  0.721 &  0.5579 &  0.279 \tabularnewline
82 &  0.65 &  0.7 &  0.35 \tabularnewline
83 &  0.6254 &  0.7492 &  0.3746 \tabularnewline
84 &  0.6915 &  0.6169 &  0.3085 \tabularnewline
85 &  0.6069 &  0.7863 &  0.3931 \tabularnewline
86 &  0.5991 &  0.8019 &  0.4009 \tabularnewline
87 &  0.5996 &  0.8009 &  0.4004 \tabularnewline
88 &  0.7694 &  0.4612 &  0.2306 \tabularnewline
89 &  0.6733 &  0.6534 &  0.3267 \tabularnewline
90 &  0.6189 &  0.7623 &  0.3811 \tabularnewline
91 &  0.561 &  0.8779 &  0.439 \tabularnewline
92 &  0.4302 &  0.8605 &  0.5698 \tabularnewline
\hline
\end{tabular}
%Source: https://freestatistics.org/blog/index.php?pk=297739&T=5

[TABLE]
[ROW][C]Goldfeld-Quandt test for Heteroskedasticity[/C][/ROW]
[ROW][C]p-values[/C][C]Alternative Hypothesis[/C][/ROW]
[ROW][C]breakpoint index[/C][C]greater[/C][C]2-sided[/C][C]less[/C][/ROW]
[ROW][C]8[/C][C] 0.7051[/C][C] 0.5898[/C][C] 0.2949[/C][/ROW]
[ROW][C]9[/C][C] 0.7962[/C][C] 0.4076[/C][C] 0.2038[/C][/ROW]
[ROW][C]10[/C][C] 0.8774[/C][C] 0.2452[/C][C] 0.1226[/C][/ROW]
[ROW][C]11[/C][C] 0.8057[/C][C] 0.3886[/C][C] 0.1943[/C][/ROW]
[ROW][C]12[/C][C] 0.7913[/C][C] 0.4174[/C][C] 0.2087[/C][/ROW]
[ROW][C]13[/C][C] 0.7106[/C][C] 0.5788[/C][C] 0.2894[/C][/ROW]
[ROW][C]14[/C][C] 0.625[/C][C] 0.7501[/C][C] 0.375[/C][/ROW]
[ROW][C]15[/C][C] 0.5757[/C][C] 0.8485[/C][C] 0.4243[/C][/ROW]
[ROW][C]16[/C][C] 0.4855[/C][C] 0.971[/C][C] 0.5145[/C][/ROW]
[ROW][C]17[/C][C] 0.4078[/C][C] 0.8156[/C][C] 0.5922[/C][/ROW]
[ROW][C]18[/C][C] 0.3866[/C][C] 0.7731[/C][C] 0.6134[/C][/ROW]
[ROW][C]19[/C][C] 0.3243[/C][C] 0.6485[/C][C] 0.6757[/C][/ROW]
[ROW][C]20[/C][C] 0.292[/C][C] 0.5839[/C][C] 0.708[/C][/ROW]
[ROW][C]21[/C][C] 0.2834[/C][C] 0.5668[/C][C] 0.7166[/C][/ROW]
[ROW][C]22[/C][C] 0.2403[/C][C] 0.4805[/C][C] 0.7597[/C][/ROW]
[ROW][C]23[/C][C] 0.2404[/C][C] 0.4808[/C][C] 0.7596[/C][/ROW]
[ROW][C]24[/C][C] 0.1859[/C][C] 0.3718[/C][C] 0.8141[/C][/ROW]
[ROW][C]25[/C][C] 0.2055[/C][C] 0.4109[/C][C] 0.7945[/C][/ROW]
[ROW][C]26[/C][C] 0.1923[/C][C] 0.3847[/C][C] 0.8077[/C][/ROW]
[ROW][C]27[/C][C] 0.9706[/C][C] 0.05874[/C][C] 0.02937[/C][/ROW]
[ROW][C]28[/C][C] 0.9585[/C][C] 0.08299[/C][C] 0.04149[/C][/ROW]
[ROW][C]29[/C][C] 0.9417[/C][C] 0.1167[/C][C] 0.05835[/C][/ROW]
[ROW][C]30[/C][C] 0.9218[/C][C] 0.1565[/C][C] 0.07824[/C][/ROW]
[ROW][C]31[/C][C] 0.9023[/C][C] 0.1954[/C][C] 0.09772[/C][/ROW]
[ROW][C]32[/C][C] 0.9118[/C][C] 0.1764[/C][C] 0.08821[/C][/ROW]
[ROW][C]33[/C][C] 0.8867[/C][C] 0.2267[/C][C] 0.1133[/C][/ROW]
[ROW][C]34[/C][C] 0.9223[/C][C] 0.1553[/C][C] 0.07766[/C][/ROW]
[ROW][C]35[/C][C] 0.9029[/C][C] 0.1941[/C][C] 0.09707[/C][/ROW]
[ROW][C]36[/C][C] 0.971[/C][C] 0.05797[/C][C] 0.02899[/C][/ROW]
[ROW][C]37[/C][C] 0.9594[/C][C] 0.08126[/C][C] 0.04063[/C][/ROW]
[ROW][C]38[/C][C] 0.9474[/C][C] 0.1053[/C][C] 0.05264[/C][/ROW]
[ROW][C]39[/C][C] 0.9291[/C][C] 0.1419[/C][C] 0.07094[/C][/ROW]
[ROW][C]40[/C][C] 0.9081[/C][C] 0.1838[/C][C] 0.09192[/C][/ROW]
[ROW][C]41[/C][C] 0.8871[/C][C] 0.2258[/C][C] 0.1129[/C][/ROW]
[ROW][C]42[/C][C] 0.9142[/C][C] 0.1715[/C][C] 0.08575[/C][/ROW]
[ROW][C]43[/C][C] 0.8908[/C][C] 0.2184[/C][C] 0.1092[/C][/ROW]
[ROW][C]44[/C][C] 0.9278[/C][C] 0.1444[/C][C] 0.07218[/C][/ROW]
[ROW][C]45[/C][C] 0.9084[/C][C] 0.1833[/C][C] 0.09163[/C][/ROW]
[ROW][C]46[/C][C] 0.9189[/C][C] 0.1622[/C][C] 0.0811[/C][/ROW]
[ROW][C]47[/C][C] 0.9027[/C][C] 0.1946[/C][C] 0.09731[/C][/ROW]
[ROW][C]48[/C][C] 0.8885[/C][C] 0.223[/C][C] 0.1115[/C][/ROW]
[ROW][C]49[/C][C] 0.9008[/C][C] 0.1983[/C][C] 0.09915[/C][/ROW]
[ROW][C]50[/C][C] 0.8761[/C][C] 0.2478[/C][C] 0.1239[/C][/ROW]
[ROW][C]51[/C][C] 0.8578[/C][C] 0.2845[/C][C] 0.1422[/C][/ROW]
[ROW][C]52[/C][C] 0.8246[/C][C] 0.3508[/C][C] 0.1754[/C][/ROW]
[ROW][C]53[/C][C] 0.9067[/C][C] 0.1865[/C][C] 0.09327[/C][/ROW]
[ROW][C]54[/C][C] 0.8986[/C][C] 0.2027[/C][C] 0.1014[/C][/ROW]
[ROW][C]55[/C][C] 0.8723[/C][C] 0.2555[/C][C] 0.1277[/C][/ROW]
[ROW][C]56[/C][C] 0.8593[/C][C] 0.2814[/C][C] 0.1407[/C][/ROW]
[ROW][C]57[/C][C] 0.8352[/C][C] 0.3296[/C][C] 0.1648[/C][/ROW]
[ROW][C]58[/C][C] 0.8571[/C][C] 0.2858[/C][C] 0.1429[/C][/ROW]
[ROW][C]59[/C][C] 0.8432[/C][C] 0.3135[/C][C] 0.1568[/C][/ROW]
[ROW][C]60[/C][C] 0.816[/C][C] 0.368[/C][C] 0.184[/C][/ROW]
[ROW][C]61[/C][C] 0.8151[/C][C] 0.3698[/C][C] 0.1849[/C][/ROW]
[ROW][C]62[/C][C] 0.8322[/C][C] 0.3356[/C][C] 0.1678[/C][/ROW]
[ROW][C]63[/C][C] 0.7927[/C][C] 0.4146[/C][C] 0.2073[/C][/ROW]
[ROW][C]64[/C][C] 0.7988[/C][C] 0.4023[/C][C] 0.2012[/C][/ROW]
[ROW][C]65[/C][C] 0.8389[/C][C] 0.3223[/C][C] 0.1611[/C][/ROW]
[ROW][C]66[/C][C] 0.8067[/C][C] 0.3867[/C][C] 0.1933[/C][/ROW]
[ROW][C]67[/C][C] 0.7759[/C][C] 0.4482[/C][C] 0.2241[/C][/ROW]
[ROW][C]68[/C][C] 0.738[/C][C] 0.524[/C][C] 0.262[/C][/ROW]
[ROW][C]69[/C][C] 0.6881[/C][C] 0.6239[/C][C] 0.3119[/C][/ROW]
[ROW][C]70[/C][C] 0.8111[/C][C] 0.3778[/C][C] 0.1889[/C][/ROW]
[ROW][C]71[/C][C] 0.7671[/C][C] 0.4657[/C][C] 0.2329[/C][/ROW]
[ROW][C]72[/C][C] 0.7686[/C][C] 0.4628[/C][C] 0.2314[/C][/ROW]
[ROW][C]73[/C][C] 0.755[/C][C] 0.49[/C][C] 0.245[/C][/ROW]
[ROW][C]74[/C][C] 0.8528[/C][C] 0.2944[/C][C] 0.1472[/C][/ROW]
[ROW][C]75[/C][C] 0.8152[/C][C] 0.3696[/C][C] 0.1848[/C][/ROW]
[ROW][C]76[/C][C] 0.8144[/C][C] 0.3711[/C][C] 0.1856[/C][/ROW]
[ROW][C]77[/C][C] 0.837[/C][C] 0.326[/C][C] 0.163[/C][/ROW]
[ROW][C]78[/C][C] 0.8756[/C][C] 0.2487[/C][C] 0.1244[/C][/ROW]
[ROW][C]79[/C][C] 0.836[/C][C] 0.328[/C][C] 0.164[/C][/ROW]
[ROW][C]80[/C][C] 0.7808[/C][C] 0.4385[/C][C] 0.2192[/C][/ROW]
[ROW][C]81[/C][C] 0.721[/C][C] 0.5579[/C][C] 0.279[/C][/ROW]
[ROW][C]82[/C][C] 0.65[/C][C] 0.7[/C][C] 0.35[/C][/ROW]
[ROW][C]83[/C][C] 0.6254[/C][C] 0.7492[/C][C] 0.3746[/C][/ROW]
[ROW][C]84[/C][C] 0.6915[/C][C] 0.6169[/C][C] 0.3085[/C][/ROW]
[ROW][C]85[/C][C] 0.6069[/C][C] 0.7863[/C][C] 0.3931[/C][/ROW]
[ROW][C]86[/C][C] 0.5991[/C][C] 0.8019[/C][C] 0.4009[/C][/ROW]
[ROW][C]87[/C][C] 0.5996[/C][C] 0.8009[/C][C] 0.4004[/C][/ROW]
[ROW][C]88[/C][C] 0.7694[/C][C] 0.4612[/C][C] 0.2306[/C][/ROW]
[ROW][C]89[/C][C] 0.6733[/C][C] 0.6534[/C][C] 0.3267[/C][/ROW]
[ROW][C]90[/C][C] 0.6189[/C][C] 0.7623[/C][C] 0.3811[/C][/ROW]
[ROW][C]91[/C][C] 0.561[/C][C] 0.8779[/C][C] 0.439[/C][/ROW]
[ROW][C]92[/C][C] 0.4302[/C][C] 0.8605[/C][C] 0.5698[/C][/ROW]
[/TABLE]
Source: https://freestatistics.org/blog/index.php?pk=297739&T=5

Globally Unique Identifier (entire table): ba.freestatistics.org/blog/index.php?pk=297739&T=5

As an alternative you can also use a QR Code:  

The GUIDs for individual cells are displayed in the table below:

Goldfeld-Quandt test for Heteroskedasticity
p-valuesAlternative Hypothesis
breakpoint indexgreater2-sidedless
8 0.7051 0.5898 0.2949
9 0.7962 0.4076 0.2038
10 0.8774 0.2452 0.1226
11 0.8057 0.3886 0.1943
12 0.7913 0.4174 0.2087
13 0.7106 0.5788 0.2894
14 0.625 0.7501 0.375
15 0.5757 0.8485 0.4243
16 0.4855 0.971 0.5145
17 0.4078 0.8156 0.5922
18 0.3866 0.7731 0.6134
19 0.3243 0.6485 0.6757
20 0.292 0.5839 0.708
21 0.2834 0.5668 0.7166
22 0.2403 0.4805 0.7597
23 0.2404 0.4808 0.7596
24 0.1859 0.3718 0.8141
25 0.2055 0.4109 0.7945
26 0.1923 0.3847 0.8077
27 0.9706 0.05874 0.02937
28 0.9585 0.08299 0.04149
29 0.9417 0.1167 0.05835
30 0.9218 0.1565 0.07824
31 0.9023 0.1954 0.09772
32 0.9118 0.1764 0.08821
33 0.8867 0.2267 0.1133
34 0.9223 0.1553 0.07766
35 0.9029 0.1941 0.09707
36 0.971 0.05797 0.02899
37 0.9594 0.08126 0.04063
38 0.9474 0.1053 0.05264
39 0.9291 0.1419 0.07094
40 0.9081 0.1838 0.09192
41 0.8871 0.2258 0.1129
42 0.9142 0.1715 0.08575
43 0.8908 0.2184 0.1092
44 0.9278 0.1444 0.07218
45 0.9084 0.1833 0.09163
46 0.9189 0.1622 0.0811
47 0.9027 0.1946 0.09731
48 0.8885 0.223 0.1115
49 0.9008 0.1983 0.09915
50 0.8761 0.2478 0.1239
51 0.8578 0.2845 0.1422
52 0.8246 0.3508 0.1754
53 0.9067 0.1865 0.09327
54 0.8986 0.2027 0.1014
55 0.8723 0.2555 0.1277
56 0.8593 0.2814 0.1407
57 0.8352 0.3296 0.1648
58 0.8571 0.2858 0.1429
59 0.8432 0.3135 0.1568
60 0.816 0.368 0.184
61 0.8151 0.3698 0.1849
62 0.8322 0.3356 0.1678
63 0.7927 0.4146 0.2073
64 0.7988 0.4023 0.2012
65 0.8389 0.3223 0.1611
66 0.8067 0.3867 0.1933
67 0.7759 0.4482 0.2241
68 0.738 0.524 0.262
69 0.6881 0.6239 0.3119
70 0.8111 0.3778 0.1889
71 0.7671 0.4657 0.2329
72 0.7686 0.4628 0.2314
73 0.755 0.49 0.245
74 0.8528 0.2944 0.1472
75 0.8152 0.3696 0.1848
76 0.8144 0.3711 0.1856
77 0.837 0.326 0.163
78 0.8756 0.2487 0.1244
79 0.836 0.328 0.164
80 0.7808 0.4385 0.2192
81 0.721 0.5579 0.279
82 0.65 0.7 0.35
83 0.6254 0.7492 0.3746
84 0.6915 0.6169 0.3085
85 0.6069 0.7863 0.3931
86 0.5991 0.8019 0.4009
87 0.5996 0.8009 0.4004
88 0.7694 0.4612 0.2306
89 0.6733 0.6534 0.3267
90 0.6189 0.7623 0.3811
91 0.561 0.8779 0.439
92 0.4302 0.8605 0.5698


Meta Analysis of Goldfeld-Quandt test for Heteroskedasticity
Description# significant tests% significant testsOK/NOK
1% type I error level0 0OK
5% type I error level00OK
10% type I error level40.0470588OK

\begin{tabular}{lllllllll}
\hline
Meta Analysis of Goldfeld-Quandt test for Heteroskedasticity \tabularnewline
Description & # significant tests & % significant tests & OK/NOK \tabularnewline
1% type I error level & 0 &  0 & OK \tabularnewline
5% type I error level & 0 & 0 & OK \tabularnewline
10% type I error level & 4 & 0.0470588 & OK \tabularnewline
\hline
\end{tabular}
%Source: https://freestatistics.org/blog/index.php?pk=297739&T=6

[TABLE]
[ROW][C]Meta Analysis of Goldfeld-Quandt test for Heteroskedasticity[/C][/ROW]
[ROW][C]Description[/C][C]# significant tests[/C][C]% significant tests[/C][C]OK/NOK[/C][/ROW]
[ROW][C]1% type I error level[/C][C]0[/C][C] 0[/C][C]OK[/C][/ROW]
[ROW][C]5% type I error level[/C][C]0[/C][C]0[/C][C]OK[/C][/ROW]
[ROW][C]10% type I error level[/C][C]4[/C][C]0.0470588[/C][C]OK[/C][/ROW]
[/TABLE]
Source: https://freestatistics.org/blog/index.php?pk=297739&T=6

Globally Unique Identifier (entire table): ba.freestatistics.org/blog/index.php?pk=297739&T=6

As an alternative you can also use a QR Code:  

The GUIDs for individual cells are displayed in the table below:

Meta Analysis of Goldfeld-Quandt test for Heteroskedasticity
Description# significant tests% significant testsOK/NOK
1% type I error level0 0OK
5% type I error level00OK
10% type I error level40.0470588OK


Ramsey RESET F-Test for powers (2 and 3) of fitted values
> reset_test_fitted
	RESET test
data:  mylm
RESET = 0.47572, df1 = 2, df2 = 93, p-value = 0.6229
Ramsey RESET F-Test for powers (2 and 3) of regressors
> reset_test_regressors
	RESET test
data:  mylm
RESET = 1.0185, df1 = 8, df2 = 87, p-value = 0.4283
Ramsey RESET F-Test for powers (2 and 3) of principal components
> reset_test_principal_components
	RESET test
data:  mylm
RESET = 0.60236, df1 = 2, df2 = 93, p-value = 0.5496

\begin{tabular}{lllllllll}
\hline
Ramsey RESET F-Test for powers (2 and 3) of fitted values \tabularnewline
> reset_test_fitted
	RESET test
data:  mylm
RESET = 0.47572, df1 = 2, df2 = 93, p-value = 0.6229
\tabularnewline Ramsey RESET F-Test for powers (2 and 3) of regressors \tabularnewline
> reset_test_regressors
	RESET test
data:  mylm
RESET = 1.0185, df1 = 8, df2 = 87, p-value = 0.4283
\tabularnewline Ramsey RESET F-Test for powers (2 and 3) of principal components \tabularnewline
> reset_test_principal_components
	RESET test
data:  mylm
RESET = 0.60236, df1 = 2, df2 = 93, p-value = 0.5496
\tabularnewline \hline \end{tabular} %Source: https://freestatistics.org/blog/index.php?pk=297739&T=7

[TABLE]
[ROW][C]Ramsey RESET F-Test for powers (2 and 3) of fitted values[/C][/ROW]
[ROW][C]
> reset_test_fitted
	RESET test
data:  mylm
RESET = 0.47572, df1 = 2, df2 = 93, p-value = 0.6229
[/C][/ROW] [ROW][C]Ramsey RESET F-Test for powers (2 and 3) of regressors[/C][/ROW] [ROW][C]
> reset_test_regressors
	RESET test
data:  mylm
RESET = 1.0185, df1 = 8, df2 = 87, p-value = 0.4283
[/C][/ROW] [ROW][C]Ramsey RESET F-Test for powers (2 and 3) of principal components[/C][/ROW] [ROW][C]
> reset_test_principal_components
	RESET test
data:  mylm
RESET = 0.60236, df1 = 2, df2 = 93, p-value = 0.5496
[/C][/ROW] [/TABLE] Source: https://freestatistics.org/blog/index.php?pk=297739&T=7

Globally Unique Identifier (entire table): ba.freestatistics.org/blog/index.php?pk=297739&T=7

As an alternative you can also use a QR Code:  

The GUIDs for individual cells are displayed in the table below:

Ramsey RESET F-Test for powers (2 and 3) of fitted values
> reset_test_fitted
	RESET test
data:  mylm
RESET = 0.47572, df1 = 2, df2 = 93, p-value = 0.6229
Ramsey RESET F-Test for powers (2 and 3) of regressors
> reset_test_regressors
	RESET test
data:  mylm
RESET = 1.0185, df1 = 8, df2 = 87, p-value = 0.4283
Ramsey RESET F-Test for powers (2 and 3) of principal components
> reset_test_principal_components
	RESET test
data:  mylm
RESET = 0.60236, df1 = 2, df2 = 93, p-value = 0.5496


Variance Inflation Factors (Multicollinearity)
> vif
       Retour     Kwaliteit  Tevredenheid Verwachtingen 
     1.358057      1.249211      1.423818      1.113964 

\begin{tabular}{lllllllll}
\hline
Variance Inflation Factors (Multicollinearity) \tabularnewline
> vif
       Retour     Kwaliteit  Tevredenheid Verwachtingen 
     1.358057      1.249211      1.423818      1.113964 
\tabularnewline \hline \end{tabular} %Source: https://freestatistics.org/blog/index.php?pk=297739&T=8

[TABLE]
[ROW][C]Variance Inflation Factors (Multicollinearity)[/C][/ROW]
[ROW][C]
> vif
       Retour     Kwaliteit  Tevredenheid Verwachtingen 
     1.358057      1.249211      1.423818      1.113964 
[/C][/ROW] [/TABLE] Source: https://freestatistics.org/blog/index.php?pk=297739&T=8

Globally Unique Identifier (entire table): ba.freestatistics.org/blog/index.php?pk=297739&T=8

As an alternative you can also use a QR Code:  

The GUIDs for individual cells are displayed in the table below:

Variance Inflation Factors (Multicollinearity)
> vif
       Retour     Kwaliteit  Tevredenheid Verwachtingen 
     1.358057      1.249211      1.423818      1.113964 


Parameters (Session):
par1 = 1 ; par2 = Do not include Seasonal Dummies ; par3 = No Linear Trend ; par4 = 0 ; par5 = 0 ;
Parameters (R input):
par1 = 1 ; par2 = Do not include Seasonal Dummies ; par3 = No Linear Trend ; par4 = 0 ; par5 = 0 ;
R code (references can be found in the software module):
par5 <- '0'
par4 <- '0'
par3 <- 'No Linear Trend'
par2 <- 'Do not include Seasonal Dummies'
par1 <- '1'
library(lattice)
library(lmtest)
library(car)
library(MASS)
n25 <- 25 #minimum number of obs. for Goldfeld-Quandt test
mywarning <- ''
par1 <- as.numeric(par1)
if(is.na(par1)) {
par1 <- 1
mywarning = 'Warning: you did not specify the column number of the endogenous series! The first column was selected by default.'
}
if (par4=='') par4 <- 0
par4 <- as.numeric(par4)
if (par5=='') par5 <- 0
par5 <- as.numeric(par5)
x <- na.omit(t(y))
k <- length(x[1,])
n <- length(x[,1])
x1 <- cbind(x[,par1], x[,1:k!=par1])
mycolnames <- c(colnames(x)[par1], colnames(x)[1:k!=par1])
colnames(x1) <- mycolnames #colnames(x)[par1]
x <- x1
if (par3 == 'First Differences'){
(n <- n -1)
x2 <- array(0, dim=c(n,k), dimnames=list(1:n, paste('(1-B)',colnames(x),sep='')))
for (i in 1:n) {
for (j in 1:k) {
x2[i,j] <- x[i+1,j] - x[i,j]
}
}
x <- x2
}
if (par3 == 'Seasonal Differences (s=12)'){
(n <- n - 12)
x2 <- array(0, dim=c(n,k), dimnames=list(1:n, paste('(1-B12)',colnames(x),sep='')))
for (i in 1:n) {
for (j in 1:k) {
x2[i,j] <- x[i+12,j] - x[i,j]
}
}
x <- x2
}
if (par3 == 'First and Seasonal Differences (s=12)'){
(n <- n -1)
x2 <- array(0, dim=c(n,k), dimnames=list(1:n, paste('(1-B)',colnames(x),sep='')))
for (i in 1:n) {
for (j in 1:k) {
x2[i,j] <- x[i+1,j] - x[i,j]
}
}
x <- x2
(n <- n - 12)
x2 <- array(0, dim=c(n,k), dimnames=list(1:n, paste('(1-B12)',colnames(x),sep='')))
for (i in 1:n) {
for (j in 1:k) {
x2[i,j] <- x[i+12,j] - x[i,j]
}
}
x <- x2
}
if(par4 > 0) {
x2 <- array(0, dim=c(n-par4,par4), dimnames=list(1:(n-par4), paste(colnames(x)[par1],'(t-',1:par4,')',sep='')))
for (i in 1:(n-par4)) {
for (j in 1:par4) {
x2[i,j] <- x[i+par4-j,par1]
}
}
x <- cbind(x[(par4+1):n,], x2)
n <- n - par4
}
if(par5 > 0) {
x2 <- array(0, dim=c(n-par5*12,par5), dimnames=list(1:(n-par5*12), paste(colnames(x)[par1],'(t-',1:par5,'s)',sep='')))
for (i in 1:(n-par5*12)) {
for (j in 1:par5) {
x2[i,j] <- x[i+par5*12-j*12,par1]
}
}
x <- cbind(x[(par5*12+1):n,], x2)
n <- n - par5*12
}
if (par2 == 'Include Monthly Dummies'){
x2 <- array(0, dim=c(n,11), dimnames=list(1:n, paste('M', seq(1:11), sep ='')))
for (i in 1:11){
x2[seq(i,n,12),i] <- 1
}
x <- cbind(x, x2)
}
if (par2 == 'Include Quarterly Dummies'){
x2 <- array(0, dim=c(n,3), dimnames=list(1:n, paste('Q', seq(1:3), sep ='')))
for (i in 1:3){
x2[seq(i,n,4),i] <- 1
}
x <- cbind(x, x2)
}
(k <- length(x[n,]))
if (par3 == 'Linear Trend'){
x <- cbind(x, c(1:n))
colnames(x)[k+1] <- 't'
}
print(x)
(k <- length(x[n,]))
head(x)
df <- as.data.frame(x)
(mylm <- lm(df))
(mysum <- summary(mylm))
if (n > n25) {
kp3 <- k + 3
nmkm3 <- n - k - 3
gqarr <- array(NA, dim=c(nmkm3-kp3+1,3))
numgqtests <- 0
numsignificant1 <- 0
numsignificant5 <- 0
numsignificant10 <- 0
for (mypoint in kp3:nmkm3) {
j <- 0
numgqtests <- numgqtests + 1
for (myalt in c('greater', 'two.sided', 'less')) {
j <- j + 1
gqarr[mypoint-kp3+1,j] <- gqtest(mylm, point=mypoint, alternative=myalt)$p.value
}
if (gqarr[mypoint-kp3+1,2] < 0.01) numsignificant1 <- numsignificant1 + 1
if (gqarr[mypoint-kp3+1,2] < 0.05) numsignificant5 <- numsignificant5 + 1
if (gqarr[mypoint-kp3+1,2] < 0.10) numsignificant10 <- numsignificant10 + 1
}
gqarr
}
bitmap(file='test0.png')
plot(x[,1], type='l', main='Actuals and Interpolation', ylab='value of Actuals and Interpolation (dots)', xlab='time or index')
points(x[,1]-mysum$resid)
grid()
dev.off()
bitmap(file='test1.png')
plot(mysum$resid, type='b', pch=19, main='Residuals', ylab='value of Residuals', xlab='time or index')
grid()
dev.off()
bitmap(file='test2.png')
sresid <- studres(mylm)
hist(sresid, freq=FALSE, main='Distribution of Studentized Residuals')
xfit<-seq(min(sresid),max(sresid),length=40)
yfit<-dnorm(xfit)
lines(xfit, yfit)
grid()
dev.off()
bitmap(file='test3.png')
densityplot(~mysum$resid,col='black',main='Residual Density Plot', xlab='values of Residuals')
dev.off()
bitmap(file='test4.png')
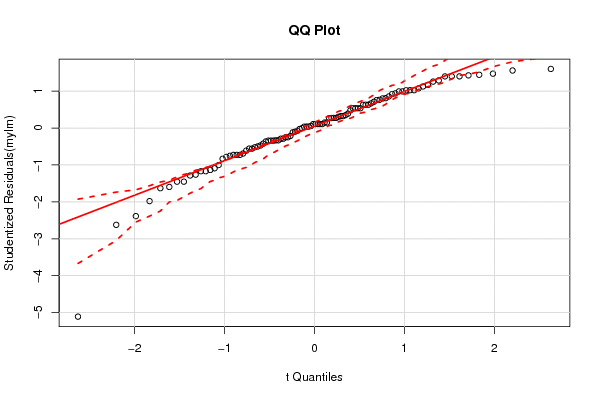
qqPlot(mylm, main='QQ Plot')
grid()
dev.off()
(myerror <- as.ts(mysum$resid))
bitmap(file='test5.png')
dum <- cbind(lag(myerror,k=1),myerror)
dum
dum1 <- dum[2:length(myerror),]
dum1
z <- as.data.frame(dum1)
print(z)
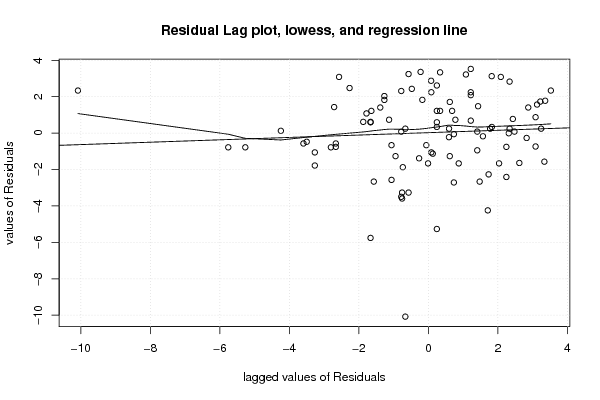
plot(z,main=paste('Residual Lag plot, lowess, and regression line'), ylab='values of Residuals', xlab='lagged values of Residuals')
lines(lowess(z))
abline(lm(z))
grid()
dev.off()
bitmap(file='test6.png')
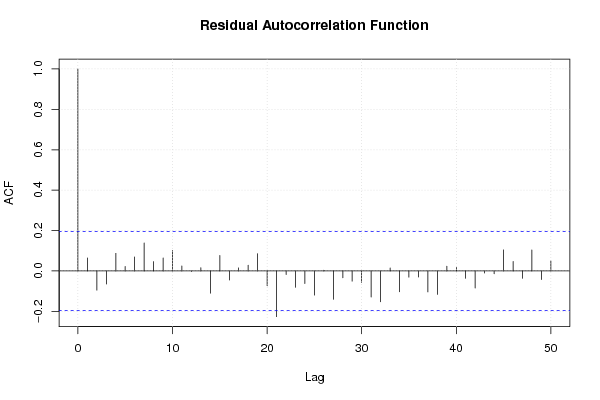
acf(mysum$resid, lag.max=length(mysum$resid)/2, main='Residual Autocorrelation Function')
grid()
dev.off()
bitmap(file='test7.png')
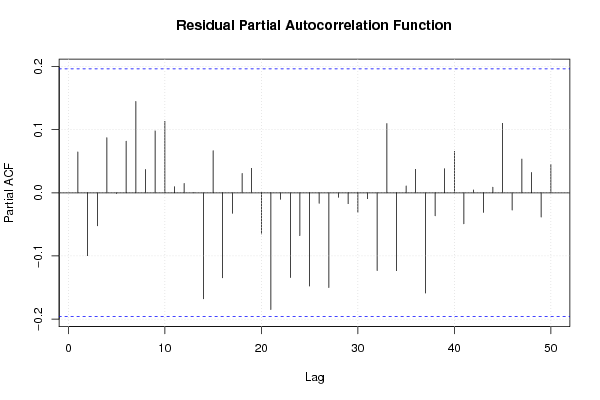
pacf(mysum$resid, lag.max=length(mysum$resid)/2, main='Residual Partial Autocorrelation Function')
grid()
dev.off()
bitmap(file='test8.png')
opar <- par(mfrow = c(2,2), oma = c(0, 0, 1.1, 0))
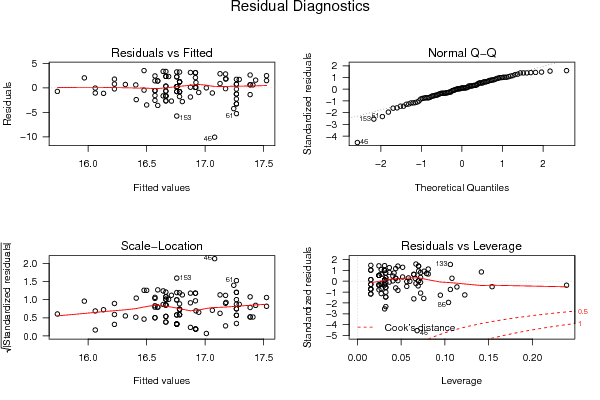
plot(mylm, las = 1, sub='Residual Diagnostics')
par(opar)
dev.off()
if (n > n25) {
bitmap(file='test9.png')
plot(kp3:nmkm3,gqarr[,2], main='Goldfeld-Quandt test',ylab='2-sided p-value',xlab='breakpoint')
grid()
dev.off()
}
load(file='createtable')
a<-table.start()
a<-table.row.start(a)
a<-table.element(a, 'Multiple Linear Regression - Estimated Regression Equation', 1, TRUE)
a<-table.row.end(a)
myeq <- colnames(x)[1]
myeq <- paste(myeq, '[t] = ', sep='')
for (i in 1:k){
if (mysum$coefficients[i,1] > 0) myeq <- paste(myeq, '+', '')
myeq <- paste(myeq, signif(mysum$coefficients[i,1],6), sep=' ')
if (rownames(mysum$coefficients)[i] != '(Intercept)') {
myeq <- paste(myeq, rownames(mysum$coefficients)[i], sep='')
if (rownames(mysum$coefficients)[i] != 't') myeq <- paste(myeq, '[t]', sep='')
}
}
myeq <- paste(myeq, ' + e[t]')
a<-table.row.start(a)
a<-table.element(a, myeq)
a<-table.row.end(a)
a<-table.row.start(a)
a<-table.element(a, mywarning)
a<-table.row.end(a)
a<-table.end(a)
table.save(a,file='mytable1.tab')
a<-table.start()
a<-table.row.start(a)
a<-table.element(a,'Multiple Linear Regression - Ordinary Least Squares', 6, TRUE)
a<-table.row.end(a)
a<-table.row.start(a)
a<-table.element(a,'Variable',header=TRUE)
a<-table.element(a,'Parameter',header=TRUE)
a<-table.element(a,'S.D.',header=TRUE)
a<-table.element(a,'T-STAT
H0: parameter = 0',header=TRUE)
a<-table.element(a,'2-tail p-value',header=TRUE)
a<-table.element(a,'1-tail p-value',header=TRUE)
a<-table.row.end(a)
for (i in 1:k){
a<-table.row.start(a)
a<-table.element(a,rownames(mysum$coefficients)[i],header=TRUE)
a<-table.element(a,formatC(signif(mysum$coefficients[i,1],5),format='g',flag='+'))
a<-table.element(a,formatC(signif(mysum$coefficients[i,2],5),format='g',flag=' '))
a<-table.element(a,formatC(signif(mysum$coefficients[i,3],4),format='e',flag='+'))
a<-table.element(a,formatC(signif(mysum$coefficients[i,4],4),format='g',flag=' '))
a<-table.element(a,formatC(signif(mysum$coefficients[i,4]/2,4),format='g',flag=' '))
a<-table.row.end(a)
}
a<-table.end(a)
table.save(a,file='mytable2.tab')
a<-table.start()
a<-table.row.start(a)
a<-table.element(a, 'Multiple Linear Regression - Regression Statistics', 2, TRUE)
a<-table.row.end(a)
a<-table.row.start(a)
a<-table.element(a, 'Multiple R',1,TRUE)
a<-table.element(a,formatC(signif(sqrt(mysum$r.squared),6),format='g',flag=' '))
a<-table.row.end(a)
a<-table.row.start(a)
a<-table.element(a, 'R-squared',1,TRUE)
a<-table.element(a,formatC(signif(mysum$r.squared,6),format='g',flag=' '))
a<-table.row.end(a)
a<-table.row.start(a)
a<-table.element(a, 'Adjusted R-squared',1,TRUE)
a<-table.element(a,formatC(signif(mysum$adj.r.squared,6),format='g',flag=' '))
a<-table.row.end(a)
a<-table.row.start(a)
a<-table.element(a, 'F-TEST (value)',1,TRUE)
a<-table.element(a,formatC(signif(mysum$fstatistic[1],6),format='g',flag=' '))
a<-table.row.end(a)
a<-table.row.start(a)
a<-table.element(a, 'F-TEST (DF numerator)',1,TRUE)
a<-table.element(a, signif(mysum$fstatistic[2],6))
a<-table.row.end(a)
a<-table.row.start(a)
a<-table.element(a, 'F-TEST (DF denominator)',1,TRUE)
a<-table.element(a, signif(mysum$fstatistic[3],6))
a<-table.row.end(a)
a<-table.row.start(a)
a<-table.element(a, 'p-value',1,TRUE)
a<-table.element(a,formatC(signif(1-pf(mysum$fstatistic[1],mysum$fstatistic[2],mysum$fstatistic[3]),6),format='g',flag=' '))
a<-table.row.end(a)
a<-table.row.start(a)
a<-table.element(a, 'Multiple Linear Regression - Residual Statistics', 2, TRUE)
a<-table.row.end(a)
a<-table.row.start(a)
a<-table.element(a, 'Residual Standard Deviation',1,TRUE)
a<-table.element(a,formatC(signif(mysum$sigma,6),format='g',flag=' '))
a<-table.row.end(a)
a<-table.row.start(a)
a<-table.element(a, 'Sum Squared Residuals',1,TRUE)
a<-table.element(a,formatC(signif(sum(myerror*myerror),6),format='g',flag=' '))
a<-table.row.end(a)
a<-table.end(a)
table.save(a,file='mytable3.tab')
myr <- as.numeric(mysum$resid)
myr
if(n < 200) {
a<-table.start()
a<-table.row.start(a)
a<-table.element(a, 'Multiple Linear Regression - Actuals, Interpolation, and Residuals', 4, TRUE)
a<-table.row.end(a)
a<-table.row.start(a)
a<-table.element(a, 'Time or Index', 1, TRUE)
a<-table.element(a, 'Actuals', 1, TRUE)
a<-table.element(a, 'Interpolation
Forecast', 1, TRUE)
a<-table.element(a, 'Residuals
Prediction Error', 1, TRUE)
a<-table.row.end(a)
for (i in 1:n) {
a<-table.row.start(a)
a<-table.element(a,i, 1, TRUE)
a<-table.element(a,formatC(signif(x[i],6),format='g',flag=' '))
a<-table.element(a,formatC(signif(x[i]-mysum$resid[i],6),format='g',flag=' '))
a<-table.element(a,formatC(signif(mysum$resid[i],6),format='g',flag=' '))
a<-table.row.end(a)
}
a<-table.end(a)
table.save(a,file='mytable4.tab')
if (n > n25) {
a<-table.start()
a<-table.row.start(a)
a<-table.element(a,'Goldfeld-Quandt test for Heteroskedasticity',4,TRUE)
a<-table.row.end(a)
a<-table.row.start(a)
a<-table.element(a,'p-values',header=TRUE)
a<-table.element(a,'Alternative Hypothesis',3,header=TRUE)
a<-table.row.end(a)
a<-table.row.start(a)
a<-table.element(a,'breakpoint index',header=TRUE)
a<-table.element(a,'greater',header=TRUE)
a<-table.element(a,'2-sided',header=TRUE)
a<-table.element(a,'less',header=TRUE)
a<-table.row.end(a)
for (mypoint in kp3:nmkm3) {
a<-table.row.start(a)
a<-table.element(a,mypoint,header=TRUE)
a<-table.element(a,formatC(signif(gqarr[mypoint-kp3+1,1],6),format='g',flag=' '))
a<-table.element(a,formatC(signif(gqarr[mypoint-kp3+1,2],6),format='g',flag=' '))
a<-table.element(a,formatC(signif(gqarr[mypoint-kp3+1,3],6),format='g',flag=' '))
a<-table.row.end(a)
}
a<-table.end(a)
table.save(a,file='mytable5.tab')
a<-table.start()
a<-table.row.start(a)
a<-table.element(a,'Meta Analysis of Goldfeld-Quandt test for Heteroskedasticity',4,TRUE)
a<-table.row.end(a)
a<-table.row.start(a)
a<-table.element(a,'Description',header=TRUE)
a<-table.element(a,'# significant tests',header=TRUE)
a<-table.element(a,'% significant tests',header=TRUE)
a<-table.element(a,'OK/NOK',header=TRUE)
a<-table.row.end(a)
a<-table.row.start(a)
a<-table.element(a,'1% type I error level',header=TRUE)
a<-table.element(a,signif(numsignificant1,6))
a<-table.element(a,formatC(signif(numsignificant1/numgqtests,6),format='g',flag=' '))
if (numsignificant1/numgqtests < 0.01) dum <- 'OK' else dum <- 'NOK'
a<-table.element(a,dum)
a<-table.row.end(a)
a<-table.row.start(a)
a<-table.element(a,'5% type I error level',header=TRUE)
a<-table.element(a,signif(numsignificant5,6))
a<-table.element(a,signif(numsignificant5/numgqtests,6))
if (numsignificant5/numgqtests < 0.05) dum <- 'OK' else dum <- 'NOK'
a<-table.element(a,dum)
a<-table.row.end(a)
a<-table.row.start(a)
a<-table.element(a,'10% type I error level',header=TRUE)
a<-table.element(a,signif(numsignificant10,6))
a<-table.element(a,signif(numsignificant10/numgqtests,6))
if (numsignificant10/numgqtests < 0.1) dum <- 'OK' else dum <- 'NOK'
a<-table.element(a,dum)
a<-table.row.end(a)
a<-table.end(a)
table.save(a,file='mytable6.tab')
}
}
a<-table.start()
a<-table.row.start(a)
a<-table.element(a,'Ramsey RESET F-Test for powers (2 and 3) of fitted values',1,TRUE)
a<-table.row.end(a)
a<-table.row.start(a)
reset_test_fitted <- resettest(mylm,power=2:3,type='fitted')
a<-table.element(a,paste('
',RC.texteval('reset_test_fitted'),'
',sep=''))
a<-table.row.end(a)
a<-table.row.start(a)
a<-table.element(a,'Ramsey RESET F-Test for powers (2 and 3) of regressors',1,TRUE)
a<-table.row.end(a)
a<-table.row.start(a)
reset_test_regressors <- resettest(mylm,power=2:3,type='regressor')
a<-table.element(a,paste('
',RC.texteval('reset_test_regressors'),'
',sep=''))
a<-table.row.end(a)
a<-table.row.start(a)
a<-table.element(a,'Ramsey RESET F-Test for powers (2 and 3) of principal components',1,TRUE)
a<-table.row.end(a)
a<-table.row.start(a)
reset_test_principal_components <- resettest(mylm,power=2:3,type='princomp')
a<-table.element(a,paste('
',RC.texteval('reset_test_principal_components'),'
',sep=''))
a<-table.row.end(a)
a<-table.end(a)
table.save(a,file='mytable8.tab')
a<-table.start()
a<-table.row.start(a)
a<-table.element(a,'Variance Inflation Factors (Multicollinearity)',1,TRUE)
a<-table.row.end(a)
a<-table.row.start(a)
vif <- vif(mylm)
a<-table.element(a,paste('
',RC.texteval('vif'),'
',sep=''))
a<-table.row.end(a)
a<-table.end(a)
table.save(a,file='mytable9.tab')