Free Statistics

of Irreproducible Research!

Author's title

Author*Unverified author*
R Software Modulerwasp_exponentialsmoothing.wasp
Title produced by softwareExponential Smoothing
Date of computationSun, 16 Jan 2011 20:21:55 +0000
Cite this page as followsStatistical Computations at FreeStatistics.org, Office for Research Development and Education, URL https://freestatistics.org/blog/index.php?v=date/2011/Jan/16/t1295209231yfbasvszczuxfrv.htm/, Retrieved Wed, 15 May 2024 04:25:21 +0000
Statistical Computations at FreeStatistics.org, Office for Research Development and Education, URL https://freestatistics.org/blog/index.php?pk=117463, Retrieved Wed, 15 May 2024 04:25:21 +0000
QR Codes:

Original text written by user:
IsPrivate?No (this computation is public)
User-defined keywordsKDGP2W102
Estimated Impact138
Family? (F = Feedback message, R = changed R code, M = changed R Module, P = changed Parameters, D = changed Data)
-     [Standard Deviation-Mean Plot] [Het aantal werklo...] [2010-12-06 17:23:48] [3e532679ec753acf7892d78d91c458c8]
- RMP   [Classical Decomposition] [Het aantal werklo...] [2010-12-14 22:42:47] [3e532679ec753acf7892d78d91c458c8]
- RMP       [Exponential Smoothing] [Het aantal werklo...] [2011-01-16 20:21:55] [d41d8cd98f00b204e9800998ecf8427e] [Current]
Feedback Forum

Post a new message
Dataseries X:
591000
589000
584000
573000
567000
569000
621000
629000
628000
612000
595000
597000
593000
590000
580000
574000
573000
573000
620000
626000
620000
588000
566000
557000
561000
549000
532000
526000
511000
499000
555000
565000
542000
527000
510000
514000
517000
508000
493000
490000
469000
478000
528000
534000
518000
506000
502000
516000
528000
533000
536000
537000
524000
536000
587000
597000
581000
564000
558000
575000


Summary of computational transaction
Raw Inputview raw input (R code)
Raw Outputview raw output of R engine
Computing time3 seconds
R Server'Sir Ronald Aylmer Fisher' @ 193.190.124.24

\begin{tabular}{lllllllll}
\hline
Summary of computational transaction \tabularnewline
Raw Input & view raw input (R code)  \tabularnewline
Raw Output & view raw output of R engine  \tabularnewline
Computing time & 3 seconds \tabularnewline
R Server & 'Sir Ronald Aylmer Fisher' @ 193.190.124.24 \tabularnewline
\hline
\end{tabular}
%Source: https://freestatistics.org/blog/index.php?pk=117463&T=0

[TABLE]
[ROW][C]Summary of computational transaction[/C][/ROW]
[ROW][C]Raw Input[/C][C]view raw input (R code) [/C][/ROW]
[ROW][C]Raw Output[/C][C]view raw output of R engine [/C][/ROW]
[ROW][C]Computing time[/C][C]3 seconds[/C][/ROW]
[ROW][C]R Server[/C][C]'Sir Ronald Aylmer Fisher' @ 193.190.124.24[/C][/ROW]
[/TABLE]
Source: https://freestatistics.org/blog/index.php?pk=117463&T=0

Globally Unique Identifier (entire table): ba.freestatistics.org/blog/index.php?pk=117463&T=0

As an alternative you can also use a QR Code:  

The GUIDs for individual cells are displayed in the table below:

Summary of computational transaction
Raw Inputview raw input (R code)
Raw Outputview raw output of R engine
Computing time3 seconds
R Server'Sir Ronald Aylmer Fisher' @ 193.190.124.24


Estimated Parameters of Exponential Smoothing
ParameterValue
alpha0.605601200667205
beta0.574371375563579
gamma1

\begin{tabular}{lllllllll}
\hline
Estimated Parameters of Exponential Smoothing \tabularnewline
Parameter & Value \tabularnewline
alpha & 0.605601200667205 \tabularnewline
beta & 0.574371375563579 \tabularnewline
gamma & 1 \tabularnewline
\hline
\end{tabular}
%Source: https://freestatistics.org/blog/index.php?pk=117463&T=1

[TABLE]
[ROW][C]Estimated Parameters of Exponential Smoothing[/C][/ROW]
[ROW][C]Parameter[/C][C]Value[/C][/ROW]
[ROW][C]alpha[/C][C]0.605601200667205[/C][/ROW]
[ROW][C]beta[/C][C]0.574371375563579[/C][/ROW]
[ROW][C]gamma[/C][C]1[/C][/ROW]
[/TABLE]
Source: https://freestatistics.org/blog/index.php?pk=117463&T=1

Globally Unique Identifier (entire table): ba.freestatistics.org/blog/index.php?pk=117463&T=1

As an alternative you can also use a QR Code:  

The GUIDs for individual cells are displayed in the table below:

Estimated Parameters of Exponential Smoothing
ParameterValue
alpha0.605601200667205
beta0.574371375563579
gamma1


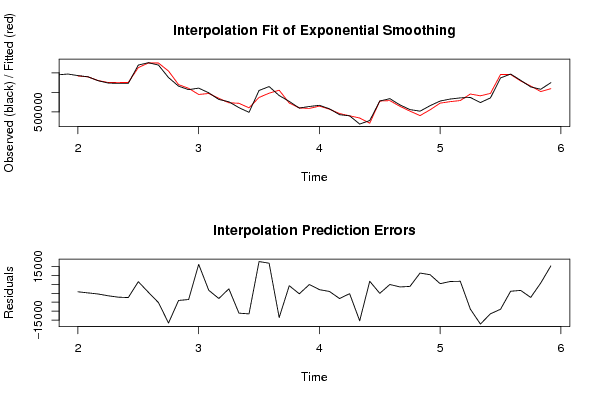
Interpolation Forecasts of Exponential Smoothing
tObservedFittedResiduals
13593000592132.745726496867.254273504019
14590000589747.35477792252.645222079707
15580000580369.302629229-369.30262922938
16574000575361.13989045-1361.13989045052
17573000575153.86042317-2153.86042317026
18573000575383.976318032-2383.97631803178
19620000613437.1581075816562.84189241868
20626000625399.695969745600.304030255415
21620000625210.123494242-5210.12349424232
22588000604689.459805047-16689.4598050467
23566000569994.967986863-3994.96798686287
24557000560473.666012373-3473.66601237305
25561000544693.49588316816306.5041168323
26549000547271.4963892381728.50361076160
27532000534911.057225064-2911.05722506379
28526000523457.4283793392542.57162066118
29511000522144.463208206-11144.4632082059
30499000510554.68054853-11554.6805485296
31555000537108.3282139617891.6717860395
32565000548046.26242664216953.7375733579
33542000555623.362675674-13623.3626756745
34527000522708.3730816294291.6269183713
35510000510252.984302774-252.984302773606
36514000509031.2839948964968.71600510419
37517000514929.5549993082070.44500069227
38508000506949.213486311050.78651369008
39493000495925.352070624-2925.35207062418
40490000490185.839858291-185.839858290623
41469000484445.213622628-15445.2136226278
42478000471215.9474264576784.05257354304
43528000527994.9500309935.04996900691185
44534000529014.9121667394985.08783326135
45518000514405.1447743763594.85522562399
46506000502093.2964605453906.70353945548
47502000490588.63412601611411.3658739841
48516000505523.86383921910476.1361607809
49528000522563.6147129355436.38528706529
50533000526339.6014617366660.39853826433
51536000529216.0538225056783.94617749495
52537000545885.557147777-8885.5571477774
53524000541280.575902911-17280.5759029109
54536000547491.078516169-11491.0785161685
55587000595956.258313888-8956.25831388799
56597000595823.5099342641176.49006573646
57581000579344.3100486331655.68995136651
58564000566291.939237156-2291.93923715572
59558000552147.9110585495852.08894145116
60575000559568.55350180715431.4464981928

\begin{tabular}{lllllllll}
\hline
Interpolation Forecasts of Exponential Smoothing \tabularnewline
t & Observed & Fitted & Residuals \tabularnewline
13 & 593000 & 592132.745726496 & 867.254273504019 \tabularnewline
14 & 590000 & 589747.35477792 & 252.645222079707 \tabularnewline
15 & 580000 & 580369.302629229 & -369.30262922938 \tabularnewline
16 & 574000 & 575361.13989045 & -1361.13989045052 \tabularnewline
17 & 573000 & 575153.86042317 & -2153.86042317026 \tabularnewline
18 & 573000 & 575383.976318032 & -2383.97631803178 \tabularnewline
19 & 620000 & 613437.158107581 & 6562.84189241868 \tabularnewline
20 & 626000 & 625399.695969745 & 600.304030255415 \tabularnewline
21 & 620000 & 625210.123494242 & -5210.12349424232 \tabularnewline
22 & 588000 & 604689.459805047 & -16689.4598050467 \tabularnewline
23 & 566000 & 569994.967986863 & -3994.96798686287 \tabularnewline
24 & 557000 & 560473.666012373 & -3473.66601237305 \tabularnewline
25 & 561000 & 544693.495883168 & 16306.5041168323 \tabularnewline
26 & 549000 & 547271.496389238 & 1728.50361076160 \tabularnewline
27 & 532000 & 534911.057225064 & -2911.05722506379 \tabularnewline
28 & 526000 & 523457.428379339 & 2542.57162066118 \tabularnewline
29 & 511000 & 522144.463208206 & -11144.4632082059 \tabularnewline
30 & 499000 & 510554.68054853 & -11554.6805485296 \tabularnewline
31 & 555000 & 537108.32821396 & 17891.6717860395 \tabularnewline
32 & 565000 & 548046.262426642 & 16953.7375733579 \tabularnewline
33 & 542000 & 555623.362675674 & -13623.3626756745 \tabularnewline
34 & 527000 & 522708.373081629 & 4291.6269183713 \tabularnewline
35 & 510000 & 510252.984302774 & -252.984302773606 \tabularnewline
36 & 514000 & 509031.283994896 & 4968.71600510419 \tabularnewline
37 & 517000 & 514929.554999308 & 2070.44500069227 \tabularnewline
38 & 508000 & 506949.21348631 & 1050.78651369008 \tabularnewline
39 & 493000 & 495925.352070624 & -2925.35207062418 \tabularnewline
40 & 490000 & 490185.839858291 & -185.839858290623 \tabularnewline
41 & 469000 & 484445.213622628 & -15445.2136226278 \tabularnewline
42 & 478000 & 471215.947426457 & 6784.05257354304 \tabularnewline
43 & 528000 & 527994.950030993 & 5.04996900691185 \tabularnewline
44 & 534000 & 529014.912166739 & 4985.08783326135 \tabularnewline
45 & 518000 & 514405.144774376 & 3594.85522562399 \tabularnewline
46 & 506000 & 502093.296460545 & 3906.70353945548 \tabularnewline
47 & 502000 & 490588.634126016 & 11411.3658739841 \tabularnewline
48 & 516000 & 505523.863839219 & 10476.1361607809 \tabularnewline
49 & 528000 & 522563.614712935 & 5436.38528706529 \tabularnewline
50 & 533000 & 526339.601461736 & 6660.39853826433 \tabularnewline
51 & 536000 & 529216.053822505 & 6783.94617749495 \tabularnewline
52 & 537000 & 545885.557147777 & -8885.5571477774 \tabularnewline
53 & 524000 & 541280.575902911 & -17280.5759029109 \tabularnewline
54 & 536000 & 547491.078516169 & -11491.0785161685 \tabularnewline
55 & 587000 & 595956.258313888 & -8956.25831388799 \tabularnewline
56 & 597000 & 595823.509934264 & 1176.49006573646 \tabularnewline
57 & 581000 & 579344.310048633 & 1655.68995136651 \tabularnewline
58 & 564000 & 566291.939237156 & -2291.93923715572 \tabularnewline
59 & 558000 & 552147.911058549 & 5852.08894145116 \tabularnewline
60 & 575000 & 559568.553501807 & 15431.4464981928 \tabularnewline
\hline
\end{tabular}
%Source: https://freestatistics.org/blog/index.php?pk=117463&T=2

[TABLE]
[ROW][C]Interpolation Forecasts of Exponential Smoothing[/C][/ROW]
[ROW][C]t[/C][C]Observed[/C][C]Fitted[/C][C]Residuals[/C][/ROW]
[ROW][C]13[/C][C]593000[/C][C]592132.745726496[/C][C]867.254273504019[/C][/ROW]
[ROW][C]14[/C][C]590000[/C][C]589747.35477792[/C][C]252.645222079707[/C][/ROW]
[ROW][C]15[/C][C]580000[/C][C]580369.302629229[/C][C]-369.30262922938[/C][/ROW]
[ROW][C]16[/C][C]574000[/C][C]575361.13989045[/C][C]-1361.13989045052[/C][/ROW]
[ROW][C]17[/C][C]573000[/C][C]575153.86042317[/C][C]-2153.86042317026[/C][/ROW]
[ROW][C]18[/C][C]573000[/C][C]575383.976318032[/C][C]-2383.97631803178[/C][/ROW]
[ROW][C]19[/C][C]620000[/C][C]613437.158107581[/C][C]6562.84189241868[/C][/ROW]
[ROW][C]20[/C][C]626000[/C][C]625399.695969745[/C][C]600.304030255415[/C][/ROW]
[ROW][C]21[/C][C]620000[/C][C]625210.123494242[/C][C]-5210.12349424232[/C][/ROW]
[ROW][C]22[/C][C]588000[/C][C]604689.459805047[/C][C]-16689.4598050467[/C][/ROW]
[ROW][C]23[/C][C]566000[/C][C]569994.967986863[/C][C]-3994.96798686287[/C][/ROW]
[ROW][C]24[/C][C]557000[/C][C]560473.666012373[/C][C]-3473.66601237305[/C][/ROW]
[ROW][C]25[/C][C]561000[/C][C]544693.495883168[/C][C]16306.5041168323[/C][/ROW]
[ROW][C]26[/C][C]549000[/C][C]547271.496389238[/C][C]1728.50361076160[/C][/ROW]
[ROW][C]27[/C][C]532000[/C][C]534911.057225064[/C][C]-2911.05722506379[/C][/ROW]
[ROW][C]28[/C][C]526000[/C][C]523457.428379339[/C][C]2542.57162066118[/C][/ROW]
[ROW][C]29[/C][C]511000[/C][C]522144.463208206[/C][C]-11144.4632082059[/C][/ROW]
[ROW][C]30[/C][C]499000[/C][C]510554.68054853[/C][C]-11554.6805485296[/C][/ROW]
[ROW][C]31[/C][C]555000[/C][C]537108.32821396[/C][C]17891.6717860395[/C][/ROW]
[ROW][C]32[/C][C]565000[/C][C]548046.262426642[/C][C]16953.7375733579[/C][/ROW]
[ROW][C]33[/C][C]542000[/C][C]555623.362675674[/C][C]-13623.3626756745[/C][/ROW]
[ROW][C]34[/C][C]527000[/C][C]522708.373081629[/C][C]4291.6269183713[/C][/ROW]
[ROW][C]35[/C][C]510000[/C][C]510252.984302774[/C][C]-252.984302773606[/C][/ROW]
[ROW][C]36[/C][C]514000[/C][C]509031.283994896[/C][C]4968.71600510419[/C][/ROW]
[ROW][C]37[/C][C]517000[/C][C]514929.554999308[/C][C]2070.44500069227[/C][/ROW]
[ROW][C]38[/C][C]508000[/C][C]506949.21348631[/C][C]1050.78651369008[/C][/ROW]
[ROW][C]39[/C][C]493000[/C][C]495925.352070624[/C][C]-2925.35207062418[/C][/ROW]
[ROW][C]40[/C][C]490000[/C][C]490185.839858291[/C][C]-185.839858290623[/C][/ROW]
[ROW][C]41[/C][C]469000[/C][C]484445.213622628[/C][C]-15445.2136226278[/C][/ROW]
[ROW][C]42[/C][C]478000[/C][C]471215.947426457[/C][C]6784.05257354304[/C][/ROW]
[ROW][C]43[/C][C]528000[/C][C]527994.950030993[/C][C]5.04996900691185[/C][/ROW]
[ROW][C]44[/C][C]534000[/C][C]529014.912166739[/C][C]4985.08783326135[/C][/ROW]
[ROW][C]45[/C][C]518000[/C][C]514405.144774376[/C][C]3594.85522562399[/C][/ROW]
[ROW][C]46[/C][C]506000[/C][C]502093.296460545[/C][C]3906.70353945548[/C][/ROW]
[ROW][C]47[/C][C]502000[/C][C]490588.634126016[/C][C]11411.3658739841[/C][/ROW]
[ROW][C]48[/C][C]516000[/C][C]505523.863839219[/C][C]10476.1361607809[/C][/ROW]
[ROW][C]49[/C][C]528000[/C][C]522563.614712935[/C][C]5436.38528706529[/C][/ROW]
[ROW][C]50[/C][C]533000[/C][C]526339.601461736[/C][C]6660.39853826433[/C][/ROW]
[ROW][C]51[/C][C]536000[/C][C]529216.053822505[/C][C]6783.94617749495[/C][/ROW]
[ROW][C]52[/C][C]537000[/C][C]545885.557147777[/C][C]-8885.5571477774[/C][/ROW]
[ROW][C]53[/C][C]524000[/C][C]541280.575902911[/C][C]-17280.5759029109[/C][/ROW]
[ROW][C]54[/C][C]536000[/C][C]547491.078516169[/C][C]-11491.0785161685[/C][/ROW]
[ROW][C]55[/C][C]587000[/C][C]595956.258313888[/C][C]-8956.25831388799[/C][/ROW]
[ROW][C]56[/C][C]597000[/C][C]595823.509934264[/C][C]1176.49006573646[/C][/ROW]
[ROW][C]57[/C][C]581000[/C][C]579344.310048633[/C][C]1655.68995136651[/C][/ROW]
[ROW][C]58[/C][C]564000[/C][C]566291.939237156[/C][C]-2291.93923715572[/C][/ROW]
[ROW][C]59[/C][C]558000[/C][C]552147.911058549[/C][C]5852.08894145116[/C][/ROW]
[ROW][C]60[/C][C]575000[/C][C]559568.553501807[/C][C]15431.4464981928[/C][/ROW]
[/TABLE]
Source: https://freestatistics.org/blog/index.php?pk=117463&T=2

Globally Unique Identifier (entire table): ba.freestatistics.org/blog/index.php?pk=117463&T=2

As an alternative you can also use a QR Code:  

The GUIDs for individual cells are displayed in the table below:

Interpolation Forecasts of Exponential Smoothing
tObservedFittedResiduals
13593000592132.745726496867.254273504019
14590000589747.35477792252.645222079707
15580000580369.302629229-369.30262922938
16574000575361.13989045-1361.13989045052
17573000575153.86042317-2153.86042317026
18573000575383.976318032-2383.97631803178
19620000613437.1581075816562.84189241868
20626000625399.695969745600.304030255415
21620000625210.123494242-5210.12349424232
22588000604689.459805047-16689.4598050467
23566000569994.967986863-3994.96798686287
24557000560473.666012373-3473.66601237305
25561000544693.49588316816306.5041168323
26549000547271.4963892381728.50361076160
27532000534911.057225064-2911.05722506379
28526000523457.4283793392542.57162066118
29511000522144.463208206-11144.4632082059
30499000510554.68054853-11554.6805485296
31555000537108.3282139617891.6717860395
32565000548046.26242664216953.7375733579
33542000555623.362675674-13623.3626756745
34527000522708.3730816294291.6269183713
35510000510252.984302774-252.984302773606
36514000509031.2839948964968.71600510419
37517000514929.5549993082070.44500069227
38508000506949.213486311050.78651369008
39493000495925.352070624-2925.35207062418
40490000490185.839858291-185.839858290623
41469000484445.213622628-15445.2136226278
42478000471215.9474264576784.05257354304
43528000527994.9500309935.04996900691185
44534000529014.9121667394985.08783326135
45518000514405.1447743763594.85522562399
46506000502093.2964605453906.70353945548
47502000490588.63412601611411.3658739841
48516000505523.86383921910476.1361607809
49528000522563.6147129355436.38528706529
50533000526339.6014617366660.39853826433
51536000529216.0538225056783.94617749495
52537000545885.557147777-8885.5571477774
53524000541280.575902911-17280.5759029109
54536000547491.078516169-11491.0785161685
55587000595956.258313888-8956.25831388799
56597000595823.5099342641176.49006573646
57581000579344.3100486331655.68995136651
58564000566291.939237156-2291.93923715572
59558000552147.9110585495852.08894145116
60575000559568.55350180715431.4464981928


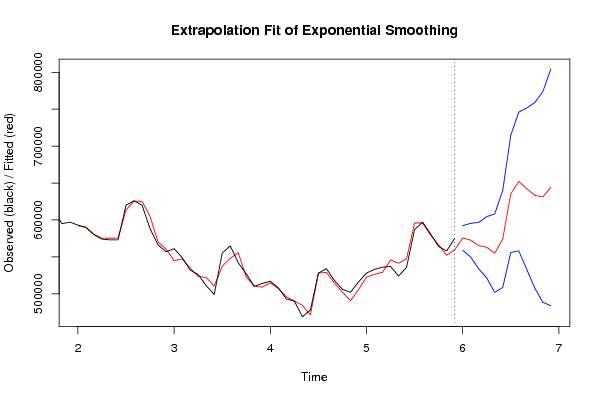
Extrapolation Forecasts of Exponential Smoothing
tForecast95% Lower Bound95% Upper Bound
61575566.200684589559032.197710462592100.203658715
62572586.289216197549741.525218819595431.053213574
63565214.804157095533833.35864091596596.249673281
64562973.061323415521400.700173436604545.422473395
65554906.104078392501817.180334731607995.027822054
66574343.895694665508606.043005512640081.748383818
67635243.653842779555849.020001359714638.2876842
68652122.352250302558150.473692804746094.2308078
69642301.616333532532897.613563598751705.619103467
70633295.654209262507656.385723422758934.922695102
71631154.886973796488519.561174709773790.212772884
72644177.258714143483820.720718289804533.796709998

\begin{tabular}{lllllllll}
\hline
Extrapolation Forecasts of Exponential Smoothing \tabularnewline
t & Forecast & 95% Lower Bound & 95% Upper Bound \tabularnewline
61 & 575566.200684589 & 559032.197710462 & 592100.203658715 \tabularnewline
62 & 572586.289216197 & 549741.525218819 & 595431.053213574 \tabularnewline
63 & 565214.804157095 & 533833.35864091 & 596596.249673281 \tabularnewline
64 & 562973.061323415 & 521400.700173436 & 604545.422473395 \tabularnewline
65 & 554906.104078392 & 501817.180334731 & 607995.027822054 \tabularnewline
66 & 574343.895694665 & 508606.043005512 & 640081.748383818 \tabularnewline
67 & 635243.653842779 & 555849.020001359 & 714638.2876842 \tabularnewline
68 & 652122.352250302 & 558150.473692804 & 746094.2308078 \tabularnewline
69 & 642301.616333532 & 532897.613563598 & 751705.619103467 \tabularnewline
70 & 633295.654209262 & 507656.385723422 & 758934.922695102 \tabularnewline
71 & 631154.886973796 & 488519.561174709 & 773790.212772884 \tabularnewline
72 & 644177.258714143 & 483820.720718289 & 804533.796709998 \tabularnewline
\hline
\end{tabular}
%Source: https://freestatistics.org/blog/index.php?pk=117463&T=3

[TABLE]
[ROW][C]Extrapolation Forecasts of Exponential Smoothing[/C][/ROW]
[ROW][C]t[/C][C]Forecast[/C][C]95% Lower Bound[/C][C]95% Upper Bound[/C][/ROW]
[ROW][C]61[/C][C]575566.200684589[/C][C]559032.197710462[/C][C]592100.203658715[/C][/ROW]
[ROW][C]62[/C][C]572586.289216197[/C][C]549741.525218819[/C][C]595431.053213574[/C][/ROW]
[ROW][C]63[/C][C]565214.804157095[/C][C]533833.35864091[/C][C]596596.249673281[/C][/ROW]
[ROW][C]64[/C][C]562973.061323415[/C][C]521400.700173436[/C][C]604545.422473395[/C][/ROW]
[ROW][C]65[/C][C]554906.104078392[/C][C]501817.180334731[/C][C]607995.027822054[/C][/ROW]
[ROW][C]66[/C][C]574343.895694665[/C][C]508606.043005512[/C][C]640081.748383818[/C][/ROW]
[ROW][C]67[/C][C]635243.653842779[/C][C]555849.020001359[/C][C]714638.2876842[/C][/ROW]
[ROW][C]68[/C][C]652122.352250302[/C][C]558150.473692804[/C][C]746094.2308078[/C][/ROW]
[ROW][C]69[/C][C]642301.616333532[/C][C]532897.613563598[/C][C]751705.619103467[/C][/ROW]
[ROW][C]70[/C][C]633295.654209262[/C][C]507656.385723422[/C][C]758934.922695102[/C][/ROW]
[ROW][C]71[/C][C]631154.886973796[/C][C]488519.561174709[/C][C]773790.212772884[/C][/ROW]
[ROW][C]72[/C][C]644177.258714143[/C][C]483820.720718289[/C][C]804533.796709998[/C][/ROW]
[/TABLE]
Source: https://freestatistics.org/blog/index.php?pk=117463&T=3

Globally Unique Identifier (entire table): ba.freestatistics.org/blog/index.php?pk=117463&T=3

As an alternative you can also use a QR Code:  

The GUIDs for individual cells are displayed in the table below:

Extrapolation Forecasts of Exponential Smoothing
tForecast95% Lower Bound95% Upper Bound
61575566.200684589559032.197710462592100.203658715
62572586.289216197549741.525218819595431.053213574
63565214.804157095533833.35864091596596.249673281
64562973.061323415521400.700173436604545.422473395
65554906.104078392501817.180334731607995.027822054
66574343.895694665508606.043005512640081.748383818
67635243.653842779555849.020001359714638.2876842
68652122.352250302558150.473692804746094.2308078
69642301.616333532532897.613563598751705.619103467
70633295.654209262507656.385723422758934.922695102
71631154.886973796488519.561174709773790.212772884
72644177.258714143483820.720718289804533.796709998


Parameters (Session):
par1 = 12 ; par2 = Triple ; par3 = additive ;
Parameters (R input):
par1 = 12 ; par2 = Triple ; par3 = additive ;
R code (references can be found in the software module):
par1 <- as.numeric(par1)
if (par2 == 'Single') K <- 1
if (par2 == 'Double') K <- 2
if (par2 == 'Triple') K <- par1
nx <- length(x)
nxmK <- nx - K
x <- ts(x, frequency = par1)
if (par2 == 'Single') fit <- HoltWinters(x, gamma=F, beta=F)
if (par2 == 'Double') fit <- HoltWinters(x, gamma=F)
if (par2 == 'Triple') fit <- HoltWinters(x, seasonal=par3)
fit
myresid <- x - fit$fitted[,'xhat']
bitmap(file='test1.png')
op <- par(mfrow=c(2,1))
plot(fit,ylab='Observed (black) / Fitted (red)',main='Interpolation Fit of Exponential Smoothing')
plot(myresid,ylab='Residuals',main='Interpolation Prediction Errors')
par(op)
dev.off()
bitmap(file='test2.png')
p <- predict(fit, par1, prediction.interval=TRUE)
np <- length(p[,1])
plot(fit,p,ylab='Observed (black) / Fitted (red)',main='Extrapolation Fit of Exponential Smoothing')
dev.off()
bitmap(file='test3.png')
op <- par(mfrow = c(2,2))
acf(as.numeric(myresid),lag.max = nx/2,main='Residual ACF')
spectrum(myresid,main='Residals Periodogram')
cpgram(myresid,main='Residal Cumulative Periodogram')
qqnorm(myresid,main='Residual Normal QQ Plot')
qqline(myresid)
par(op)
dev.off()
load(file='createtable')
a<-table.start()
a<-table.row.start(a)
a<-table.element(a,'Estimated Parameters of Exponential Smoothing',2,TRUE)
a<-table.row.end(a)
a<-table.row.start(a)
a<-table.element(a,'Parameter',header=TRUE)
a<-table.element(a,'Value',header=TRUE)
a<-table.row.end(a)
a<-table.row.start(a)
a<-table.element(a,'alpha',header=TRUE)
a<-table.element(a,fit$alpha)
a<-table.row.end(a)
a<-table.row.start(a)
a<-table.element(a,'beta',header=TRUE)
a<-table.element(a,fit$beta)
a<-table.row.end(a)
a<-table.row.start(a)
a<-table.element(a,'gamma',header=TRUE)
a<-table.element(a,fit$gamma)
a<-table.row.end(a)
a<-table.end(a)
table.save(a,file='mytable.tab')
a<-table.start()
a<-table.row.start(a)
a<-table.element(a,'Interpolation Forecasts of Exponential Smoothing',4,TRUE)
a<-table.row.end(a)
a<-table.row.start(a)
a<-table.element(a,'t',header=TRUE)
a<-table.element(a,'Observed',header=TRUE)
a<-table.element(a,'Fitted',header=TRUE)
a<-table.element(a,'Residuals',header=TRUE)
a<-table.row.end(a)
for (i in 1:nxmK) {
a<-table.row.start(a)
a<-table.element(a,i+K,header=TRUE)
a<-table.element(a,x[i+K])
a<-table.element(a,fit$fitted[i,'xhat'])
a<-table.element(a,myresid[i])
a<-table.row.end(a)
}
a<-table.end(a)
table.save(a,file='mytable1.tab')
a<-table.start()
a<-table.row.start(a)
a<-table.element(a,'Extrapolation Forecasts of Exponential Smoothing',4,TRUE)
a<-table.row.end(a)
a<-table.row.start(a)
a<-table.element(a,'t',header=TRUE)
a<-table.element(a,'Forecast',header=TRUE)
a<-table.element(a,'95% Lower Bound',header=TRUE)
a<-table.element(a,'95% Upper Bound',header=TRUE)
a<-table.row.end(a)
for (i in 1:np) {
a<-table.row.start(a)
a<-table.element(a,nx+i,header=TRUE)
a<-table.element(a,p[i,'fit'])
a<-table.element(a,p[i,'lwr'])
a<-table.element(a,p[i,'upr'])
a<-table.row.end(a)
}
a<-table.end(a)
table.save(a,file='mytable2.tab')