Free Statistics

of Irreproducible Research!

Author's title

Author*The author of this computation has been verified*
R Software Modulerwasp_arimaforecasting.wasp
Title produced by softwareARIMA Forecasting
Date of computationTue, 21 Dec 2010 18:52:08 +0000
Cite this page as followsStatistical Computations at FreeStatistics.org, Office for Research Development and Education, URL https://freestatistics.org/blog/index.php?v=date/2010/Dec/21/t1292957417n5lp0k02hm05lvm.htm/, Retrieved Sun, 19 May 2024 05:55:18 +0000
Statistical Computations at FreeStatistics.org, Office for Research Development and Education, URL https://freestatistics.org/blog/index.php?pk=113824, Retrieved Sun, 19 May 2024 05:55:18 +0000
QR Codes:

Original text written by user:
IsPrivate?No (this computation is public)
User-defined keywords
Estimated Impact107
Family? (F = Feedback message, R = changed R code, M = changed R Module, P = changed Parameters, D = changed Data)
-     [Univariate Data Series] [data set] [2008-12-01 19:54:57] [b98453cac15ba1066b407e146608df68]
- RMP   [Standard Deviation-Mean Plot] [Unemployment] [2010-11-29 10:34:47] [b98453cac15ba1066b407e146608df68]
- RMP     [ARIMA Forecasting] [Unemployment] [2010-11-29 20:46:45] [b98453cac15ba1066b407e146608df68]
-   PD        [ARIMA Forecasting] [paper - forecast ...] [2010-12-21 18:52:08] [5398da98f4f83c6a353e4d3806d4bcaa] [Current]
-   PD          [ARIMA Forecasting] [paper - arima for...] [2010-12-22 19:37:44] [9894f466352df31a128e82ec8d720241]
Feedback Forum

Post a new message
Dataseries X:
631 923
654 294
671 833
586 840
600 969
625 568
558 110
630 577
628 654
603 184
656 255
600 730
670 326
678 423
641 502
625 311
628 177
589 767
582 471
636 248
599 885
621 694
637 406
595 994
696 308
674 201
648 861
649 605
672 392
598 396
613 177
638 104
615 632
634 465
638 686
604 243
706 669
677 185
644 328
644 825
605 707
600 136
612 166
599 659
634 210
618 234
613 576
627 200
668 973
651 479
619 661
644 260
579 936
601 752
595 376
588 902
634 341
594 305
606 200
610 926
633 685
639 696
659 451
593 248
606 677
599 434
569 578
629 873
613 438
604 172
658 328
612 633
707 372
739 770
777 535
685 030
730 234
714 154
630 872
719 492
677 023
679 272
718 317
645 672


Summary of computational transaction
Raw Inputview raw input (R code)
Raw Outputview raw output of R engine
Computing time5 seconds
R Server'RServer@AstonUniversity' @ vre.aston.ac.uk

\begin{tabular}{lllllllll}
\hline
Summary of computational transaction \tabularnewline
Raw Input & view raw input (R code)  \tabularnewline
Raw Output & view raw output of R engine  \tabularnewline
Computing time & 5 seconds \tabularnewline
R Server & 'RServer@AstonUniversity' @ vre.aston.ac.uk \tabularnewline
\hline
\end{tabular}
%Source: https://freestatistics.org/blog/index.php?pk=113824&T=0

[TABLE]
[ROW][C]Summary of computational transaction[/C][/ROW]
[ROW][C]Raw Input[/C][C]view raw input (R code) [/C][/ROW]
[ROW][C]Raw Output[/C][C]view raw output of R engine [/C][/ROW]
[ROW][C]Computing time[/C][C]5 seconds[/C][/ROW]
[ROW][C]R Server[/C][C]'RServer@AstonUniversity' @ vre.aston.ac.uk[/C][/ROW]
[/TABLE]
Source: https://freestatistics.org/blog/index.php?pk=113824&T=0

Globally Unique Identifier (entire table): ba.freestatistics.org/blog/index.php?pk=113824&T=0

As an alternative you can also use a QR Code:  

The GUIDs for individual cells are displayed in the table below:

Summary of computational transaction
Raw Inputview raw input (R code)
Raw Outputview raw output of R engine
Computing time5 seconds
R Server'RServer@AstonUniversity' @ vre.aston.ac.uk


Univariate ARIMA Extrapolation Forecast
timeY[t]F[t]95% LB95% UBp-value(H0: Y[t] = F[t])P(F[t]>Y[t-1])P(F[t]>Y[t-s])P(F[t]>Y[72])
60610926-------
61633685-------
62639696-------
63659451-------
64593248-------
65606677-------
66599434-------
67569578-------
68629873-------
69613438-------
70604172-------
71658328-------
72612633-------
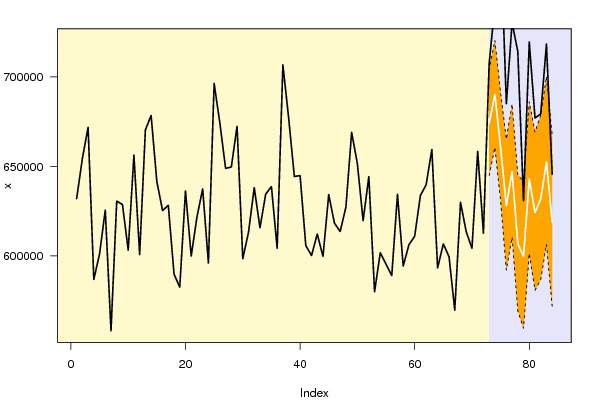
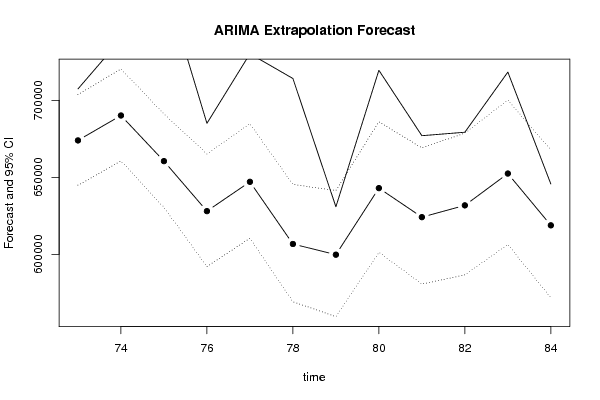
73707372673956.266644854.0711703700.73740.013810.9961
74739770690139.9254660569.4695720357.83136e-040.13180.99951
75777535660512.0934630513.906691207.4107000.5270.9989
76685030628050.4084592001.4516665164.73880.001300.9670.7922
77730234647080.2993610422.3121684807.14600.02430.98210.9632
78714154606714.9049569251.6187645371.9786000.6440.3821
79630872599772.0123559538.352641402.39540.071600.92240.2724
80719492642989.1582601307.5776686067.38462e-040.70930.72470.9164
81677023624134.2791580711.6953669122.31910.010600.67940.6918
82679272631786.5056586610.1925678638.46430.02350.02920.8760.7885
83718317652446.635606424.6402700151.6710.00340.13520.40450.9491
84645672618824.4346571818.3501667687.02350.140800.59810.5981

\begin{tabular}{lllllllll}
\hline
Univariate ARIMA Extrapolation Forecast \tabularnewline
time & Y[t] & F[t] & 95% LB & 95% UB & p-value(H0: Y[t] = F[t]) & P(F[t]>Y[t-1]) & P(F[t]>Y[t-s]) & P(F[t]>Y[72]) \tabularnewline
60 & 610926 & - & - & - & - & - & - & - \tabularnewline
61 & 633685 & - & - & - & - & - & - & - \tabularnewline
62 & 639696 & - & - & - & - & - & - & - \tabularnewline
63 & 659451 & - & - & - & - & - & - & - \tabularnewline
64 & 593248 & - & - & - & - & - & - & - \tabularnewline
65 & 606677 & - & - & - & - & - & - & - \tabularnewline
66 & 599434 & - & - & - & - & - & - & - \tabularnewline
67 & 569578 & - & - & - & - & - & - & - \tabularnewline
68 & 629873 & - & - & - & - & - & - & - \tabularnewline
69 & 613438 & - & - & - & - & - & - & - \tabularnewline
70 & 604172 & - & - & - & - & - & - & - \tabularnewline
71 & 658328 & - & - & - & - & - & - & - \tabularnewline
72 & 612633 & - & - & - & - & - & - & - \tabularnewline
73 & 707372 & 673956.266 & 644854.0711 & 703700.7374 & 0.0138 & 1 & 0.996 & 1 \tabularnewline
74 & 739770 & 690139.9254 & 660569.4695 & 720357.8313 & 6e-04 & 0.1318 & 0.9995 & 1 \tabularnewline
75 & 777535 & 660512.0934 & 630513.906 & 691207.4107 & 0 & 0 & 0.527 & 0.9989 \tabularnewline
76 & 685030 & 628050.4084 & 592001.4516 & 665164.7388 & 0.0013 & 0 & 0.967 & 0.7922 \tabularnewline
77 & 730234 & 647080.2993 & 610422.3121 & 684807.146 & 0 & 0.0243 & 0.9821 & 0.9632 \tabularnewline
78 & 714154 & 606714.9049 & 569251.6187 & 645371.9786 & 0 & 0 & 0.644 & 0.3821 \tabularnewline
79 & 630872 & 599772.0123 & 559538.352 & 641402.3954 & 0.0716 & 0 & 0.9224 & 0.2724 \tabularnewline
80 & 719492 & 642989.1582 & 601307.5776 & 686067.3846 & 2e-04 & 0.7093 & 0.7247 & 0.9164 \tabularnewline
81 & 677023 & 624134.2791 & 580711.6953 & 669122.3191 & 0.0106 & 0 & 0.6794 & 0.6918 \tabularnewline
82 & 679272 & 631786.5056 & 586610.1925 & 678638.4643 & 0.0235 & 0.0292 & 0.876 & 0.7885 \tabularnewline
83 & 718317 & 652446.635 & 606424.6402 & 700151.671 & 0.0034 & 0.1352 & 0.4045 & 0.9491 \tabularnewline
84 & 645672 & 618824.4346 & 571818.3501 & 667687.0235 & 0.1408 & 0 & 0.5981 & 0.5981 \tabularnewline
\hline
\end{tabular}
%Source: https://freestatistics.org/blog/index.php?pk=113824&T=1

[TABLE]
[ROW][C]Univariate ARIMA Extrapolation Forecast[/C][/ROW]
[ROW][C]time[/C][C]Y[t][/C][C]F[t][/C][C]95% LB[/C][C]95% UB[/C][C]p-value(H0: Y[t] = F[t])[/C][C]P(F[t]>Y[t-1])[/C][C]P(F[t]>Y[t-s])[/C][C]P(F[t]>Y[72])[/C][/ROW]
[ROW][C]60[/C][C]610926[/C][C]-[/C][C]-[/C][C]-[/C][C]-[/C][C]-[/C][C]-[/C][C]-[/C][/ROW]
[ROW][C]61[/C][C]633685[/C][C]-[/C][C]-[/C][C]-[/C][C]-[/C][C]-[/C][C]-[/C][C]-[/C][/ROW]
[ROW][C]62[/C][C]639696[/C][C]-[/C][C]-[/C][C]-[/C][C]-[/C][C]-[/C][C]-[/C][C]-[/C][/ROW]
[ROW][C]63[/C][C]659451[/C][C]-[/C][C]-[/C][C]-[/C][C]-[/C][C]-[/C][C]-[/C][C]-[/C][/ROW]
[ROW][C]64[/C][C]593248[/C][C]-[/C][C]-[/C][C]-[/C][C]-[/C][C]-[/C][C]-[/C][C]-[/C][/ROW]
[ROW][C]65[/C][C]606677[/C][C]-[/C][C]-[/C][C]-[/C][C]-[/C][C]-[/C][C]-[/C][C]-[/C][/ROW]
[ROW][C]66[/C][C]599434[/C][C]-[/C][C]-[/C][C]-[/C][C]-[/C][C]-[/C][C]-[/C][C]-[/C][/ROW]
[ROW][C]67[/C][C]569578[/C][C]-[/C][C]-[/C][C]-[/C][C]-[/C][C]-[/C][C]-[/C][C]-[/C][/ROW]
[ROW][C]68[/C][C]629873[/C][C]-[/C][C]-[/C][C]-[/C][C]-[/C][C]-[/C][C]-[/C][C]-[/C][/ROW]
[ROW][C]69[/C][C]613438[/C][C]-[/C][C]-[/C][C]-[/C][C]-[/C][C]-[/C][C]-[/C][C]-[/C][/ROW]
[ROW][C]70[/C][C]604172[/C][C]-[/C][C]-[/C][C]-[/C][C]-[/C][C]-[/C][C]-[/C][C]-[/C][/ROW]
[ROW][C]71[/C][C]658328[/C][C]-[/C][C]-[/C][C]-[/C][C]-[/C][C]-[/C][C]-[/C][C]-[/C][/ROW]
[ROW][C]72[/C][C]612633[/C][C]-[/C][C]-[/C][C]-[/C][C]-[/C][C]-[/C][C]-[/C][C]-[/C][/ROW]
[ROW][C]73[/C][C]707372[/C][C]673956.266[/C][C]644854.0711[/C][C]703700.7374[/C][C]0.0138[/C][C]1[/C][C]0.996[/C][C]1[/C][/ROW]
[ROW][C]74[/C][C]739770[/C][C]690139.9254[/C][C]660569.4695[/C][C]720357.8313[/C][C]6e-04[/C][C]0.1318[/C][C]0.9995[/C][C]1[/C][/ROW]
[ROW][C]75[/C][C]777535[/C][C]660512.0934[/C][C]630513.906[/C][C]691207.4107[/C][C]0[/C][C]0[/C][C]0.527[/C][C]0.9989[/C][/ROW]
[ROW][C]76[/C][C]685030[/C][C]628050.4084[/C][C]592001.4516[/C][C]665164.7388[/C][C]0.0013[/C][C]0[/C][C]0.967[/C][C]0.7922[/C][/ROW]
[ROW][C]77[/C][C]730234[/C][C]647080.2993[/C][C]610422.3121[/C][C]684807.146[/C][C]0[/C][C]0.0243[/C][C]0.9821[/C][C]0.9632[/C][/ROW]
[ROW][C]78[/C][C]714154[/C][C]606714.9049[/C][C]569251.6187[/C][C]645371.9786[/C][C]0[/C][C]0[/C][C]0.644[/C][C]0.3821[/C][/ROW]
[ROW][C]79[/C][C]630872[/C][C]599772.0123[/C][C]559538.352[/C][C]641402.3954[/C][C]0.0716[/C][C]0[/C][C]0.9224[/C][C]0.2724[/C][/ROW]
[ROW][C]80[/C][C]719492[/C][C]642989.1582[/C][C]601307.5776[/C][C]686067.3846[/C][C]2e-04[/C][C]0.7093[/C][C]0.7247[/C][C]0.9164[/C][/ROW]
[ROW][C]81[/C][C]677023[/C][C]624134.2791[/C][C]580711.6953[/C][C]669122.3191[/C][C]0.0106[/C][C]0[/C][C]0.6794[/C][C]0.6918[/C][/ROW]
[ROW][C]82[/C][C]679272[/C][C]631786.5056[/C][C]586610.1925[/C][C]678638.4643[/C][C]0.0235[/C][C]0.0292[/C][C]0.876[/C][C]0.7885[/C][/ROW]
[ROW][C]83[/C][C]718317[/C][C]652446.635[/C][C]606424.6402[/C][C]700151.671[/C][C]0.0034[/C][C]0.1352[/C][C]0.4045[/C][C]0.9491[/C][/ROW]
[ROW][C]84[/C][C]645672[/C][C]618824.4346[/C][C]571818.3501[/C][C]667687.0235[/C][C]0.1408[/C][C]0[/C][C]0.5981[/C][C]0.5981[/C][/ROW]
[/TABLE]
Source: https://freestatistics.org/blog/index.php?pk=113824&T=1

Globally Unique Identifier (entire table): ba.freestatistics.org/blog/index.php?pk=113824&T=1

As an alternative you can also use a QR Code:  

The GUIDs for individual cells are displayed in the table below:

Univariate ARIMA Extrapolation Forecast
timeY[t]F[t]95% LB95% UBp-value(H0: Y[t] = F[t])P(F[t]>Y[t-1])P(F[t]>Y[t-s])P(F[t]>Y[72])
60610926-------
61633685-------
62639696-------
63659451-------
64593248-------
65606677-------
66599434-------
67569578-------
68629873-------
69613438-------
70604172-------
71658328-------
72612633-------
73707372673956.266644854.0711703700.73740.013810.9961
74739770690139.9254660569.4695720357.83136e-040.13180.99951
75777535660512.0934630513.906691207.4107000.5270.9989
76685030628050.4084592001.4516665164.73880.001300.9670.7922
77730234647080.2993610422.3121684807.14600.02430.98210.9632
78714154606714.9049569251.6187645371.9786000.6440.3821
79630872599772.0123559538.352641402.39540.071600.92240.2724
80719492642989.1582601307.5776686067.38462e-040.70930.72470.9164
81677023624134.2791580711.6953669122.31910.010600.67940.6918
82679272631786.5056586610.1925678638.46430.02350.02920.8760.7885
83718317652446.635606424.6402700151.6710.00340.13520.40450.9491
84645672618824.4346571818.3501667687.02350.140800.59810.5981


Univariate ARIMA Extrapolation Forecast Performance
time% S.E.PEMAPESq.EMSERMSE
730.02250.049601116611280.872700
740.02230.07190.06072463144302.25611789877791.564442306.9473
750.02370.17720.099613694360663.76155758038748.963475881.7419
760.03020.09070.09733246673861.25255130197527.035771625.3972
770.02970.12850.10366914537945.77925487065610.784474074.7299
780.03250.17710.115811543159153.7686496414534.61580600.3383
790.03540.05190.1067967209232.94995706528062.948675541.5651
800.03420.1190.10825852684804.20715724797655.605975662.3926
810.03680.08470.10562797216794.57585399510893.269273481.3643
820.03780.07520.10262254872182.56545085047022.198871309.5156
830.03730.1010.10244338904984.86725017215927.89670832.3085
840.04030.04340.0975720791768.354659180581.267168258.1906

\begin{tabular}{lllllllll}
\hline
Univariate ARIMA Extrapolation Forecast Performance \tabularnewline
time & % S.E. & PE & MAPE & Sq.E & MSE & RMSE \tabularnewline
73 & 0.0225 & 0.0496 & 0 & 1116611280.8727 & 0 & 0 \tabularnewline
74 & 0.0223 & 0.0719 & 0.0607 & 2463144302.2561 & 1789877791.5644 & 42306.9473 \tabularnewline
75 & 0.0237 & 0.1772 & 0.0996 & 13694360663.7615 & 5758038748.9634 & 75881.7419 \tabularnewline
76 & 0.0302 & 0.0907 & 0.0973 & 3246673861.2525 & 5130197527.0357 & 71625.3972 \tabularnewline
77 & 0.0297 & 0.1285 & 0.1036 & 6914537945.7792 & 5487065610.7844 & 74074.7299 \tabularnewline
78 & 0.0325 & 0.1771 & 0.1158 & 11543159153.768 & 6496414534.615 & 80600.3383 \tabularnewline
79 & 0.0354 & 0.0519 & 0.1067 & 967209232.9499 & 5706528062.9486 & 75541.5651 \tabularnewline
80 & 0.0342 & 0.119 & 0.1082 & 5852684804.2071 & 5724797655.6059 & 75662.3926 \tabularnewline
81 & 0.0368 & 0.0847 & 0.1056 & 2797216794.5758 & 5399510893.2692 & 73481.3643 \tabularnewline
82 & 0.0378 & 0.0752 & 0.1026 & 2254872182.5654 & 5085047022.1988 & 71309.5156 \tabularnewline
83 & 0.0373 & 0.101 & 0.1024 & 4338904984.8672 & 5017215927.896 & 70832.3085 \tabularnewline
84 & 0.0403 & 0.0434 & 0.0975 & 720791768.35 & 4659180581.2671 & 68258.1906 \tabularnewline
\hline
\end{tabular}
%Source: https://freestatistics.org/blog/index.php?pk=113824&T=2

[TABLE]
[ROW][C]Univariate ARIMA Extrapolation Forecast Performance[/C][/ROW]
[ROW][C]time[/C][C]% S.E.[/C][C]PE[/C][C]MAPE[/C][C]Sq.E[/C][C]MSE[/C][C]RMSE[/C][/ROW]
[ROW][C]73[/C][C]0.0225[/C][C]0.0496[/C][C]0[/C][C]1116611280.8727[/C][C]0[/C][C]0[/C][/ROW]
[ROW][C]74[/C][C]0.0223[/C][C]0.0719[/C][C]0.0607[/C][C]2463144302.2561[/C][C]1789877791.5644[/C][C]42306.9473[/C][/ROW]
[ROW][C]75[/C][C]0.0237[/C][C]0.1772[/C][C]0.0996[/C][C]13694360663.7615[/C][C]5758038748.9634[/C][C]75881.7419[/C][/ROW]
[ROW][C]76[/C][C]0.0302[/C][C]0.0907[/C][C]0.0973[/C][C]3246673861.2525[/C][C]5130197527.0357[/C][C]71625.3972[/C][/ROW]
[ROW][C]77[/C][C]0.0297[/C][C]0.1285[/C][C]0.1036[/C][C]6914537945.7792[/C][C]5487065610.7844[/C][C]74074.7299[/C][/ROW]
[ROW][C]78[/C][C]0.0325[/C][C]0.1771[/C][C]0.1158[/C][C]11543159153.768[/C][C]6496414534.615[/C][C]80600.3383[/C][/ROW]
[ROW][C]79[/C][C]0.0354[/C][C]0.0519[/C][C]0.1067[/C][C]967209232.9499[/C][C]5706528062.9486[/C][C]75541.5651[/C][/ROW]
[ROW][C]80[/C][C]0.0342[/C][C]0.119[/C][C]0.1082[/C][C]5852684804.2071[/C][C]5724797655.6059[/C][C]75662.3926[/C][/ROW]
[ROW][C]81[/C][C]0.0368[/C][C]0.0847[/C][C]0.1056[/C][C]2797216794.5758[/C][C]5399510893.2692[/C][C]73481.3643[/C][/ROW]
[ROW][C]82[/C][C]0.0378[/C][C]0.0752[/C][C]0.1026[/C][C]2254872182.5654[/C][C]5085047022.1988[/C][C]71309.5156[/C][/ROW]
[ROW][C]83[/C][C]0.0373[/C][C]0.101[/C][C]0.1024[/C][C]4338904984.8672[/C][C]5017215927.896[/C][C]70832.3085[/C][/ROW]
[ROW][C]84[/C][C]0.0403[/C][C]0.0434[/C][C]0.0975[/C][C]720791768.35[/C][C]4659180581.2671[/C][C]68258.1906[/C][/ROW]
[/TABLE]
Source: https://freestatistics.org/blog/index.php?pk=113824&T=2

Globally Unique Identifier (entire table): ba.freestatistics.org/blog/index.php?pk=113824&T=2

As an alternative you can also use a QR Code:  

The GUIDs for individual cells are displayed in the table below:

Univariate ARIMA Extrapolation Forecast Performance
time% S.E.PEMAPESq.EMSERMSE
730.02250.049601116611280.872700
740.02230.07190.06072463144302.25611789877791.564442306.9473
750.02370.17720.099613694360663.76155758038748.963475881.7419
760.03020.09070.09733246673861.25255130197527.035771625.3972
770.02970.12850.10366914537945.77925487065610.784474074.7299
780.03250.17710.115811543159153.7686496414534.61580600.3383
790.03540.05190.1067967209232.94995706528062.948675541.5651
800.03420.1190.10825852684804.20715724797655.605975662.3926
810.03680.08470.10562797216794.57585399510893.269273481.3643
820.03780.07520.10262254872182.56545085047022.198871309.5156
830.03730.1010.10244338904984.86725017215927.89670832.3085
840.04030.04340.0975720791768.354659180581.267168258.1906


Parameters (Session):
par1 = 12 ; par2 = 0.5 ; par3 = 1 ; par4 = 1 ; par5 = 12 ; par6 = 3 ; par7 = 2 ; par8 = 2 ; par9 = 1 ; par10 = FALSE ;
Parameters (R input):
par1 = 12 ; par2 = 0.5 ; par3 = 1 ; par4 = 1 ; par5 = 12 ; par6 = 3 ; par7 = 2 ; par8 = 2 ; par9 = 1 ; par10 = FALSE ;
R code (references can be found in the software module):
par1 <- as.numeric(par1) #cut off periods
par2 <- as.numeric(par2) #lambda
par3 <- as.numeric(par3) #degree of non-seasonal differencing
par4 <- as.numeric(par4) #degree of seasonal differencing
par5 <- as.numeric(par5) #seasonal period
par6 <- as.numeric(par6) #p
par7 <- as.numeric(par7) #q
par8 <- as.numeric(par8) #P
par9 <- as.numeric(par9) #Q
if (par10 == 'TRUE') par10 <- TRUE
if (par10 == 'FALSE') par10 <- FALSE
if (par2 == 0) x <- log(x)
if (par2 != 0) x <- x^par2
lx <- length(x)
first <- lx - 2*par1
nx <- lx - par1
nx1 <- nx + 1
fx <- lx - nx
if (fx < 1) {
fx <- par5
nx1 <- lx + fx - 1
first <- lx - 2*fx
}
first <- 1
if (fx < 3) fx <- round(lx/10,0)
(arima.out <- arima(x[1:nx], order=c(par6,par3,par7), seasonal=list(order=c(par8,par4,par9), period=par5), include.mean=par10, method='ML'))
(forecast <- predict(arima.out,par1))
(lb <- forecast$pred - 1.96 * forecast$se)
(ub <- forecast$pred + 1.96 * forecast$se)
if (par2 == 0) {
x <- exp(x)
forecast$pred <- exp(forecast$pred)
lb <- exp(lb)
ub <- exp(ub)
}
if (par2 != 0) {
x <- x^(1/par2)
forecast$pred <- forecast$pred^(1/par2)
lb <- lb^(1/par2)
ub <- ub^(1/par2)
}
if (par2 < 0) {
olb <- lb
lb <- ub
ub <- olb
}
(actandfor <- c(x[1:nx], forecast$pred))
(perc.se <- (ub-forecast$pred)/1.96/forecast$pred)
bitmap(file='test1.png')
opar <- par(mar=c(4,4,2,2),las=1)
ylim <- c( min(x[first:nx],lb), max(x[first:nx],ub))
plot(x,ylim=ylim,type='n',xlim=c(first,lx))
usr <- par('usr')
rect(usr[1],usr[3],nx+1,usr[4],border=NA,col='lemonchiffon')
rect(nx1,usr[3],usr[2],usr[4],border=NA,col='lavender')
abline(h= (-3:3)*2 , col ='gray', lty =3)
polygon( c(nx1:lx,lx:nx1), c(lb,rev(ub)), col = 'orange', lty=2,border=NA)
lines(nx1:lx, lb , lty=2)
lines(nx1:lx, ub , lty=2)
lines(x, lwd=2)
lines(nx1:lx, forecast$pred , lwd=2 , col ='white')
box()
par(opar)
dev.off()
prob.dec <- array(NA, dim=fx)
prob.sdec <- array(NA, dim=fx)
prob.ldec <- array(NA, dim=fx)
prob.pval <- array(NA, dim=fx)
perf.pe <- array(0, dim=fx)
perf.mape <- array(0, dim=fx)
perf.mape1 <- array(0, dim=fx)
perf.se <- array(0, dim=fx)
perf.mse <- array(0, dim=fx)
perf.mse1 <- array(0, dim=fx)
perf.rmse <- array(0, dim=fx)
for (i in 1:fx) {
locSD <- (ub[i] - forecast$pred[i]) / 1.96
perf.pe[i] = (x[nx+i] - forecast$pred[i]) / forecast$pred[i]
perf.se[i] = (x[nx+i] - forecast$pred[i])^2
prob.dec[i] = pnorm((x[nx+i-1] - forecast$pred[i]) / locSD)
prob.sdec[i] = pnorm((x[nx+i-par5] - forecast$pred[i]) / locSD)
prob.ldec[i] = pnorm((x[nx] - forecast$pred[i]) / locSD)
prob.pval[i] = pnorm(abs(x[nx+i] - forecast$pred[i]) / locSD)
}
perf.mape[1] = abs(perf.pe[1])
perf.mse[1] = abs(perf.se[1])
for (i in 2:fx) {
perf.mape[i] = perf.mape[i-1] + abs(perf.pe[i])
perf.mape1[i] = perf.mape[i] / i
perf.mse[i] = perf.mse[i-1] + perf.se[i]
perf.mse1[i] = perf.mse[i] / i
}
perf.rmse = sqrt(perf.mse1)
bitmap(file='test2.png')
plot(forecast$pred, pch=19, type='b',main='ARIMA Extrapolation Forecast', ylab='Forecast and 95% CI', xlab='time',ylim=c(min(lb),max(ub)))
dum <- forecast$pred
dum[1:par1] <- x[(nx+1):lx]
lines(dum, lty=1)
lines(ub,lty=3)
lines(lb,lty=3)
dev.off()
load(file='createtable')
a<-table.start()
a<-table.row.start(a)
a<-table.element(a,'Univariate ARIMA Extrapolation Forecast',9,TRUE)
a<-table.row.end(a)
a<-table.row.start(a)
a<-table.element(a,'time',1,header=TRUE)
a<-table.element(a,'Y[t]',1,header=TRUE)
a<-table.element(a,'F[t]',1,header=TRUE)
a<-table.element(a,'95% LB',1,header=TRUE)
a<-table.element(a,'95% UB',1,header=TRUE)
a<-table.element(a,'p-value
(H0: Y[t] = F[t])',1,header=TRUE)
a<-table.element(a,'P(F[t]>Y[t-1])',1,header=TRUE)
a<-table.element(a,'P(F[t]>Y[t-s])',1,header=TRUE)
mylab <- paste('P(F[t]>Y[',nx,sep='')
mylab <- paste(mylab,'])',sep='')
a<-table.element(a,mylab,1,header=TRUE)
a<-table.row.end(a)
for (i in (nx-par5):nx) {
a<-table.row.start(a)
a<-table.element(a,i,header=TRUE)
a<-table.element(a,x[i])
a<-table.element(a,'-')
a<-table.row.end(a)
}
for (i in 1:fx) {
a<-table.row.start(a)
a<-table.element(a,nx+i,header=TRUE)
a<-table.element(a,round(x[nx+i],4))
a<-table.element(a,round(forecast$pred[i],4))
a<-table.element(a,round(lb[i],4))
a<-table.element(a,round(ub[i],4))
a<-table.element(a,round((1-prob.pval[i]),4))
a<-table.element(a,round((1-prob.dec[i]),4))
a<-table.element(a,round((1-prob.sdec[i]),4))
a<-table.element(a,round((1-prob.ldec[i]),4))
a<-table.row.end(a)
}
a<-table.end(a)
table.save(a,file='mytable.tab')
a<-table.start()
a<-table.row.start(a)
a<-table.element(a,'Univariate ARIMA Extrapolation Forecast Performance',7,TRUE)
a<-table.row.end(a)
a<-table.row.start(a)
a<-table.element(a,'time',1,header=TRUE)
a<-table.element(a,'% S.E.',1,header=TRUE)
a<-table.element(a,'PE',1,header=TRUE)
a<-table.element(a,'MAPE',1,header=TRUE)
a<-table.element(a,'Sq.E',1,header=TRUE)
a<-table.element(a,'MSE',1,header=TRUE)
a<-table.element(a,'RMSE',1,header=TRUE)
a<-table.row.end(a)
for (i in 1:fx) {
a<-table.row.start(a)
a<-table.element(a,nx+i,header=TRUE)
a<-table.element(a,round(perc.se[i],4))
a<-table.element(a,round(perf.pe[i],4))
a<-table.element(a,round(perf.mape1[i],4))
a<-table.element(a,round(perf.se[i],4))
a<-table.element(a,round(perf.mse1[i],4))
a<-table.element(a,round(perf.rmse[i],4))
a<-table.row.end(a)
}
a<-table.end(a)
table.save(a,file='mytable1.tab')