Free Statistics

of Irreproducible Research!

Author's title

Author*The author of this computation has been verified*
R Software Modulerwasp_arimabackwardselection.wasp
Title produced by softwareARIMA Backward Selection
Date of computationTue, 21 Dec 2010 16:44:50 +0000
Cite this page as followsStatistical Computations at FreeStatistics.org, Office for Research Development and Education, URL https://freestatistics.org/blog/index.php?v=date/2010/Dec/21/t1292949756iagxejgfaqzf0gc.htm/, Retrieved Sat, 18 May 2024 14:23:17 +0000
Statistical Computations at FreeStatistics.org, Office for Research Development and Education, URL https://freestatistics.org/blog/index.php?pk=113747, Retrieved Sat, 18 May 2024 14:23:17 +0000
QR Codes:

Original text written by user:
IsPrivate?No (this computation is public)
User-defined keywords
Estimated Impact122
Family? (F = Feedback message, R = changed R code, M = changed R Module, P = changed Parameters, D = changed Data)
-     [Univariate Data Series] [data set] [2008-12-01 19:54:57] [b98453cac15ba1066b407e146608df68]
- RMP   [(Partial) Autocorrelation Function] [WS8 Autocorolation] [2010-12-01 09:55:45] [b84bdc9bd81e1f02ca0dcc4710c1b790]
- RMPD      [ARIMA Backward Selection] [ARIMA Backward] [2010-12-21 16:44:50] [a8abc7260f3c847aeac0a796e7895a2e] [Current]
Feedback Forum

Post a new message
Dataseries X:
143827
145191
146832
148577
149873
151847
153252
154292
155657
156523
156416
156693
160312
160438
160882
161668
164391
168556
169738
170387
171294
172202
172651
172770
178366
180014
181067
182586
184957
186417
188599
189490
190264
191221
191110
190674
195438
196393
197172
198760
200945
203845
204613
205487
206100
206315
206291
207801
211653
211325
211893
212056
214696
217455
218884
219816
219984
219062
218550
218179
222218
222196
223393
223292
226236
228831
228745
229140
229270
229359
230006
228810
232677
232961
234629
235660
240024
243554
244368
244356
245126
246321
246797
246735
251083
251786
252732
255051
259022
261698
263891
265247
262228
263429
264305
266371
273248
275472
278146
279506
283991
286794
288703
289285
288869
286942
285833
284095
289229
289389
290793
291454
294733
293853
294056
293982
293075
292391


Summary of computational transaction
Raw Inputview raw input (R code)
Raw Outputview raw output of R engine
Computing time12 seconds
R Server'Sir Ronald Aylmer Fisher' @ 193.190.124.24

\begin{tabular}{lllllllll}
\hline
Summary of computational transaction \tabularnewline
Raw Input & view raw input (R code)  \tabularnewline
Raw Output & view raw output of R engine  \tabularnewline
Computing time & 12 seconds \tabularnewline
R Server & 'Sir Ronald Aylmer Fisher' @ 193.190.124.24 \tabularnewline
\hline
\end{tabular}
%Source: https://freestatistics.org/blog/index.php?pk=113747&T=0

[TABLE]
[ROW][C]Summary of computational transaction[/C][/ROW]
[ROW][C]Raw Input[/C][C]view raw input (R code) [/C][/ROW]
[ROW][C]Raw Output[/C][C]view raw output of R engine [/C][/ROW]
[ROW][C]Computing time[/C][C]12 seconds[/C][/ROW]
[ROW][C]R Server[/C][C]'Sir Ronald Aylmer Fisher' @ 193.190.124.24[/C][/ROW]
[/TABLE]
Source: https://freestatistics.org/blog/index.php?pk=113747&T=0

Globally Unique Identifier (entire table): ba.freestatistics.org/blog/index.php?pk=113747&T=0

As an alternative you can also use a QR Code:  

The GUIDs for individual cells are displayed in the table below:

Summary of computational transaction
Raw Inputview raw input (R code)
Raw Outputview raw output of R engine
Computing time12 seconds
R Server'Sir Ronald Aylmer Fisher' @ 193.190.124.24


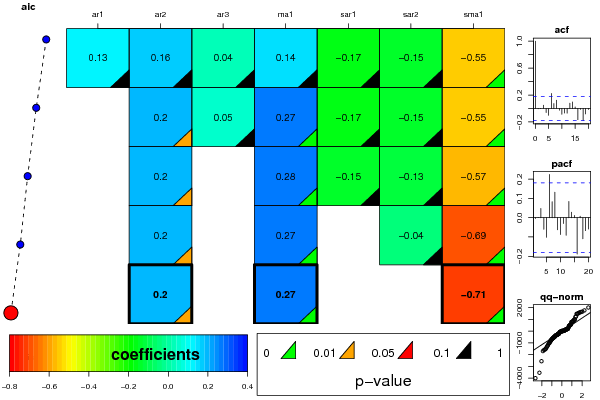
ARIMA Parameter Estimation and Backward Selection
Iterationar1ar2ar3ma1sar1sar2sma1
Estimates ( 1 )0.13020.16070.03770.1411-0.1698-0.1487-0.5497
(p-val)(0.9203 )(0.6584 )(0.8557 )(0.9133 )(0.4158 )(0.3789 )(0.0098 )
Estimates ( 2 )00.19670.05260.2705-0.1685-0.1479-0.5511
(p-val)(NA )(0.0497 )(0.5975 )(0.0068 )(0.4171 )(0.3798 )(0.0092 )
Estimates ( 3 )00.199100.2757-0.1478-0.1258-0.5701
(p-val)(NA )(0.0448 )(NA )(0.0069 )(0.467 )(0.4385 )(0.0059 )
Estimates ( 4 )00.202500.26810-0.045-0.6913
(p-val)(NA )(0.041 )(NA )(0.008 )(NA )(0.7212 )(0 )
Estimates ( 5 )00.204900.269900-0.7065
(p-val)(NA )(0.0384 )(NA )(0.0075 )(NA )(NA )(0 )
Estimates ( 6 )NANANANANANANA
(p-val)(NA )(NA )(NA )(NA )(NA )(NA )(NA )
Estimates ( 7 )NANANANANANANA
(p-val)(NA )(NA )(NA )(NA )(NA )(NA )(NA )
Estimates ( 8 )NANANANANANANA
(p-val)(NA )(NA )(NA )(NA )(NA )(NA )(NA )
Estimates ( 9 )NANANANANANANA
(p-val)(NA )(NA )(NA )(NA )(NA )(NA )(NA )
Estimates ( 10 )NANANANANANANA
(p-val)(NA )(NA )(NA )(NA )(NA )(NA )(NA )
Estimates ( 11 )NANANANANANANA
(p-val)(NA )(NA )(NA )(NA )(NA )(NA )(NA )
Estimates ( 12 )NANANANANANANA
(p-val)(NA )(NA )(NA )(NA )(NA )(NA )(NA )
Estimates ( 13 )NANANANANANANA
(p-val)(NA )(NA )(NA )(NA )(NA )(NA )(NA )

\begin{tabular}{lllllllll}
\hline
ARIMA Parameter Estimation and Backward Selection \tabularnewline
Iteration & ar1 & ar2 & ar3 & ma1 & sar1 & sar2 & sma1 \tabularnewline
Estimates ( 1 ) & 0.1302 & 0.1607 & 0.0377 & 0.1411 & -0.1698 & -0.1487 & -0.5497 \tabularnewline
(p-val) & (0.9203 ) & (0.6584 ) & (0.8557 ) & (0.9133 ) & (0.4158 ) & (0.3789 ) & (0.0098 ) \tabularnewline
Estimates ( 2 ) & 0 & 0.1967 & 0.0526 & 0.2705 & -0.1685 & -0.1479 & -0.5511 \tabularnewline
(p-val) & (NA ) & (0.0497 ) & (0.5975 ) & (0.0068 ) & (0.4171 ) & (0.3798 ) & (0.0092 ) \tabularnewline
Estimates ( 3 ) & 0 & 0.1991 & 0 & 0.2757 & -0.1478 & -0.1258 & -0.5701 \tabularnewline
(p-val) & (NA ) & (0.0448 ) & (NA ) & (0.0069 ) & (0.467 ) & (0.4385 ) & (0.0059 ) \tabularnewline
Estimates ( 4 ) & 0 & 0.2025 & 0 & 0.2681 & 0 & -0.045 & -0.6913 \tabularnewline
(p-val) & (NA ) & (0.041 ) & (NA ) & (0.008 ) & (NA ) & (0.7212 ) & (0 ) \tabularnewline
Estimates ( 5 ) & 0 & 0.2049 & 0 & 0.2699 & 0 & 0 & -0.7065 \tabularnewline
(p-val) & (NA ) & (0.0384 ) & (NA ) & (0.0075 ) & (NA ) & (NA ) & (0 ) \tabularnewline
Estimates ( 6 ) & NA & NA & NA & NA & NA & NA & NA \tabularnewline
(p-val) & (NA ) & (NA ) & (NA ) & (NA ) & (NA ) & (NA ) & (NA ) \tabularnewline
Estimates ( 7 ) & NA & NA & NA & NA & NA & NA & NA \tabularnewline
(p-val) & (NA ) & (NA ) & (NA ) & (NA ) & (NA ) & (NA ) & (NA ) \tabularnewline
Estimates ( 8 ) & NA & NA & NA & NA & NA & NA & NA \tabularnewline
(p-val) & (NA ) & (NA ) & (NA ) & (NA ) & (NA ) & (NA ) & (NA ) \tabularnewline
Estimates ( 9 ) & NA & NA & NA & NA & NA & NA & NA \tabularnewline
(p-val) & (NA ) & (NA ) & (NA ) & (NA ) & (NA ) & (NA ) & (NA ) \tabularnewline
Estimates ( 10 ) & NA & NA & NA & NA & NA & NA & NA \tabularnewline
(p-val) & (NA ) & (NA ) & (NA ) & (NA ) & (NA ) & (NA ) & (NA ) \tabularnewline
Estimates ( 11 ) & NA & NA & NA & NA & NA & NA & NA \tabularnewline
(p-val) & (NA ) & (NA ) & (NA ) & (NA ) & (NA ) & (NA ) & (NA ) \tabularnewline
Estimates ( 12 ) & NA & NA & NA & NA & NA & NA & NA \tabularnewline
(p-val) & (NA ) & (NA ) & (NA ) & (NA ) & (NA ) & (NA ) & (NA ) \tabularnewline
Estimates ( 13 ) & NA & NA & NA & NA & NA & NA & NA \tabularnewline
(p-val) & (NA ) & (NA ) & (NA ) & (NA ) & (NA ) & (NA ) & (NA ) \tabularnewline
\hline
\end{tabular}
%Source: https://freestatistics.org/blog/index.php?pk=113747&T=1

[TABLE]
[ROW][C]ARIMA Parameter Estimation and Backward Selection[/C][/ROW]
[ROW][C]Iteration[/C][C]ar1[/C][C]ar2[/C][C]ar3[/C][C]ma1[/C][C]sar1[/C][C]sar2[/C][C]sma1[/C][/ROW]
[ROW][C]Estimates ( 1 )[/C][C]0.1302[/C][C]0.1607[/C][C]0.0377[/C][C]0.1411[/C][C]-0.1698[/C][C]-0.1487[/C][C]-0.5497[/C][/ROW]
[ROW][C](p-val)[/C][C](0.9203 )[/C][C](0.6584 )[/C][C](0.8557 )[/C][C](0.9133 )[/C][C](0.4158 )[/C][C](0.3789 )[/C][C](0.0098 )[/C][/ROW]
[ROW][C]Estimates ( 2 )[/C][C]0[/C][C]0.1967[/C][C]0.0526[/C][C]0.2705[/C][C]-0.1685[/C][C]-0.1479[/C][C]-0.5511[/C][/ROW]
[ROW][C](p-val)[/C][C](NA )[/C][C](0.0497 )[/C][C](0.5975 )[/C][C](0.0068 )[/C][C](0.4171 )[/C][C](0.3798 )[/C][C](0.0092 )[/C][/ROW]
[ROW][C]Estimates ( 3 )[/C][C]0[/C][C]0.1991[/C][C]0[/C][C]0.2757[/C][C]-0.1478[/C][C]-0.1258[/C][C]-0.5701[/C][/ROW]
[ROW][C](p-val)[/C][C](NA )[/C][C](0.0448 )[/C][C](NA )[/C][C](0.0069 )[/C][C](0.467 )[/C][C](0.4385 )[/C][C](0.0059 )[/C][/ROW]
[ROW][C]Estimates ( 4 )[/C][C]0[/C][C]0.2025[/C][C]0[/C][C]0.2681[/C][C]0[/C][C]-0.045[/C][C]-0.6913[/C][/ROW]
[ROW][C](p-val)[/C][C](NA )[/C][C](0.041 )[/C][C](NA )[/C][C](0.008 )[/C][C](NA )[/C][C](0.7212 )[/C][C](0 )[/C][/ROW]
[ROW][C]Estimates ( 5 )[/C][C]0[/C][C]0.2049[/C][C]0[/C][C]0.2699[/C][C]0[/C][C]0[/C][C]-0.7065[/C][/ROW]
[ROW][C](p-val)[/C][C](NA )[/C][C](0.0384 )[/C][C](NA )[/C][C](0.0075 )[/C][C](NA )[/C][C](NA )[/C][C](0 )[/C][/ROW]
[ROW][C]Estimates ( 6 )[/C][C]NA[/C][C]NA[/C][C]NA[/C][C]NA[/C][C]NA[/C][C]NA[/C][C]NA[/C][/ROW]
[ROW][C](p-val)[/C][C](NA )[/C][C](NA )[/C][C](NA )[/C][C](NA )[/C][C](NA )[/C][C](NA )[/C][C](NA )[/C][/ROW]
[ROW][C]Estimates ( 7 )[/C][C]NA[/C][C]NA[/C][C]NA[/C][C]NA[/C][C]NA[/C][C]NA[/C][C]NA[/C][/ROW]
[ROW][C](p-val)[/C][C](NA )[/C][C](NA )[/C][C](NA )[/C][C](NA )[/C][C](NA )[/C][C](NA )[/C][C](NA )[/C][/ROW]
[ROW][C]Estimates ( 8 )[/C][C]NA[/C][C]NA[/C][C]NA[/C][C]NA[/C][C]NA[/C][C]NA[/C][C]NA[/C][/ROW]
[ROW][C](p-val)[/C][C](NA )[/C][C](NA )[/C][C](NA )[/C][C](NA )[/C][C](NA )[/C][C](NA )[/C][C](NA )[/C][/ROW]
[ROW][C]Estimates ( 9 )[/C][C]NA[/C][C]NA[/C][C]NA[/C][C]NA[/C][C]NA[/C][C]NA[/C][C]NA[/C][/ROW]
[ROW][C](p-val)[/C][C](NA )[/C][C](NA )[/C][C](NA )[/C][C](NA )[/C][C](NA )[/C][C](NA )[/C][C](NA )[/C][/ROW]
[ROW][C]Estimates ( 10 )[/C][C]NA[/C][C]NA[/C][C]NA[/C][C]NA[/C][C]NA[/C][C]NA[/C][C]NA[/C][/ROW]
[ROW][C](p-val)[/C][C](NA )[/C][C](NA )[/C][C](NA )[/C][C](NA )[/C][C](NA )[/C][C](NA )[/C][C](NA )[/C][/ROW]
[ROW][C]Estimates ( 11 )[/C][C]NA[/C][C]NA[/C][C]NA[/C][C]NA[/C][C]NA[/C][C]NA[/C][C]NA[/C][/ROW]
[ROW][C](p-val)[/C][C](NA )[/C][C](NA )[/C][C](NA )[/C][C](NA )[/C][C](NA )[/C][C](NA )[/C][C](NA )[/C][/ROW]
[ROW][C]Estimates ( 12 )[/C][C]NA[/C][C]NA[/C][C]NA[/C][C]NA[/C][C]NA[/C][C]NA[/C][C]NA[/C][/ROW]
[ROW][C](p-val)[/C][C](NA )[/C][C](NA )[/C][C](NA )[/C][C](NA )[/C][C](NA )[/C][C](NA )[/C][C](NA )[/C][/ROW]
[ROW][C]Estimates ( 13 )[/C][C]NA[/C][C]NA[/C][C]NA[/C][C]NA[/C][C]NA[/C][C]NA[/C][C]NA[/C][/ROW]
[ROW][C](p-val)[/C][C](NA )[/C][C](NA )[/C][C](NA )[/C][C](NA )[/C][C](NA )[/C][C](NA )[/C][C](NA )[/C][/ROW]
[/TABLE]
Source: https://freestatistics.org/blog/index.php?pk=113747&T=1

Globally Unique Identifier (entire table): ba.freestatistics.org/blog/index.php?pk=113747&T=1

As an alternative you can also use a QR Code:  

The GUIDs for individual cells are displayed in the table below:

ARIMA Parameter Estimation and Backward Selection
Iterationar1ar2ar3ma1sar1sar2sma1
Estimates ( 1 )0.13020.16070.03770.1411-0.1698-0.1487-0.5497
(p-val)(0.9203 )(0.6584 )(0.8557 )(0.9133 )(0.4158 )(0.3789 )(0.0098 )
Estimates ( 2 )00.19670.05260.2705-0.1685-0.1479-0.5511
(p-val)(NA )(0.0497 )(0.5975 )(0.0068 )(0.4171 )(0.3798 )(0.0092 )
Estimates ( 3 )00.199100.2757-0.1478-0.1258-0.5701
(p-val)(NA )(0.0448 )(NA )(0.0069 )(0.467 )(0.4385 )(0.0059 )
Estimates ( 4 )00.202500.26810-0.045-0.6913
(p-val)(NA )(0.041 )(NA )(0.008 )(NA )(0.7212 )(0 )
Estimates ( 5 )00.204900.269900-0.7065
(p-val)(NA )(0.0384 )(NA )(0.0075 )(NA )(NA )(0 )
Estimates ( 6 )NANANANANANANA
(p-val)(NA )(NA )(NA )(NA )(NA )(NA )(NA )
Estimates ( 7 )NANANANANANANA
(p-val)(NA )(NA )(NA )(NA )(NA )(NA )(NA )
Estimates ( 8 )NANANANANANANA
(p-val)(NA )(NA )(NA )(NA )(NA )(NA )(NA )
Estimates ( 9 )NANANANANANANA
(p-val)(NA )(NA )(NA )(NA )(NA )(NA )(NA )
Estimates ( 10 )NANANANANANANA
(p-val)(NA )(NA )(NA )(NA )(NA )(NA )(NA )
Estimates ( 11 )NANANANANANANA
(p-val)(NA )(NA )(NA )(NA )(NA )(NA )(NA )
Estimates ( 12 )NANANANANANANA
(p-val)(NA )(NA )(NA )(NA )(NA )(NA )(NA )
Estimates ( 13 )NANANANANANANA
(p-val)(NA )(NA )(NA )(NA )(NA )(NA )(NA )


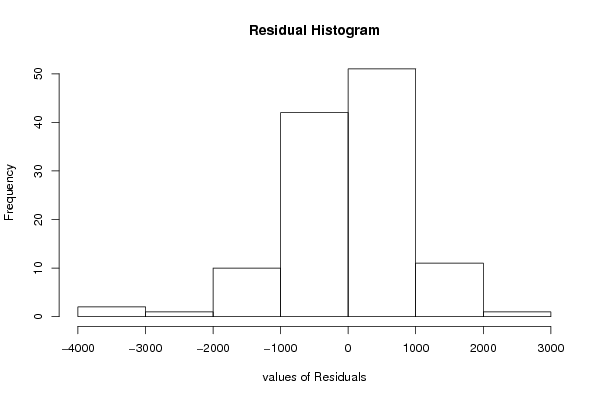
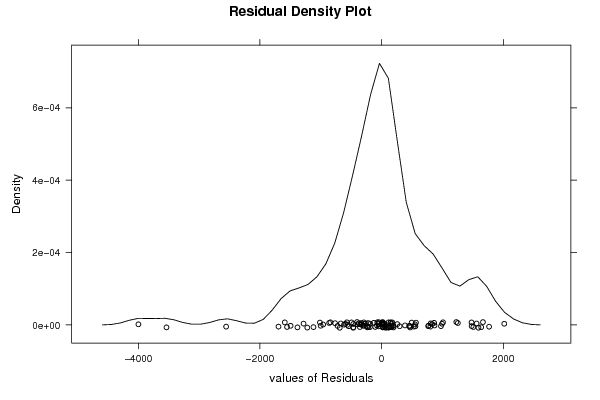
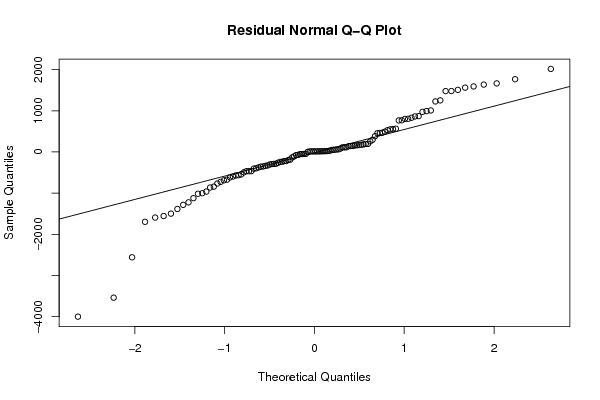
Estimated ARIMA Residuals
Value
-467.101549728192
-961.2841838931
-672.219778152258
-403.833776777392
1478.94495866907
1561.89000749308
-841.84008297984
-465.018283499529
-222.372377850130
139.878773515397
462.37717062423
-350.770271776317
1477.54792193219
564.368471684446
-357.26544219681
194.717565564439
195.610039576463
-1695.44592340072
1227.28842595788
51.8988846525882
-494.917786173692
175.375156452688
-284.417809015602
-543.35790365646
183.235427417227
-106.279529653562
-241.122505788264
296.483082947112
18.8043026231285
467.674362524635
-1001.99848843695
167.987573662255
-236.858417456894
-617.955828663289
162.697318705982
1591.35929707189
-1222.14530486316
-1283.79058790923
147.131744023031
-1014.79732337969
805.168982706046
113.117033899545
1.56627514619948
53.3671098760298
-724.817585397542
-1384.17880813326
-47.6514571932833
-571.270128341611
-129.680819331931
-396.39162761284
554.473256143423
-1121.08156303550
829.821957046003
-46.5126646024741
-1592.02119748333
-50.6509458600334
-193.637540883136
64.565650278995
863.111808126184
-1555.24171716637
-219.808579994871
158.202749087974
765.91250469973
143.898396398694
1665.35422936230
383.621682882817
-563.903137112155
-765.536599964605
493.773645661883
1008.89852130237
14.0352147583916
-75.9493215194762
112.389714512370
258.248669025779
-304.901097065889
1508.34164236212
528.819301540063
-688.854301973311
1252.97555759235
549.395003360968
-3998.13096773772
1636.45486458747
974.581285194536
1766.21055196132
2015.64538358351
769.926475677125
869.457844285297
-467.308711921913
992.242042575855
-290.602158163746
454.293696659393
-337.173195967221
114.040129590511
-2556.67735892686
-863.397628858826
-1497.23180249038
801.552247897746
-595.387820026331
-51.0163655674337
-374.857469657872
-260.447860478846
-3537.31822057027
-187.368871940811
60.5955275039566
-328.275660649882
-293.033538362463

\begin{tabular}{lllllllll}
\hline
Estimated ARIMA Residuals \tabularnewline
Value \tabularnewline
-467.101549728192 \tabularnewline
-961.2841838931 \tabularnewline
-672.219778152258 \tabularnewline
-403.833776777392 \tabularnewline
1478.94495866907 \tabularnewline
1561.89000749308 \tabularnewline
-841.84008297984 \tabularnewline
-465.018283499529 \tabularnewline
-222.372377850130 \tabularnewline
139.878773515397 \tabularnewline
462.37717062423 \tabularnewline
-350.770271776317 \tabularnewline
1477.54792193219 \tabularnewline
564.368471684446 \tabularnewline
-357.26544219681 \tabularnewline
194.717565564439 \tabularnewline
195.610039576463 \tabularnewline
-1695.44592340072 \tabularnewline
1227.28842595788 \tabularnewline
51.8988846525882 \tabularnewline
-494.917786173692 \tabularnewline
175.375156452688 \tabularnewline
-284.417809015602 \tabularnewline
-543.35790365646 \tabularnewline
183.235427417227 \tabularnewline
-106.279529653562 \tabularnewline
-241.122505788264 \tabularnewline
296.483082947112 \tabularnewline
18.8043026231285 \tabularnewline
467.674362524635 \tabularnewline
-1001.99848843695 \tabularnewline
167.987573662255 \tabularnewline
-236.858417456894 \tabularnewline
-617.955828663289 \tabularnewline
162.697318705982 \tabularnewline
1591.35929707189 \tabularnewline
-1222.14530486316 \tabularnewline
-1283.79058790923 \tabularnewline
147.131744023031 \tabularnewline
-1014.79732337969 \tabularnewline
805.168982706046 \tabularnewline
113.117033899545 \tabularnewline
1.56627514619948 \tabularnewline
53.3671098760298 \tabularnewline
-724.817585397542 \tabularnewline
-1384.17880813326 \tabularnewline
-47.6514571932833 \tabularnewline
-571.270128341611 \tabularnewline
-129.680819331931 \tabularnewline
-396.39162761284 \tabularnewline
554.473256143423 \tabularnewline
-1121.08156303550 \tabularnewline
829.821957046003 \tabularnewline
-46.5126646024741 \tabularnewline
-1592.02119748333 \tabularnewline
-50.6509458600334 \tabularnewline
-193.637540883136 \tabularnewline
64.565650278995 \tabularnewline
863.111808126184 \tabularnewline
-1555.24171716637 \tabularnewline
-219.808579994871 \tabularnewline
158.202749087974 \tabularnewline
765.91250469973 \tabularnewline
143.898396398694 \tabularnewline
1665.35422936230 \tabularnewline
383.621682882817 \tabularnewline
-563.903137112155 \tabularnewline
-765.536599964605 \tabularnewline
493.773645661883 \tabularnewline
1008.89852130237 \tabularnewline
14.0352147583916 \tabularnewline
-75.9493215194762 \tabularnewline
112.389714512370 \tabularnewline
258.248669025779 \tabularnewline
-304.901097065889 \tabularnewline
1508.34164236212 \tabularnewline
528.819301540063 \tabularnewline
-688.854301973311 \tabularnewline
1252.97555759235 \tabularnewline
549.395003360968 \tabularnewline
-3998.13096773772 \tabularnewline
1636.45486458747 \tabularnewline
974.581285194536 \tabularnewline
1766.21055196132 \tabularnewline
2015.64538358351 \tabularnewline
769.926475677125 \tabularnewline
869.457844285297 \tabularnewline
-467.308711921913 \tabularnewline
992.242042575855 \tabularnewline
-290.602158163746 \tabularnewline
454.293696659393 \tabularnewline
-337.173195967221 \tabularnewline
114.040129590511 \tabularnewline
-2556.67735892686 \tabularnewline
-863.397628858826 \tabularnewline
-1497.23180249038 \tabularnewline
801.552247897746 \tabularnewline
-595.387820026331 \tabularnewline
-51.0163655674337 \tabularnewline
-374.857469657872 \tabularnewline
-260.447860478846 \tabularnewline
-3537.31822057027 \tabularnewline
-187.368871940811 \tabularnewline
60.5955275039566 \tabularnewline
-328.275660649882 \tabularnewline
-293.033538362463 \tabularnewline
\hline
\end{tabular}
%Source: https://freestatistics.org/blog/index.php?pk=113747&T=2

[TABLE]
[ROW][C]Estimated ARIMA Residuals[/C][/ROW]
[ROW][C]Value[/C][/ROW]
[ROW][C]-467.101549728192[/C][/ROW]
[ROW][C]-961.2841838931[/C][/ROW]
[ROW][C]-672.219778152258[/C][/ROW]
[ROW][C]-403.833776777392[/C][/ROW]
[ROW][C]1478.94495866907[/C][/ROW]
[ROW][C]1561.89000749308[/C][/ROW]
[ROW][C]-841.84008297984[/C][/ROW]
[ROW][C]-465.018283499529[/C][/ROW]
[ROW][C]-222.372377850130[/C][/ROW]
[ROW][C]139.878773515397[/C][/ROW]
[ROW][C]462.37717062423[/C][/ROW]
[ROW][C]-350.770271776317[/C][/ROW]
[ROW][C]1477.54792193219[/C][/ROW]
[ROW][C]564.368471684446[/C][/ROW]
[ROW][C]-357.26544219681[/C][/ROW]
[ROW][C]194.717565564439[/C][/ROW]
[ROW][C]195.610039576463[/C][/ROW]
[ROW][C]-1695.44592340072[/C][/ROW]
[ROW][C]1227.28842595788[/C][/ROW]
[ROW][C]51.8988846525882[/C][/ROW]
[ROW][C]-494.917786173692[/C][/ROW]
[ROW][C]175.375156452688[/C][/ROW]
[ROW][C]-284.417809015602[/C][/ROW]
[ROW][C]-543.35790365646[/C][/ROW]
[ROW][C]183.235427417227[/C][/ROW]
[ROW][C]-106.279529653562[/C][/ROW]
[ROW][C]-241.122505788264[/C][/ROW]
[ROW][C]296.483082947112[/C][/ROW]
[ROW][C]18.8043026231285[/C][/ROW]
[ROW][C]467.674362524635[/C][/ROW]
[ROW][C]-1001.99848843695[/C][/ROW]
[ROW][C]167.987573662255[/C][/ROW]
[ROW][C]-236.858417456894[/C][/ROW]
[ROW][C]-617.955828663289[/C][/ROW]
[ROW][C]162.697318705982[/C][/ROW]
[ROW][C]1591.35929707189[/C][/ROW]
[ROW][C]-1222.14530486316[/C][/ROW]
[ROW][C]-1283.79058790923[/C][/ROW]
[ROW][C]147.131744023031[/C][/ROW]
[ROW][C]-1014.79732337969[/C][/ROW]
[ROW][C]805.168982706046[/C][/ROW]
[ROW][C]113.117033899545[/C][/ROW]
[ROW][C]1.56627514619948[/C][/ROW]
[ROW][C]53.3671098760298[/C][/ROW]
[ROW][C]-724.817585397542[/C][/ROW]
[ROW][C]-1384.17880813326[/C][/ROW]
[ROW][C]-47.6514571932833[/C][/ROW]
[ROW][C]-571.270128341611[/C][/ROW]
[ROW][C]-129.680819331931[/C][/ROW]
[ROW][C]-396.39162761284[/C][/ROW]
[ROW][C]554.473256143423[/C][/ROW]
[ROW][C]-1121.08156303550[/C][/ROW]
[ROW][C]829.821957046003[/C][/ROW]
[ROW][C]-46.5126646024741[/C][/ROW]
[ROW][C]-1592.02119748333[/C][/ROW]
[ROW][C]-50.6509458600334[/C][/ROW]
[ROW][C]-193.637540883136[/C][/ROW]
[ROW][C]64.565650278995[/C][/ROW]
[ROW][C]863.111808126184[/C][/ROW]
[ROW][C]-1555.24171716637[/C][/ROW]
[ROW][C]-219.808579994871[/C][/ROW]
[ROW][C]158.202749087974[/C][/ROW]
[ROW][C]765.91250469973[/C][/ROW]
[ROW][C]143.898396398694[/C][/ROW]
[ROW][C]1665.35422936230[/C][/ROW]
[ROW][C]383.621682882817[/C][/ROW]
[ROW][C]-563.903137112155[/C][/ROW]
[ROW][C]-765.536599964605[/C][/ROW]
[ROW][C]493.773645661883[/C][/ROW]
[ROW][C]1008.89852130237[/C][/ROW]
[ROW][C]14.0352147583916[/C][/ROW]
[ROW][C]-75.9493215194762[/C][/ROW]
[ROW][C]112.389714512370[/C][/ROW]
[ROW][C]258.248669025779[/C][/ROW]
[ROW][C]-304.901097065889[/C][/ROW]
[ROW][C]1508.34164236212[/C][/ROW]
[ROW][C]528.819301540063[/C][/ROW]
[ROW][C]-688.854301973311[/C][/ROW]
[ROW][C]1252.97555759235[/C][/ROW]
[ROW][C]549.395003360968[/C][/ROW]
[ROW][C]-3998.13096773772[/C][/ROW]
[ROW][C]1636.45486458747[/C][/ROW]
[ROW][C]974.581285194536[/C][/ROW]
[ROW][C]1766.21055196132[/C][/ROW]
[ROW][C]2015.64538358351[/C][/ROW]
[ROW][C]769.926475677125[/C][/ROW]
[ROW][C]869.457844285297[/C][/ROW]
[ROW][C]-467.308711921913[/C][/ROW]
[ROW][C]992.242042575855[/C][/ROW]
[ROW][C]-290.602158163746[/C][/ROW]
[ROW][C]454.293696659393[/C][/ROW]
[ROW][C]-337.173195967221[/C][/ROW]
[ROW][C]114.040129590511[/C][/ROW]
[ROW][C]-2556.67735892686[/C][/ROW]
[ROW][C]-863.397628858826[/C][/ROW]
[ROW][C]-1497.23180249038[/C][/ROW]
[ROW][C]801.552247897746[/C][/ROW]
[ROW][C]-595.387820026331[/C][/ROW]
[ROW][C]-51.0163655674337[/C][/ROW]
[ROW][C]-374.857469657872[/C][/ROW]
[ROW][C]-260.447860478846[/C][/ROW]
[ROW][C]-3537.31822057027[/C][/ROW]
[ROW][C]-187.368871940811[/C][/ROW]
[ROW][C]60.5955275039566[/C][/ROW]
[ROW][C]-328.275660649882[/C][/ROW]
[ROW][C]-293.033538362463[/C][/ROW]
[/TABLE]
Source: https://freestatistics.org/blog/index.php?pk=113747&T=2

Globally Unique Identifier (entire table): ba.freestatistics.org/blog/index.php?pk=113747&T=2

As an alternative you can also use a QR Code:  

The GUIDs for individual cells are displayed in the table below:

Estimated ARIMA Residuals
Value
-467.101549728192
-961.2841838931
-672.219778152258
-403.833776777392
1478.94495866907
1561.89000749308
-841.84008297984
-465.018283499529
-222.372377850130
139.878773515397
462.37717062423
-350.770271776317
1477.54792193219
564.368471684446
-357.26544219681
194.717565564439
195.610039576463
-1695.44592340072
1227.28842595788
51.8988846525882
-494.917786173692
175.375156452688
-284.417809015602
-543.35790365646
183.235427417227
-106.279529653562
-241.122505788264
296.483082947112
18.8043026231285
467.674362524635
-1001.99848843695
167.987573662255
-236.858417456894
-617.955828663289
162.697318705982
1591.35929707189
-1222.14530486316
-1283.79058790923
147.131744023031
-1014.79732337969
805.168982706046
113.117033899545
1.56627514619948
53.3671098760298
-724.817585397542
-1384.17880813326
-47.6514571932833
-571.270128341611
-129.680819331931
-396.39162761284
554.473256143423
-1121.08156303550
829.821957046003
-46.5126646024741
-1592.02119748333
-50.6509458600334
-193.637540883136
64.565650278995
863.111808126184
-1555.24171716637
-219.808579994871
158.202749087974
765.91250469973
143.898396398694
1665.35422936230
383.621682882817
-563.903137112155
-765.536599964605
493.773645661883
1008.89852130237
14.0352147583916
-75.9493215194762
112.389714512370
258.248669025779
-304.901097065889
1508.34164236212
528.819301540063
-688.854301973311
1252.97555759235
549.395003360968
-3998.13096773772
1636.45486458747
974.581285194536
1766.21055196132
2015.64538358351
769.926475677125
869.457844285297
-467.308711921913
992.242042575855
-290.602158163746
454.293696659393
-337.173195967221
114.040129590511
-2556.67735892686
-863.397628858826
-1497.23180249038
801.552247897746
-595.387820026331
-51.0163655674337
-374.857469657872
-260.447860478846
-3537.31822057027
-187.368871940811
60.5955275039566
-328.275660649882
-293.033538362463


Parameters (Session):
par1 = 1 ; par2 = Do not include Seasonal Dummies ; par3 = No Linear Trend ;
Parameters (R input):
par1 = FALSE ; par2 = 1 ; par3 = 1 ; par4 = 1 ; par5 = 12 ; par6 = 3 ; par7 = 1 ; par8 = 2 ; par9 = 1 ;
R code (references can be found in the software module):
library(lattice)
if (par1 == 'TRUE') par1 <- TRUE
if (par1 == 'FALSE') par1 <- FALSE
par2 <- as.numeric(par2) #Box-Cox lambda transformation parameter
par3 <- as.numeric(par3) #degree of non-seasonal differencing
par4 <- as.numeric(par4) #degree of seasonal differencing
par5 <- as.numeric(par5) #seasonal period
par6 <- as.numeric(par6) #degree (p) of the non-seasonal AR(p) polynomial
par7 <- as.numeric(par7) #degree (q) of the non-seasonal MA(q) polynomial
par8 <- as.numeric(par8) #degree (P) of the seasonal AR(P) polynomial
par9 <- as.numeric(par9) #degree (Q) of the seasonal MA(Q) polynomial
armaGR <- function(arima.out, names, n){
try1 <- arima.out$coef
try2 <- sqrt(diag(arima.out$var.coef))
try.data.frame <- data.frame(matrix(NA,ncol=4,nrow=length(names)))
dimnames(try.data.frame) <- list(names,c('coef','std','tstat','pv'))
try.data.frame[,1] <- try1
for(i in 1:length(try2)) try.data.frame[which(rownames(try.data.frame)==names(try2)[i]),2] <- try2[i]
try.data.frame[,3] <- try.data.frame[,1] / try.data.frame[,2]
try.data.frame[,4] <- round((1-pt(abs(try.data.frame[,3]),df=n-(length(try2)+1)))*2,5)
vector <- rep(NA,length(names))
vector[is.na(try.data.frame[,4])] <- 0
maxi <- which.max(try.data.frame[,4])
continue <- max(try.data.frame[,4],na.rm=TRUE) > .05
vector[maxi] <- 0
list(summary=try.data.frame,next.vector=vector,continue=continue)
}
arimaSelect <- function(series, order=c(13,0,0), seasonal=list(order=c(2,0,0),period=12), include.mean=F){
nrc <- order[1]+order[3]+seasonal$order[1]+seasonal$order[3]
coeff <- matrix(NA, nrow=nrc*2, ncol=nrc)
pval <- matrix(NA, nrow=nrc*2, ncol=nrc)
mylist <- rep(list(NULL), nrc)
names <- NULL
if(order[1] > 0) names <- paste('ar',1:order[1],sep='')
if(order[3] > 0) names <- c( names , paste('ma',1:order[3],sep='') )
if(seasonal$order[1] > 0) names <- c(names, paste('sar',1:seasonal$order[1],sep=''))
if(seasonal$order[3] > 0) names <- c(names, paste('sma',1:seasonal$order[3],sep=''))
arima.out <- arima(series, order=order, seasonal=seasonal, include.mean=include.mean, method='ML')
mylist[[1]] <- arima.out
last.arma <- armaGR(arima.out, names, length(series))
mystop <- FALSE
i <- 1
coeff[i,] <- last.arma[[1]][,1]
pval [i,] <- last.arma[[1]][,4]
i <- 2
aic <- arima.out$aic
while(!mystop){
mylist[[i]] <- arima.out
arima.out <- arima(series, order=order, seasonal=seasonal, include.mean=include.mean, method='ML', fixed=last.arma$next.vector)
aic <- c(aic, arima.out$aic)
last.arma <- armaGR(arima.out, names, length(series))
mystop <- !last.arma$continue
coeff[i,] <- last.arma[[1]][,1]
pval [i,] <- last.arma[[1]][,4]
i <- i+1
}
list(coeff, pval, mylist, aic=aic)
}
arimaSelectplot <- function(arimaSelect.out,noms,choix){
noms <- names(arimaSelect.out[[3]][[1]]$coef)
coeff <- arimaSelect.out[[1]]
k <- min(which(is.na(coeff[,1])))-1
coeff <- coeff[1:k,]
pval <- arimaSelect.out[[2]][1:k,]
aic <- arimaSelect.out$aic[1:k]
coeff[coeff==0] <- NA
n <- ncol(coeff)
if(missing(choix)) choix <- k
layout(matrix(c(1,1,1,2,
3,3,3,2,
3,3,3,4,
5,6,7,7),nr=4),
widths=c(10,35,45,15),
heights=c(30,30,15,15))
couleurs <- rainbow(75)[1:50]#(50)
ticks <- pretty(coeff)
par(mar=c(1,1,3,1))
plot(aic,k:1-.5,type='o',pch=21,bg='blue',cex=2,axes=F,lty=2,xpd=NA)
points(aic[choix],k-choix+.5,pch=21,cex=4,bg=2,xpd=NA)
title('aic',line=2)
par(mar=c(3,0,0,0))
plot(0,axes=F,xlab='',ylab='',xlim=range(ticks),ylim=c(.1,1))
rect(xleft = min(ticks) + (0:49)/50*(max(ticks)-min(ticks)),
xright = min(ticks) + (1:50)/50*(max(ticks)-min(ticks)),
ytop = rep(1,50),
ybottom= rep(0,50),col=couleurs,border=NA)
axis(1,ticks)
rect(xleft=min(ticks),xright=max(ticks),ytop=1,ybottom=0)
text(mean(coeff,na.rm=T),.5,'coefficients',cex=2,font=2)
par(mar=c(1,1,3,1))
image(1:n,1:k,t(coeff[k:1,]),axes=F,col=couleurs,zlim=range(ticks))
for(i in 1:n) for(j in 1:k) if(!is.na(coeff[j,i])) {
if(pval[j,i]<.01) symb = 'green'
else if( (pval[j,i]<.05) & (pval[j,i]>=.01)) symb = 'orange'
else if( (pval[j,i]<.1) & (pval[j,i]>=.05)) symb = 'red'
else symb = 'black'
polygon(c(i+.5 ,i+.2 ,i+.5 ,i+.5),
c(k-j+0.5,k-j+0.5,k-j+0.8,k-j+0.5),
col=symb)
if(j==choix) {
rect(xleft=i-.5,
xright=i+.5,
ybottom=k-j+1.5,
ytop=k-j+.5,
lwd=4)
text(i,
k-j+1,
round(coeff[j,i],2),
cex=1.2,
font=2)
}
else{
rect(xleft=i-.5,xright=i+.5,ybottom=k-j+1.5,ytop=k-j+.5)
text(i,k-j+1,round(coeff[j,i],2),cex=1.2,font=1)
}
}
axis(3,1:n,noms)
par(mar=c(0.5,0,0,0.5))
plot(0,axes=F,xlab='',ylab='',type='n',xlim=c(0,8),ylim=c(-.2,.8))
cols <- c('green','orange','red','black')
niv <- c('0','0.01','0.05','0.1')
for(i in 0:3){
polygon(c(1+2*i ,1+2*i ,1+2*i-.5 ,1+2*i),
c(.4 ,.7 , .4 , .4),
col=cols[i+1])
text(2*i,0.5,niv[i+1],cex=1.5)
}
text(8,.5,1,cex=1.5)
text(4,0,'p-value',cex=2)
box()
residus <- arimaSelect.out[[3]][[choix]]$res
par(mar=c(1,2,4,1))
acf(residus,main='')
title('acf',line=.5)
par(mar=c(1,2,4,1))
pacf(residus,main='')
title('pacf',line=.5)
par(mar=c(2,2,4,1))
qqnorm(residus,main='')
title('qq-norm',line=.5)
qqline(residus)
residus
}
if (par2 == 0) x <- log(x)
if (par2 != 0) x <- x^par2
(selection <- arimaSelect(x, order=c(par6,par3,par7), seasonal=list(order=c(par8,par4,par9), period=par5)))
bitmap(file='test1.png')
resid <- arimaSelectplot(selection)
dev.off()
resid
bitmap(file='test2.png')
acf(resid,length(resid)/2, main='Residual Autocorrelation Function')
dev.off()
bitmap(file='test3.png')
pacf(resid,length(resid)/2, main='Residual Partial Autocorrelation Function')
dev.off()
bitmap(file='test4.png')
cpgram(resid, main='Residual Cumulative Periodogram')
dev.off()
bitmap(file='test5.png')
hist(resid, main='Residual Histogram', xlab='values of Residuals')
dev.off()
bitmap(file='test6.png')
densityplot(~resid,col='black',main='Residual Density Plot', xlab='values of Residuals')
dev.off()
bitmap(file='test7.png')
qqnorm(resid, main='Residual Normal Q-Q Plot')
qqline(resid)
dev.off()
ncols <- length(selection[[1]][1,])
nrows <- length(selection[[2]][,1])-1
load(file='createtable')
a<-table.start()
a<-table.row.start(a)
a<-table.element(a,'ARIMA Parameter Estimation and Backward Selection', ncols+1,TRUE)
a<-table.row.end(a)
a<-table.row.start(a)
a<-table.element(a,'Iteration', header=TRUE)
for (i in 1:ncols) {
a<-table.element(a,names(selection[[3]][[1]]$coef)[i],header=TRUE)
}
a<-table.row.end(a)
for (j in 1:nrows) {
a<-table.row.start(a)
mydum <- 'Estimates ('
mydum <- paste(mydum,j)
mydum <- paste(mydum,')')
a<-table.element(a,mydum, header=TRUE)
for (i in 1:ncols) {
a<-table.element(a,round(selection[[1]][j,i],4))
}
a<-table.row.end(a)
a<-table.row.start(a)
a<-table.element(a,'(p-val)', header=TRUE)
for (i in 1:ncols) {
mydum <- '('
mydum <- paste(mydum,round(selection[[2]][j,i],4),sep='')
mydum <- paste(mydum,')')
a<-table.element(a,mydum)
}
a<-table.row.end(a)
}
a<-table.end(a)
table.save(a,file='mytable.tab')
a<-table.start()
a<-table.row.start(a)
a<-table.element(a,'Estimated ARIMA Residuals', 1,TRUE)
a<-table.row.end(a)
a<-table.row.start(a)
a<-table.element(a,'Value', 1,TRUE)
a<-table.row.end(a)
for (i in (par4*par5+par3):length(resid)) {
a<-table.row.start(a)
a<-table.element(a,resid[i])
a<-table.row.end(a)
}
a<-table.end(a)
table.save(a,file='mytable1.tab')