Free Statistics

of Irreproducible Research!

Author's title

Author*The author of this computation has been verified*
R Software Modulerwasp_autocorrelation.wasp
Title produced by software(Partial) Autocorrelation Function
Date of computationTue, 21 Dec 2010 15:45:37 +0000
Cite this page as followsStatistical Computations at FreeStatistics.org, Office for Research Development and Education, URL https://freestatistics.org/blog/index.php?v=date/2010/Dec/21/t12929463221fqad6o86dhma3n.htm/, Retrieved Thu, 23 May 2024 08:21:36 +0000
Statistical Computations at FreeStatistics.org, Office for Research Development and Education, URL https://freestatistics.org/blog/index.php?pk=113687, Retrieved Thu, 23 May 2024 08:21:36 +0000
QR Codes:

Original text written by user:
IsPrivate?No (this computation is public)
User-defined keywords
Estimated Impact87
Family? (F = Feedback message, R = changed R code, M = changed R Module, P = changed Parameters, D = changed Data)
-       [(Partial) Autocorrelation Function] [CPI-ACF] [2010-12-21 15:45:37] [4c7d8c32b2e34fcaa7f14928b91d45ae] [Current]
Feedback Forum

Post a new message
Dataseries X:
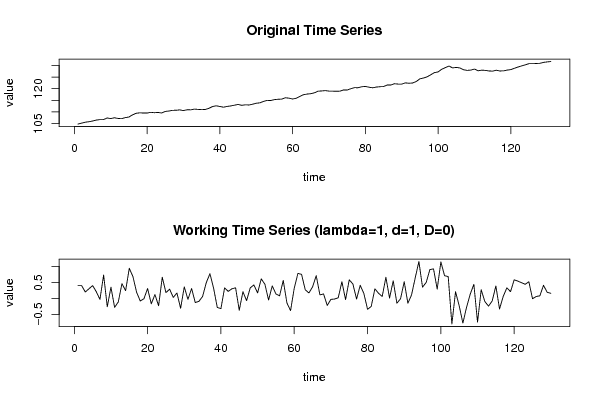
104.8
105.2
105.6
105.8
106.1
106.5
106.71
106.68
107.41
107.15
107.5
107.22
107.11
107.57
107.81
108.75
109.43
109.62
109.54
109.53
109.84
109.67
109.79
109.56
110.22
110.4
110.69
110.72
110.89
110.58
110.94
110.91
111.22
111.09
111
111.06
111.55
112.32
112.64
112.36
112.04
112.37
112.59
112.89
113.22
112.85
113.06
112.99
113.32
113.74
113.91
114.52
114.96
114.91
115.3
115.44
115.52
116.08
115.94
115.56
115.88
116.66
117.41
117.68
117.85
118.21
118.92
119.03
119.17
118.95
118.92
118.9
118.92
119.44
119.40
119.98
120.43
120.41
120.82
120.97
120.63
120.38
120.68
120.84
120.90
121.56
121.57
122.12
121.97
121.96
122.48
122.33
122.44
123.08
124.23
124.58
125.08
125.98
126.90
127.19
128.33
129.04
129.72
128.92
129.13
128.90
128.13
127.85
127.98
128.42
127.68
127.95
127.85
127.61
127.53
127.92
127.59
127.65
127.98
128.19
128.77
129.31
129.80
130.24
130.76
130.75
130.81
130.89
131.30
131.49
131.65


Summary of computational transaction
Raw Inputview raw input (R code)
Raw Outputview raw output of R engine
Computing time2 seconds
R Server'RServer@AstonUniversity' @ vre.aston.ac.uk

\begin{tabular}{lllllllll}
\hline
Summary of computational transaction \tabularnewline
Raw Input & view raw input (R code)  \tabularnewline
Raw Output & view raw output of R engine  \tabularnewline
Computing time & 2 seconds \tabularnewline
R Server & 'RServer@AstonUniversity' @ vre.aston.ac.uk \tabularnewline
\hline
\end{tabular}
%Source: https://freestatistics.org/blog/index.php?pk=113687&T=0

[TABLE]
[ROW][C]Summary of computational transaction[/C][/ROW]
[ROW][C]Raw Input[/C][C]view raw input (R code) [/C][/ROW]
[ROW][C]Raw Output[/C][C]view raw output of R engine [/C][/ROW]
[ROW][C]Computing time[/C][C]2 seconds[/C][/ROW]
[ROW][C]R Server[/C][C]'RServer@AstonUniversity' @ vre.aston.ac.uk[/C][/ROW]
[/TABLE]
Source: https://freestatistics.org/blog/index.php?pk=113687&T=0

Globally Unique Identifier (entire table): ba.freestatistics.org/blog/index.php?pk=113687&T=0

As an alternative you can also use a QR Code:  

The GUIDs for individual cells are displayed in the table below:

Summary of computational transaction
Raw Inputview raw input (R code)
Raw Outputview raw output of R engine
Computing time2 seconds
R Server'RServer@AstonUniversity' @ vre.aston.ac.uk


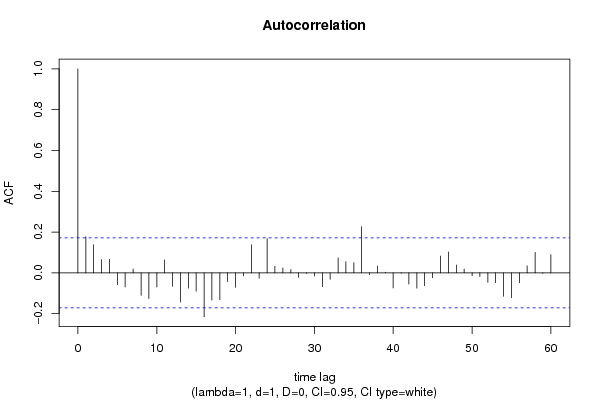
Autocorrelation Function
Time lag kACF(k)T-STATP-value
10.1773722.02240.022596
20.13771.570.059421
30.0654810.74660.228326
40.0660670.75330.226321
5-0.057991-0.66120.254827
6-0.069507-0.79250.214755
70.0185570.21160.416381
8-0.110292-1.25750.105409
9-0.12572-1.43340.077068
10-0.069809-0.79590.213759
110.06350.7240.235179
12-0.065534-0.74720.228146
13-0.143239-1.63320.052426
14-0.074465-0.8490.198714
15-0.089953-1.02560.153489
16-0.214918-2.45040.007799
17-0.133417-1.52120.065321
18-0.132496-1.51070.066648
19-0.042895-0.48910.312807
20-0.071422-0.81430.208472
21-0.014757-0.16830.43332
220.1374811.56750.059711
23-0.026158-0.29820.382997
240.1676811.91190.029048
250.0320280.36520.357787
260.023910.27260.392792
270.0160160.18260.427693
28-0.02226-0.25380.400026
29-0.002897-0.0330.486851
30-0.015534-0.17710.429845
31-0.068216-0.77780.219054
32-0.031986-0.36470.357964
330.0734380.83730.201975
340.0547130.62380.266919
350.0494130.56340.28707
360.226512.58260.005456
37-0.008795-0.10030.460141
380.0330190.37650.353587
390.0026680.03040.487891
40-0.073924-0.84290.200425
41-0.001597-0.01820.49275
42-0.055292-0.63040.264762
43-0.075198-0.85740.196403
44-0.062833-0.71640.237513
45-0.024646-0.2810.389577
460.0820440.93540.175648
470.1022541.16590.1229
480.0387890.44230.329516
490.0184850.21080.416702
50-0.01402-0.15990.436623
51-0.01808-0.20610.418502
52-0.046639-0.53180.297899
53-0.048123-0.54870.292079
54-0.115051-1.31180.095952
55-0.121747-1.38810.083736
56-0.048617-0.55430.290156
570.0343130.39120.348133
580.0996611.13630.128959
59-0.002097-0.02390.490482
600.0887261.01160.156798

\begin{tabular}{lllllllll}
\hline
Autocorrelation Function \tabularnewline
Time lag k & ACF(k) & T-STAT & P-value \tabularnewline
1 & 0.177372 & 2.0224 & 0.022596 \tabularnewline
2 & 0.1377 & 1.57 & 0.059421 \tabularnewline
3 & 0.065481 & 0.7466 & 0.228326 \tabularnewline
4 & 0.066067 & 0.7533 & 0.226321 \tabularnewline
5 & -0.057991 & -0.6612 & 0.254827 \tabularnewline
6 & -0.069507 & -0.7925 & 0.214755 \tabularnewline
7 & 0.018557 & 0.2116 & 0.416381 \tabularnewline
8 & -0.110292 & -1.2575 & 0.105409 \tabularnewline
9 & -0.12572 & -1.4334 & 0.077068 \tabularnewline
10 & -0.069809 & -0.7959 & 0.213759 \tabularnewline
11 & 0.0635 & 0.724 & 0.235179 \tabularnewline
12 & -0.065534 & -0.7472 & 0.228146 \tabularnewline
13 & -0.143239 & -1.6332 & 0.052426 \tabularnewline
14 & -0.074465 & -0.849 & 0.198714 \tabularnewline
15 & -0.089953 & -1.0256 & 0.153489 \tabularnewline
16 & -0.214918 & -2.4504 & 0.007799 \tabularnewline
17 & -0.133417 & -1.5212 & 0.065321 \tabularnewline
18 & -0.132496 & -1.5107 & 0.066648 \tabularnewline
19 & -0.042895 & -0.4891 & 0.312807 \tabularnewline
20 & -0.071422 & -0.8143 & 0.208472 \tabularnewline
21 & -0.014757 & -0.1683 & 0.43332 \tabularnewline
22 & 0.137481 & 1.5675 & 0.059711 \tabularnewline
23 & -0.026158 & -0.2982 & 0.382997 \tabularnewline
24 & 0.167681 & 1.9119 & 0.029048 \tabularnewline
25 & 0.032028 & 0.3652 & 0.357787 \tabularnewline
26 & 0.02391 & 0.2726 & 0.392792 \tabularnewline
27 & 0.016016 & 0.1826 & 0.427693 \tabularnewline
28 & -0.02226 & -0.2538 & 0.400026 \tabularnewline
29 & -0.002897 & -0.033 & 0.486851 \tabularnewline
30 & -0.015534 & -0.1771 & 0.429845 \tabularnewline
31 & -0.068216 & -0.7778 & 0.219054 \tabularnewline
32 & -0.031986 & -0.3647 & 0.357964 \tabularnewline
33 & 0.073438 & 0.8373 & 0.201975 \tabularnewline
34 & 0.054713 & 0.6238 & 0.266919 \tabularnewline
35 & 0.049413 & 0.5634 & 0.28707 \tabularnewline
36 & 0.22651 & 2.5826 & 0.005456 \tabularnewline
37 & -0.008795 & -0.1003 & 0.460141 \tabularnewline
38 & 0.033019 & 0.3765 & 0.353587 \tabularnewline
39 & 0.002668 & 0.0304 & 0.487891 \tabularnewline
40 & -0.073924 & -0.8429 & 0.200425 \tabularnewline
41 & -0.001597 & -0.0182 & 0.49275 \tabularnewline
42 & -0.055292 & -0.6304 & 0.264762 \tabularnewline
43 & -0.075198 & -0.8574 & 0.196403 \tabularnewline
44 & -0.062833 & -0.7164 & 0.237513 \tabularnewline
45 & -0.024646 & -0.281 & 0.389577 \tabularnewline
46 & 0.082044 & 0.9354 & 0.175648 \tabularnewline
47 & 0.102254 & 1.1659 & 0.1229 \tabularnewline
48 & 0.038789 & 0.4423 & 0.329516 \tabularnewline
49 & 0.018485 & 0.2108 & 0.416702 \tabularnewline
50 & -0.01402 & -0.1599 & 0.436623 \tabularnewline
51 & -0.01808 & -0.2061 & 0.418502 \tabularnewline
52 & -0.046639 & -0.5318 & 0.297899 \tabularnewline
53 & -0.048123 & -0.5487 & 0.292079 \tabularnewline
54 & -0.115051 & -1.3118 & 0.095952 \tabularnewline
55 & -0.121747 & -1.3881 & 0.083736 \tabularnewline
56 & -0.048617 & -0.5543 & 0.290156 \tabularnewline
57 & 0.034313 & 0.3912 & 0.348133 \tabularnewline
58 & 0.099661 & 1.1363 & 0.128959 \tabularnewline
59 & -0.002097 & -0.0239 & 0.490482 \tabularnewline
60 & 0.088726 & 1.0116 & 0.156798 \tabularnewline
\hline
\end{tabular}
%Source: https://freestatistics.org/blog/index.php?pk=113687&T=1

[TABLE]
[ROW][C]Autocorrelation Function[/C][/ROW]
[ROW][C]Time lag k[/C][C]ACF(k)[/C][C]T-STAT[/C][C]P-value[/C][/ROW]
[ROW][C]1[/C][C]0.177372[/C][C]2.0224[/C][C]0.022596[/C][/ROW]
[ROW][C]2[/C][C]0.1377[/C][C]1.57[/C][C]0.059421[/C][/ROW]
[ROW][C]3[/C][C]0.065481[/C][C]0.7466[/C][C]0.228326[/C][/ROW]
[ROW][C]4[/C][C]0.066067[/C][C]0.7533[/C][C]0.226321[/C][/ROW]
[ROW][C]5[/C][C]-0.057991[/C][C]-0.6612[/C][C]0.254827[/C][/ROW]
[ROW][C]6[/C][C]-0.069507[/C][C]-0.7925[/C][C]0.214755[/C][/ROW]
[ROW][C]7[/C][C]0.018557[/C][C]0.2116[/C][C]0.416381[/C][/ROW]
[ROW][C]8[/C][C]-0.110292[/C][C]-1.2575[/C][C]0.105409[/C][/ROW]
[ROW][C]9[/C][C]-0.12572[/C][C]-1.4334[/C][C]0.077068[/C][/ROW]
[ROW][C]10[/C][C]-0.069809[/C][C]-0.7959[/C][C]0.213759[/C][/ROW]
[ROW][C]11[/C][C]0.0635[/C][C]0.724[/C][C]0.235179[/C][/ROW]
[ROW][C]12[/C][C]-0.065534[/C][C]-0.7472[/C][C]0.228146[/C][/ROW]
[ROW][C]13[/C][C]-0.143239[/C][C]-1.6332[/C][C]0.052426[/C][/ROW]
[ROW][C]14[/C][C]-0.074465[/C][C]-0.849[/C][C]0.198714[/C][/ROW]
[ROW][C]15[/C][C]-0.089953[/C][C]-1.0256[/C][C]0.153489[/C][/ROW]
[ROW][C]16[/C][C]-0.214918[/C][C]-2.4504[/C][C]0.007799[/C][/ROW]
[ROW][C]17[/C][C]-0.133417[/C][C]-1.5212[/C][C]0.065321[/C][/ROW]
[ROW][C]18[/C][C]-0.132496[/C][C]-1.5107[/C][C]0.066648[/C][/ROW]
[ROW][C]19[/C][C]-0.042895[/C][C]-0.4891[/C][C]0.312807[/C][/ROW]
[ROW][C]20[/C][C]-0.071422[/C][C]-0.8143[/C][C]0.208472[/C][/ROW]
[ROW][C]21[/C][C]-0.014757[/C][C]-0.1683[/C][C]0.43332[/C][/ROW]
[ROW][C]22[/C][C]0.137481[/C][C]1.5675[/C][C]0.059711[/C][/ROW]
[ROW][C]23[/C][C]-0.026158[/C][C]-0.2982[/C][C]0.382997[/C][/ROW]
[ROW][C]24[/C][C]0.167681[/C][C]1.9119[/C][C]0.029048[/C][/ROW]
[ROW][C]25[/C][C]0.032028[/C][C]0.3652[/C][C]0.357787[/C][/ROW]
[ROW][C]26[/C][C]0.02391[/C][C]0.2726[/C][C]0.392792[/C][/ROW]
[ROW][C]27[/C][C]0.016016[/C][C]0.1826[/C][C]0.427693[/C][/ROW]
[ROW][C]28[/C][C]-0.02226[/C][C]-0.2538[/C][C]0.400026[/C][/ROW]
[ROW][C]29[/C][C]-0.002897[/C][C]-0.033[/C][C]0.486851[/C][/ROW]
[ROW][C]30[/C][C]-0.015534[/C][C]-0.1771[/C][C]0.429845[/C][/ROW]
[ROW][C]31[/C][C]-0.068216[/C][C]-0.7778[/C][C]0.219054[/C][/ROW]
[ROW][C]32[/C][C]-0.031986[/C][C]-0.3647[/C][C]0.357964[/C][/ROW]
[ROW][C]33[/C][C]0.073438[/C][C]0.8373[/C][C]0.201975[/C][/ROW]
[ROW][C]34[/C][C]0.054713[/C][C]0.6238[/C][C]0.266919[/C][/ROW]
[ROW][C]35[/C][C]0.049413[/C][C]0.5634[/C][C]0.28707[/C][/ROW]
[ROW][C]36[/C][C]0.22651[/C][C]2.5826[/C][C]0.005456[/C][/ROW]
[ROW][C]37[/C][C]-0.008795[/C][C]-0.1003[/C][C]0.460141[/C][/ROW]
[ROW][C]38[/C][C]0.033019[/C][C]0.3765[/C][C]0.353587[/C][/ROW]
[ROW][C]39[/C][C]0.002668[/C][C]0.0304[/C][C]0.487891[/C][/ROW]
[ROW][C]40[/C][C]-0.073924[/C][C]-0.8429[/C][C]0.200425[/C][/ROW]
[ROW][C]41[/C][C]-0.001597[/C][C]-0.0182[/C][C]0.49275[/C][/ROW]
[ROW][C]42[/C][C]-0.055292[/C][C]-0.6304[/C][C]0.264762[/C][/ROW]
[ROW][C]43[/C][C]-0.075198[/C][C]-0.8574[/C][C]0.196403[/C][/ROW]
[ROW][C]44[/C][C]-0.062833[/C][C]-0.7164[/C][C]0.237513[/C][/ROW]
[ROW][C]45[/C][C]-0.024646[/C][C]-0.281[/C][C]0.389577[/C][/ROW]
[ROW][C]46[/C][C]0.082044[/C][C]0.9354[/C][C]0.175648[/C][/ROW]
[ROW][C]47[/C][C]0.102254[/C][C]1.1659[/C][C]0.1229[/C][/ROW]
[ROW][C]48[/C][C]0.038789[/C][C]0.4423[/C][C]0.329516[/C][/ROW]
[ROW][C]49[/C][C]0.018485[/C][C]0.2108[/C][C]0.416702[/C][/ROW]
[ROW][C]50[/C][C]-0.01402[/C][C]-0.1599[/C][C]0.436623[/C][/ROW]
[ROW][C]51[/C][C]-0.01808[/C][C]-0.2061[/C][C]0.418502[/C][/ROW]
[ROW][C]52[/C][C]-0.046639[/C][C]-0.5318[/C][C]0.297899[/C][/ROW]
[ROW][C]53[/C][C]-0.048123[/C][C]-0.5487[/C][C]0.292079[/C][/ROW]
[ROW][C]54[/C][C]-0.115051[/C][C]-1.3118[/C][C]0.095952[/C][/ROW]
[ROW][C]55[/C][C]-0.121747[/C][C]-1.3881[/C][C]0.083736[/C][/ROW]
[ROW][C]56[/C][C]-0.048617[/C][C]-0.5543[/C][C]0.290156[/C][/ROW]
[ROW][C]57[/C][C]0.034313[/C][C]0.3912[/C][C]0.348133[/C][/ROW]
[ROW][C]58[/C][C]0.099661[/C][C]1.1363[/C][C]0.128959[/C][/ROW]
[ROW][C]59[/C][C]-0.002097[/C][C]-0.0239[/C][C]0.490482[/C][/ROW]
[ROW][C]60[/C][C]0.088726[/C][C]1.0116[/C][C]0.156798[/C][/ROW]
[/TABLE]
Source: https://freestatistics.org/blog/index.php?pk=113687&T=1

Globally Unique Identifier (entire table): ba.freestatistics.org/blog/index.php?pk=113687&T=1

As an alternative you can also use a QR Code:  

The GUIDs for individual cells are displayed in the table below:

Autocorrelation Function
Time lag kACF(k)T-STATP-value
10.1773722.02240.022596
20.13771.570.059421
30.0654810.74660.228326
40.0660670.75330.226321
5-0.057991-0.66120.254827
6-0.069507-0.79250.214755
70.0185570.21160.416381
8-0.110292-1.25750.105409
9-0.12572-1.43340.077068
10-0.069809-0.79590.213759
110.06350.7240.235179
12-0.065534-0.74720.228146
13-0.143239-1.63320.052426
14-0.074465-0.8490.198714
15-0.089953-1.02560.153489
16-0.214918-2.45040.007799
17-0.133417-1.52120.065321
18-0.132496-1.51070.066648
19-0.042895-0.48910.312807
20-0.071422-0.81430.208472
21-0.014757-0.16830.43332
220.1374811.56750.059711
23-0.026158-0.29820.382997
240.1676811.91190.029048
250.0320280.36520.357787
260.023910.27260.392792
270.0160160.18260.427693
28-0.02226-0.25380.400026
29-0.002897-0.0330.486851
30-0.015534-0.17710.429845
31-0.068216-0.77780.219054
32-0.031986-0.36470.357964
330.0734380.83730.201975
340.0547130.62380.266919
350.0494130.56340.28707
360.226512.58260.005456
37-0.008795-0.10030.460141
380.0330190.37650.353587
390.0026680.03040.487891
40-0.073924-0.84290.200425
41-0.001597-0.01820.49275
42-0.055292-0.63040.264762
43-0.075198-0.85740.196403
44-0.062833-0.71640.237513
45-0.024646-0.2810.389577
460.0820440.93540.175648
470.1022541.16590.1229
480.0387890.44230.329516
490.0184850.21080.416702
50-0.01402-0.15990.436623
51-0.01808-0.20610.418502
52-0.046639-0.53180.297899
53-0.048123-0.54870.292079
54-0.115051-1.31180.095952
55-0.121747-1.38810.083736
56-0.048617-0.55430.290156
570.0343130.39120.348133
580.0996611.13630.128959
59-0.002097-0.02390.490482
600.0887261.01160.156798


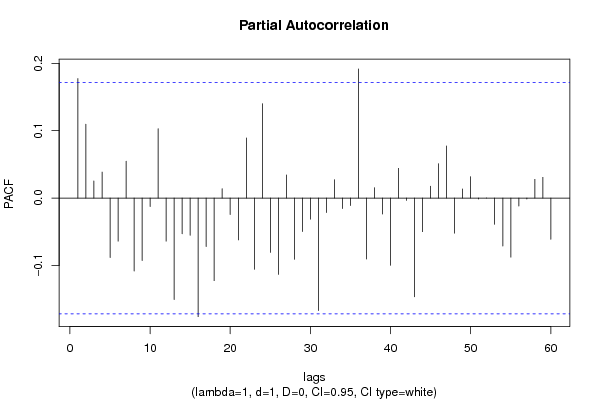
Partial Autocorrelation Function
Time lag kPACF(k)T-STATP-value
10.1773722.02240.022596
20.109691.25070.106653
30.0253740.28930.386401
40.0385410.43940.330537
5-0.088324-1.0070.157891
6-0.063933-0.72890.233673
70.0546610.62320.267112
8-0.108341-1.23530.109477
9-0.092776-1.05780.146052
10-0.012509-0.14260.443402
110.1028871.17310.121453
12-0.063883-0.72840.233847
13-0.150572-1.71680.0442
14-0.052833-0.60240.273984
15-0.055268-0.63020.264851
16-0.175936-2.0060.023467
17-0.071763-0.81820.207364
18-0.122561-1.39740.082335
190.0140090.15970.436674
20-0.024432-0.27860.390511
21-0.06207-0.70770.240195
220.0891411.01640.155673
23-0.105678-1.20490.115213
240.1401711.59820.056214
25-0.080576-0.91870.179975
26-0.113199-1.29070.099555
270.0343770.3920.347864
28-0.090882-1.03620.151013
29-0.049706-0.56670.285936
30-0.031257-0.35640.361063
31-0.166895-1.90290.029633
32-0.021522-0.24540.403272
330.0272630.31090.378206
34-0.015549-0.17730.429781
35-0.011059-0.12610.449928
360.1916552.18520.015333
37-0.09036-1.03030.152399
380.0153640.17520.430605
39-0.023551-0.26850.394362
40-0.09966-1.13630.12896
410.0441710.50360.307689
42-0.00341-0.03890.484524
43-0.146384-1.6690.048758
44-0.049796-0.56780.285586
450.0176960.20180.420208
460.0511250.58290.280479
470.0774130.88260.189529
48-0.052017-0.59310.277076
490.0134240.15310.439297
500.0317740.36230.358868
51-0.001278-0.01460.494199
520.0001420.00160.499357
53-0.038846-0.44290.329284
54-0.071167-0.81140.209301
55-0.087665-0.99950.159697
56-0.011829-0.13490.446463
57-0.001385-0.01580.493713
580.0278040.3170.375869
590.0307970.35110.363024
60-0.061073-0.69630.24373

\begin{tabular}{lllllllll}
\hline
Partial Autocorrelation Function \tabularnewline
Time lag k & PACF(k) & T-STAT & P-value \tabularnewline
1 & 0.177372 & 2.0224 & 0.022596 \tabularnewline
2 & 0.10969 & 1.2507 & 0.106653 \tabularnewline
3 & 0.025374 & 0.2893 & 0.386401 \tabularnewline
4 & 0.038541 & 0.4394 & 0.330537 \tabularnewline
5 & -0.088324 & -1.007 & 0.157891 \tabularnewline
6 & -0.063933 & -0.7289 & 0.233673 \tabularnewline
7 & 0.054661 & 0.6232 & 0.267112 \tabularnewline
8 & -0.108341 & -1.2353 & 0.109477 \tabularnewline
9 & -0.092776 & -1.0578 & 0.146052 \tabularnewline
10 & -0.012509 & -0.1426 & 0.443402 \tabularnewline
11 & 0.102887 & 1.1731 & 0.121453 \tabularnewline
12 & -0.063883 & -0.7284 & 0.233847 \tabularnewline
13 & -0.150572 & -1.7168 & 0.0442 \tabularnewline
14 & -0.052833 & -0.6024 & 0.273984 \tabularnewline
15 & -0.055268 & -0.6302 & 0.264851 \tabularnewline
16 & -0.175936 & -2.006 & 0.023467 \tabularnewline
17 & -0.071763 & -0.8182 & 0.207364 \tabularnewline
18 & -0.122561 & -1.3974 & 0.082335 \tabularnewline
19 & 0.014009 & 0.1597 & 0.436674 \tabularnewline
20 & -0.024432 & -0.2786 & 0.390511 \tabularnewline
21 & -0.06207 & -0.7077 & 0.240195 \tabularnewline
22 & 0.089141 & 1.0164 & 0.155673 \tabularnewline
23 & -0.105678 & -1.2049 & 0.115213 \tabularnewline
24 & 0.140171 & 1.5982 & 0.056214 \tabularnewline
25 & -0.080576 & -0.9187 & 0.179975 \tabularnewline
26 & -0.113199 & -1.2907 & 0.099555 \tabularnewline
27 & 0.034377 & 0.392 & 0.347864 \tabularnewline
28 & -0.090882 & -1.0362 & 0.151013 \tabularnewline
29 & -0.049706 & -0.5667 & 0.285936 \tabularnewline
30 & -0.031257 & -0.3564 & 0.361063 \tabularnewline
31 & -0.166895 & -1.9029 & 0.029633 \tabularnewline
32 & -0.021522 & -0.2454 & 0.403272 \tabularnewline
33 & 0.027263 & 0.3109 & 0.378206 \tabularnewline
34 & -0.015549 & -0.1773 & 0.429781 \tabularnewline
35 & -0.011059 & -0.1261 & 0.449928 \tabularnewline
36 & 0.191655 & 2.1852 & 0.015333 \tabularnewline
37 & -0.09036 & -1.0303 & 0.152399 \tabularnewline
38 & 0.015364 & 0.1752 & 0.430605 \tabularnewline
39 & -0.023551 & -0.2685 & 0.394362 \tabularnewline
40 & -0.09966 & -1.1363 & 0.12896 \tabularnewline
41 & 0.044171 & 0.5036 & 0.307689 \tabularnewline
42 & -0.00341 & -0.0389 & 0.484524 \tabularnewline
43 & -0.146384 & -1.669 & 0.048758 \tabularnewline
44 & -0.049796 & -0.5678 & 0.285586 \tabularnewline
45 & 0.017696 & 0.2018 & 0.420208 \tabularnewline
46 & 0.051125 & 0.5829 & 0.280479 \tabularnewline
47 & 0.077413 & 0.8826 & 0.189529 \tabularnewline
48 & -0.052017 & -0.5931 & 0.277076 \tabularnewline
49 & 0.013424 & 0.1531 & 0.439297 \tabularnewline
50 & 0.031774 & 0.3623 & 0.358868 \tabularnewline
51 & -0.001278 & -0.0146 & 0.494199 \tabularnewline
52 & 0.000142 & 0.0016 & 0.499357 \tabularnewline
53 & -0.038846 & -0.4429 & 0.329284 \tabularnewline
54 & -0.071167 & -0.8114 & 0.209301 \tabularnewline
55 & -0.087665 & -0.9995 & 0.159697 \tabularnewline
56 & -0.011829 & -0.1349 & 0.446463 \tabularnewline
57 & -0.001385 & -0.0158 & 0.493713 \tabularnewline
58 & 0.027804 & 0.317 & 0.375869 \tabularnewline
59 & 0.030797 & 0.3511 & 0.363024 \tabularnewline
60 & -0.061073 & -0.6963 & 0.24373 \tabularnewline
\hline
\end{tabular}
%Source: https://freestatistics.org/blog/index.php?pk=113687&T=2

[TABLE]
[ROW][C]Partial Autocorrelation Function[/C][/ROW]
[ROW][C]Time lag k[/C][C]PACF(k)[/C][C]T-STAT[/C][C]P-value[/C][/ROW]
[ROW][C]1[/C][C]0.177372[/C][C]2.0224[/C][C]0.022596[/C][/ROW]
[ROW][C]2[/C][C]0.10969[/C][C]1.2507[/C][C]0.106653[/C][/ROW]
[ROW][C]3[/C][C]0.025374[/C][C]0.2893[/C][C]0.386401[/C][/ROW]
[ROW][C]4[/C][C]0.038541[/C][C]0.4394[/C][C]0.330537[/C][/ROW]
[ROW][C]5[/C][C]-0.088324[/C][C]-1.007[/C][C]0.157891[/C][/ROW]
[ROW][C]6[/C][C]-0.063933[/C][C]-0.7289[/C][C]0.233673[/C][/ROW]
[ROW][C]7[/C][C]0.054661[/C][C]0.6232[/C][C]0.267112[/C][/ROW]
[ROW][C]8[/C][C]-0.108341[/C][C]-1.2353[/C][C]0.109477[/C][/ROW]
[ROW][C]9[/C][C]-0.092776[/C][C]-1.0578[/C][C]0.146052[/C][/ROW]
[ROW][C]10[/C][C]-0.012509[/C][C]-0.1426[/C][C]0.443402[/C][/ROW]
[ROW][C]11[/C][C]0.102887[/C][C]1.1731[/C][C]0.121453[/C][/ROW]
[ROW][C]12[/C][C]-0.063883[/C][C]-0.7284[/C][C]0.233847[/C][/ROW]
[ROW][C]13[/C][C]-0.150572[/C][C]-1.7168[/C][C]0.0442[/C][/ROW]
[ROW][C]14[/C][C]-0.052833[/C][C]-0.6024[/C][C]0.273984[/C][/ROW]
[ROW][C]15[/C][C]-0.055268[/C][C]-0.6302[/C][C]0.264851[/C][/ROW]
[ROW][C]16[/C][C]-0.175936[/C][C]-2.006[/C][C]0.023467[/C][/ROW]
[ROW][C]17[/C][C]-0.071763[/C][C]-0.8182[/C][C]0.207364[/C][/ROW]
[ROW][C]18[/C][C]-0.122561[/C][C]-1.3974[/C][C]0.082335[/C][/ROW]
[ROW][C]19[/C][C]0.014009[/C][C]0.1597[/C][C]0.436674[/C][/ROW]
[ROW][C]20[/C][C]-0.024432[/C][C]-0.2786[/C][C]0.390511[/C][/ROW]
[ROW][C]21[/C][C]-0.06207[/C][C]-0.7077[/C][C]0.240195[/C][/ROW]
[ROW][C]22[/C][C]0.089141[/C][C]1.0164[/C][C]0.155673[/C][/ROW]
[ROW][C]23[/C][C]-0.105678[/C][C]-1.2049[/C][C]0.115213[/C][/ROW]
[ROW][C]24[/C][C]0.140171[/C][C]1.5982[/C][C]0.056214[/C][/ROW]
[ROW][C]25[/C][C]-0.080576[/C][C]-0.9187[/C][C]0.179975[/C][/ROW]
[ROW][C]26[/C][C]-0.113199[/C][C]-1.2907[/C][C]0.099555[/C][/ROW]
[ROW][C]27[/C][C]0.034377[/C][C]0.392[/C][C]0.347864[/C][/ROW]
[ROW][C]28[/C][C]-0.090882[/C][C]-1.0362[/C][C]0.151013[/C][/ROW]
[ROW][C]29[/C][C]-0.049706[/C][C]-0.5667[/C][C]0.285936[/C][/ROW]
[ROW][C]30[/C][C]-0.031257[/C][C]-0.3564[/C][C]0.361063[/C][/ROW]
[ROW][C]31[/C][C]-0.166895[/C][C]-1.9029[/C][C]0.029633[/C][/ROW]
[ROW][C]32[/C][C]-0.021522[/C][C]-0.2454[/C][C]0.403272[/C][/ROW]
[ROW][C]33[/C][C]0.027263[/C][C]0.3109[/C][C]0.378206[/C][/ROW]
[ROW][C]34[/C][C]-0.015549[/C][C]-0.1773[/C][C]0.429781[/C][/ROW]
[ROW][C]35[/C][C]-0.011059[/C][C]-0.1261[/C][C]0.449928[/C][/ROW]
[ROW][C]36[/C][C]0.191655[/C][C]2.1852[/C][C]0.015333[/C][/ROW]
[ROW][C]37[/C][C]-0.09036[/C][C]-1.0303[/C][C]0.152399[/C][/ROW]
[ROW][C]38[/C][C]0.015364[/C][C]0.1752[/C][C]0.430605[/C][/ROW]
[ROW][C]39[/C][C]-0.023551[/C][C]-0.2685[/C][C]0.394362[/C][/ROW]
[ROW][C]40[/C][C]-0.09966[/C][C]-1.1363[/C][C]0.12896[/C][/ROW]
[ROW][C]41[/C][C]0.044171[/C][C]0.5036[/C][C]0.307689[/C][/ROW]
[ROW][C]42[/C][C]-0.00341[/C][C]-0.0389[/C][C]0.484524[/C][/ROW]
[ROW][C]43[/C][C]-0.146384[/C][C]-1.669[/C][C]0.048758[/C][/ROW]
[ROW][C]44[/C][C]-0.049796[/C][C]-0.5678[/C][C]0.285586[/C][/ROW]
[ROW][C]45[/C][C]0.017696[/C][C]0.2018[/C][C]0.420208[/C][/ROW]
[ROW][C]46[/C][C]0.051125[/C][C]0.5829[/C][C]0.280479[/C][/ROW]
[ROW][C]47[/C][C]0.077413[/C][C]0.8826[/C][C]0.189529[/C][/ROW]
[ROW][C]48[/C][C]-0.052017[/C][C]-0.5931[/C][C]0.277076[/C][/ROW]
[ROW][C]49[/C][C]0.013424[/C][C]0.1531[/C][C]0.439297[/C][/ROW]
[ROW][C]50[/C][C]0.031774[/C][C]0.3623[/C][C]0.358868[/C][/ROW]
[ROW][C]51[/C][C]-0.001278[/C][C]-0.0146[/C][C]0.494199[/C][/ROW]
[ROW][C]52[/C][C]0.000142[/C][C]0.0016[/C][C]0.499357[/C][/ROW]
[ROW][C]53[/C][C]-0.038846[/C][C]-0.4429[/C][C]0.329284[/C][/ROW]
[ROW][C]54[/C][C]-0.071167[/C][C]-0.8114[/C][C]0.209301[/C][/ROW]
[ROW][C]55[/C][C]-0.087665[/C][C]-0.9995[/C][C]0.159697[/C][/ROW]
[ROW][C]56[/C][C]-0.011829[/C][C]-0.1349[/C][C]0.446463[/C][/ROW]
[ROW][C]57[/C][C]-0.001385[/C][C]-0.0158[/C][C]0.493713[/C][/ROW]
[ROW][C]58[/C][C]0.027804[/C][C]0.317[/C][C]0.375869[/C][/ROW]
[ROW][C]59[/C][C]0.030797[/C][C]0.3511[/C][C]0.363024[/C][/ROW]
[ROW][C]60[/C][C]-0.061073[/C][C]-0.6963[/C][C]0.24373[/C][/ROW]
[/TABLE]
Source: https://freestatistics.org/blog/index.php?pk=113687&T=2

Globally Unique Identifier (entire table): ba.freestatistics.org/blog/index.php?pk=113687&T=2

As an alternative you can also use a QR Code:  

The GUIDs for individual cells are displayed in the table below:

Partial Autocorrelation Function
Time lag kPACF(k)T-STATP-value
10.1773722.02240.022596
20.109691.25070.106653
30.0253740.28930.386401
40.0385410.43940.330537
5-0.088324-1.0070.157891
6-0.063933-0.72890.233673
70.0546610.62320.267112
8-0.108341-1.23530.109477
9-0.092776-1.05780.146052
10-0.012509-0.14260.443402
110.1028871.17310.121453
12-0.063883-0.72840.233847
13-0.150572-1.71680.0442
14-0.052833-0.60240.273984
15-0.055268-0.63020.264851
16-0.175936-2.0060.023467
17-0.071763-0.81820.207364
18-0.122561-1.39740.082335
190.0140090.15970.436674
20-0.024432-0.27860.390511
21-0.06207-0.70770.240195
220.0891411.01640.155673
23-0.105678-1.20490.115213
240.1401711.59820.056214
25-0.080576-0.91870.179975
26-0.113199-1.29070.099555
270.0343770.3920.347864
28-0.090882-1.03620.151013
29-0.049706-0.56670.285936
30-0.031257-0.35640.361063
31-0.166895-1.90290.029633
32-0.021522-0.24540.403272
330.0272630.31090.378206
34-0.015549-0.17730.429781
35-0.011059-0.12610.449928
360.1916552.18520.015333
37-0.09036-1.03030.152399
380.0153640.17520.430605
39-0.023551-0.26850.394362
40-0.09966-1.13630.12896
410.0441710.50360.307689
42-0.00341-0.03890.484524
43-0.146384-1.6690.048758
44-0.049796-0.56780.285586
450.0176960.20180.420208
460.0511250.58290.280479
470.0774130.88260.189529
48-0.052017-0.59310.277076
490.0134240.15310.439297
500.0317740.36230.358868
51-0.001278-0.01460.494199
520.0001420.00160.499357
53-0.038846-0.44290.329284
54-0.071167-0.81140.209301
55-0.087665-0.99950.159697
56-0.011829-0.13490.446463
57-0.001385-0.01580.493713
580.0278040.3170.375869
590.0307970.35110.363024
60-0.061073-0.69630.24373


Parameters (Session):
par1 = 60 ; par2 = 1 ; par3 = 1 ; par4 = 0 ; par5 = 12 ; par6 = White Noise ; par7 = 0.95 ;
Parameters (R input):
par1 = 60 ; par2 = 1 ; par3 = 1 ; par4 = 0 ; par5 = 12 ; par6 = White Noise ; par7 = 0.95 ; par8 = ;
R code (references can be found in the software module):
if (par1 == 'Default') {
par1 = 10*log10(length(x))
} else {
par1 <- as.numeric(par1)
}
par2 <- as.numeric(par2)
par3 <- as.numeric(par3)
par4 <- as.numeric(par4)
par5 <- as.numeric(par5)
if (par6 == 'White Noise') par6 <- 'white' else par6 <- 'ma'
par7 <- as.numeric(par7)
if (par8 != '') par8 <- as.numeric(par8)
ox <- x
if (par8 == '') {
if (par2 == 0) {
x <- log(x)
} else {
x <- (x ^ par2 - 1) / par2
}
} else {
x <- log(x,base=par8)
}
if (par3 > 0) x <- diff(x,lag=1,difference=par3)
if (par4 > 0) x <- diff(x,lag=par5,difference=par4)
bitmap(file='picts.png')
op <- par(mfrow=c(2,1))
plot(ox,type='l',main='Original Time Series',xlab='time',ylab='value')
if (par8=='') {
mytitle <- paste('Working Time Series (lambda=',par2,', d=',par3,', D=',par4,')',sep='')
mysub <- paste('(lambda=',par2,', d=',par3,', D=',par4,', CI=', par7, ', CI type=',par6,')',sep='')
} else {
mytitle <- paste('Working Time Series (base=',par8,', d=',par3,', D=',par4,')',sep='')
mysub <- paste('(base=',par8,', d=',par3,', D=',par4,', CI=', par7, ', CI type=',par6,')',sep='')
}
plot(x,type='l', main=mytitle,xlab='time',ylab='value')
par(op)
dev.off()
bitmap(file='pic1.png')
racf <- acf(x, par1, main='Autocorrelation', xlab='time lag', ylab='ACF', ci.type=par6, ci=par7, sub=mysub)
dev.off()
bitmap(file='pic2.png')
rpacf <- pacf(x,par1,main='Partial Autocorrelation',xlab='lags',ylab='PACF',sub=mysub)
dev.off()
(myacf <- c(racf$acf))
(mypacf <- c(rpacf$acf))
lengthx <- length(x)
sqrtn <- sqrt(lengthx)
load(file='createtable')
a<-table.start()
a<-table.row.start(a)
a<-table.element(a,'Autocorrelation Function',4,TRUE)
a<-table.row.end(a)
a<-table.row.start(a)
a<-table.element(a,'Time lag k',header=TRUE)
a<-table.element(a,hyperlink('basics.htm','ACF(k)','click here for more information about the Autocorrelation Function'),header=TRUE)
a<-table.element(a,'T-STAT',header=TRUE)
a<-table.element(a,'P-value',header=TRUE)
a<-table.row.end(a)
for (i in 2:(par1+1)) {
a<-table.row.start(a)
a<-table.element(a,i-1,header=TRUE)
a<-table.element(a,round(myacf[i],6))
mytstat <- myacf[i]*sqrtn
a<-table.element(a,round(mytstat,4))
a<-table.element(a,round(1-pt(abs(mytstat),lengthx),6))
a<-table.row.end(a)
}
a<-table.end(a)
table.save(a,file='mytable.tab')
a<-table.start()
a<-table.row.start(a)
a<-table.element(a,'Partial Autocorrelation Function',4,TRUE)
a<-table.row.end(a)
a<-table.row.start(a)
a<-table.element(a,'Time lag k',header=TRUE)
a<-table.element(a,hyperlink('basics.htm','PACF(k)','click here for more information about the Partial Autocorrelation Function'),header=TRUE)
a<-table.element(a,'T-STAT',header=TRUE)
a<-table.element(a,'P-value',header=TRUE)
a<-table.row.end(a)
for (i in 1:par1) {
a<-table.row.start(a)
a<-table.element(a,i,header=TRUE)
a<-table.element(a,round(mypacf[i],6))
mytstat <- mypacf[i]*sqrtn
a<-table.element(a,round(mytstat,4))
a<-table.element(a,round(1-pt(abs(mytstat),lengthx),6))
a<-table.row.end(a)
}
a<-table.end(a)
table.save(a,file='mytable1.tab')