Free Statistics

of Irreproducible Research!

Author's title

Author*The author of this computation has been verified*
R Software Modulerwasp_arimabackwardselection.wasp
Title produced by softwareARIMA Backward Selection
Date of computationTue, 21 Dec 2010 15:15:51 +0000
Cite this page as followsStatistical Computations at FreeStatistics.org, Office for Research Development and Education, URL https://freestatistics.org/blog/index.php?v=date/2010/Dec/21/t1292944539gv4lugpbrvjyqr6.htm/, Retrieved Sat, 18 May 2024 20:20:09 +0000
Statistical Computations at FreeStatistics.org, Office for Research Development and Education, URL https://freestatistics.org/blog/index.php?pk=113663, Retrieved Sat, 18 May 2024 20:20:09 +0000
QR Codes:

Original text written by user:
IsPrivate?No (this computation is public)
User-defined keywords
Estimated Impact182
Family? (F = Feedback message, R = changed R code, M = changed R Module, P = changed Parameters, D = changed Data)
-       [ARIMA Backward Selection] [Arima backwards s...] [2010-12-21 15:15:51] [65e95fe5923d75db266bc83cb8a34c47] [Current]
- RMP     [Structural Time Series Models] [structural Time s...] [2010-12-21 20:38:33] [ca50229b6b451ac8f5a30a9e3154d674]
- RMPD    [Cross Correlation Function] [cross correlation...] [2010-12-22 19:33:25] [ca50229b6b451ac8f5a30a9e3154d674]
- RMPD    [Cross Correlation Function] [cross correlation...] [2010-12-22 19:38:49] [ca50229b6b451ac8f5a30a9e3154d674]
Feedback Forum

Post a new message
Dataseries X:
10570
10297
10635
10872
10296
10383
10431
10574
10653
10805
10872
10625
10407
10463
10556
10646
10702
11353
11346
11451
11964
12574
13031
13812
14544
14931
14886
16005
17064
15168
16050
15839
15137
14954
15648
15305
15579
16348
15928
16171
15937
15713
15594
15683
16438
17032
17696
17745
19394
20148
20108
18584
18441
18391
19178
18079
18483
19644
19195
19650
20830
23595
22937
21814
21928
21777
21383
21467
22052
22680
24320
24977
25204


Summary of computational transaction
Raw Inputview raw input (R code)
Raw Outputview raw output of R engine
Computing time11 seconds
R Server'Gwilym Jenkins' @ 72.249.127.135

\begin{tabular}{lllllllll}
\hline
Summary of computational transaction \tabularnewline
Raw Input & view raw input (R code)  \tabularnewline
Raw Output & view raw output of R engine  \tabularnewline
Computing time & 11 seconds \tabularnewline
R Server & 'Gwilym Jenkins' @ 72.249.127.135 \tabularnewline
\hline
\end{tabular}
%Source: https://freestatistics.org/blog/index.php?pk=113663&T=0

[TABLE]
[ROW][C]Summary of computational transaction[/C][/ROW]
[ROW][C]Raw Input[/C][C]view raw input (R code) [/C][/ROW]
[ROW][C]Raw Output[/C][C]view raw output of R engine [/C][/ROW]
[ROW][C]Computing time[/C][C]11 seconds[/C][/ROW]
[ROW][C]R Server[/C][C]'Gwilym Jenkins' @ 72.249.127.135[/C][/ROW]
[/TABLE]
Source: https://freestatistics.org/blog/index.php?pk=113663&T=0

Globally Unique Identifier (entire table): ba.freestatistics.org/blog/index.php?pk=113663&T=0

As an alternative you can also use a QR Code:  

The GUIDs for individual cells are displayed in the table below:

Summary of computational transaction
Raw Inputview raw input (R code)
Raw Outputview raw output of R engine
Computing time11 seconds
R Server'Gwilym Jenkins' @ 72.249.127.135


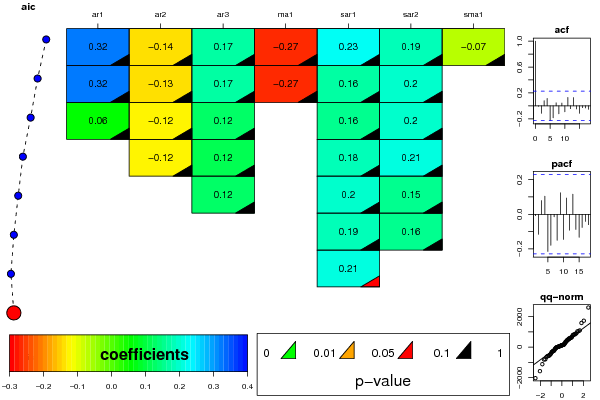
ARIMA Parameter Estimation and Backward Selection
Iterationar1ar2ar3ma1sar1sar2sma1
Estimates ( 1 )0.3225-0.13530.17-0.26780.22850.185-0.0677
(p-val)(0.4334 )(0.3113 )(0.178 )(0.5072 )(0.7577 )(0.387 )(0.9293 )
Estimates ( 2 )0.321-0.1340.1714-0.26730.1640.19780
(p-val)(0.4317 )(0.3122 )(0.1696 )(0.5047 )(0.2328 )(0.1855 )(NA )
Estimates ( 3 )0.0595-0.12370.124200.15780.20110
(p-val)(0.6475 )(0.3283 )(0.3037 )(NA )(0.2461 )(0.181 )(NA )
Estimates ( 4 )0-0.12190.117900.18230.20850
(p-val)(NA )(0.3376 )(0.3275 )(NA )(0.1447 )(0.1669 )(NA )
Estimates ( 5 )000.120700.19920.150
(p-val)(NA )(NA )(0.3215 )(NA )(0.1197 )(0.2872 )(NA )
Estimates ( 6 )00000.18650.16110
(p-val)(NA )(NA )(NA )(NA )(0.1372 )(0.2465 )(NA )
Estimates ( 7 )00000.214300
(p-val)(NA )(NA )(NA )(NA )(0.0995 )(NA )(NA )
Estimates ( 8 )0000000
(p-val)(NA )(NA )(NA )(NA )(NA )(NA )(NA )
Estimates ( 9 )NANANANANANANA
(p-val)(NA )(NA )(NA )(NA )(NA )(NA )(NA )
Estimates ( 10 )NANANANANANANA
(p-val)(NA )(NA )(NA )(NA )(NA )(NA )(NA )
Estimates ( 11 )NANANANANANANA
(p-val)(NA )(NA )(NA )(NA )(NA )(NA )(NA )
Estimates ( 12 )NANANANANANANA
(p-val)(NA )(NA )(NA )(NA )(NA )(NA )(NA )
Estimates ( 13 )NANANANANANANA
(p-val)(NA )(NA )(NA )(NA )(NA )(NA )(NA )

\begin{tabular}{lllllllll}
\hline
ARIMA Parameter Estimation and Backward Selection \tabularnewline
Iteration & ar1 & ar2 & ar3 & ma1 & sar1 & sar2 & sma1 \tabularnewline
Estimates ( 1 ) & 0.3225 & -0.1353 & 0.17 & -0.2678 & 0.2285 & 0.185 & -0.0677 \tabularnewline
(p-val) & (0.4334 ) & (0.3113 ) & (0.178 ) & (0.5072 ) & (0.7577 ) & (0.387 ) & (0.9293 ) \tabularnewline
Estimates ( 2 ) & 0.321 & -0.134 & 0.1714 & -0.2673 & 0.164 & 0.1978 & 0 \tabularnewline
(p-val) & (0.4317 ) & (0.3122 ) & (0.1696 ) & (0.5047 ) & (0.2328 ) & (0.1855 ) & (NA ) \tabularnewline
Estimates ( 3 ) & 0.0595 & -0.1237 & 0.1242 & 0 & 0.1578 & 0.2011 & 0 \tabularnewline
(p-val) & (0.6475 ) & (0.3283 ) & (0.3037 ) & (NA ) & (0.2461 ) & (0.181 ) & (NA ) \tabularnewline
Estimates ( 4 ) & 0 & -0.1219 & 0.1179 & 0 & 0.1823 & 0.2085 & 0 \tabularnewline
(p-val) & (NA ) & (0.3376 ) & (0.3275 ) & (NA ) & (0.1447 ) & (0.1669 ) & (NA ) \tabularnewline
Estimates ( 5 ) & 0 & 0 & 0.1207 & 0 & 0.1992 & 0.15 & 0 \tabularnewline
(p-val) & (NA ) & (NA ) & (0.3215 ) & (NA ) & (0.1197 ) & (0.2872 ) & (NA ) \tabularnewline
Estimates ( 6 ) & 0 & 0 & 0 & 0 & 0.1865 & 0.1611 & 0 \tabularnewline
(p-val) & (NA ) & (NA ) & (NA ) & (NA ) & (0.1372 ) & (0.2465 ) & (NA ) \tabularnewline
Estimates ( 7 ) & 0 & 0 & 0 & 0 & 0.2143 & 0 & 0 \tabularnewline
(p-val) & (NA ) & (NA ) & (NA ) & (NA ) & (0.0995 ) & (NA ) & (NA ) \tabularnewline
Estimates ( 8 ) & 0 & 0 & 0 & 0 & 0 & 0 & 0 \tabularnewline
(p-val) & (NA ) & (NA ) & (NA ) & (NA ) & (NA ) & (NA ) & (NA ) \tabularnewline
Estimates ( 9 ) & NA & NA & NA & NA & NA & NA & NA \tabularnewline
(p-val) & (NA ) & (NA ) & (NA ) & (NA ) & (NA ) & (NA ) & (NA ) \tabularnewline
Estimates ( 10 ) & NA & NA & NA & NA & NA & NA & NA \tabularnewline
(p-val) & (NA ) & (NA ) & (NA ) & (NA ) & (NA ) & (NA ) & (NA ) \tabularnewline
Estimates ( 11 ) & NA & NA & NA & NA & NA & NA & NA \tabularnewline
(p-val) & (NA ) & (NA ) & (NA ) & (NA ) & (NA ) & (NA ) & (NA ) \tabularnewline
Estimates ( 12 ) & NA & NA & NA & NA & NA & NA & NA \tabularnewline
(p-val) & (NA ) & (NA ) & (NA ) & (NA ) & (NA ) & (NA ) & (NA ) \tabularnewline
Estimates ( 13 ) & NA & NA & NA & NA & NA & NA & NA \tabularnewline
(p-val) & (NA ) & (NA ) & (NA ) & (NA ) & (NA ) & (NA ) & (NA ) \tabularnewline
\hline
\end{tabular}
%Source: https://freestatistics.org/blog/index.php?pk=113663&T=1

[TABLE]
[ROW][C]ARIMA Parameter Estimation and Backward Selection[/C][/ROW]
[ROW][C]Iteration[/C][C]ar1[/C][C]ar2[/C][C]ar3[/C][C]ma1[/C][C]sar1[/C][C]sar2[/C][C]sma1[/C][/ROW]
[ROW][C]Estimates ( 1 )[/C][C]0.3225[/C][C]-0.1353[/C][C]0.17[/C][C]-0.2678[/C][C]0.2285[/C][C]0.185[/C][C]-0.0677[/C][/ROW]
[ROW][C](p-val)[/C][C](0.4334 )[/C][C](0.3113 )[/C][C](0.178 )[/C][C](0.5072 )[/C][C](0.7577 )[/C][C](0.387 )[/C][C](0.9293 )[/C][/ROW]
[ROW][C]Estimates ( 2 )[/C][C]0.321[/C][C]-0.134[/C][C]0.1714[/C][C]-0.2673[/C][C]0.164[/C][C]0.1978[/C][C]0[/C][/ROW]
[ROW][C](p-val)[/C][C](0.4317 )[/C][C](0.3122 )[/C][C](0.1696 )[/C][C](0.5047 )[/C][C](0.2328 )[/C][C](0.1855 )[/C][C](NA )[/C][/ROW]
[ROW][C]Estimates ( 3 )[/C][C]0.0595[/C][C]-0.1237[/C][C]0.1242[/C][C]0[/C][C]0.1578[/C][C]0.2011[/C][C]0[/C][/ROW]
[ROW][C](p-val)[/C][C](0.6475 )[/C][C](0.3283 )[/C][C](0.3037 )[/C][C](NA )[/C][C](0.2461 )[/C][C](0.181 )[/C][C](NA )[/C][/ROW]
[ROW][C]Estimates ( 4 )[/C][C]0[/C][C]-0.1219[/C][C]0.1179[/C][C]0[/C][C]0.1823[/C][C]0.2085[/C][C]0[/C][/ROW]
[ROW][C](p-val)[/C][C](NA )[/C][C](0.3376 )[/C][C](0.3275 )[/C][C](NA )[/C][C](0.1447 )[/C][C](0.1669 )[/C][C](NA )[/C][/ROW]
[ROW][C]Estimates ( 5 )[/C][C]0[/C][C]0[/C][C]0.1207[/C][C]0[/C][C]0.1992[/C][C]0.15[/C][C]0[/C][/ROW]
[ROW][C](p-val)[/C][C](NA )[/C][C](NA )[/C][C](0.3215 )[/C][C](NA )[/C][C](0.1197 )[/C][C](0.2872 )[/C][C](NA )[/C][/ROW]
[ROW][C]Estimates ( 6 )[/C][C]0[/C][C]0[/C][C]0[/C][C]0[/C][C]0.1865[/C][C]0.1611[/C][C]0[/C][/ROW]
[ROW][C](p-val)[/C][C](NA )[/C][C](NA )[/C][C](NA )[/C][C](NA )[/C][C](0.1372 )[/C][C](0.2465 )[/C][C](NA )[/C][/ROW]
[ROW][C]Estimates ( 7 )[/C][C]0[/C][C]0[/C][C]0[/C][C]0[/C][C]0.2143[/C][C]0[/C][C]0[/C][/ROW]
[ROW][C](p-val)[/C][C](NA )[/C][C](NA )[/C][C](NA )[/C][C](NA )[/C][C](0.0995 )[/C][C](NA )[/C][C](NA )[/C][/ROW]
[ROW][C]Estimates ( 8 )[/C][C]0[/C][C]0[/C][C]0[/C][C]0[/C][C]0[/C][C]0[/C][C]0[/C][/ROW]
[ROW][C](p-val)[/C][C](NA )[/C][C](NA )[/C][C](NA )[/C][C](NA )[/C][C](NA )[/C][C](NA )[/C][C](NA )[/C][/ROW]
[ROW][C]Estimates ( 9 )[/C][C]NA[/C][C]NA[/C][C]NA[/C][C]NA[/C][C]NA[/C][C]NA[/C][C]NA[/C][/ROW]
[ROW][C](p-val)[/C][C](NA )[/C][C](NA )[/C][C](NA )[/C][C](NA )[/C][C](NA )[/C][C](NA )[/C][C](NA )[/C][/ROW]
[ROW][C]Estimates ( 10 )[/C][C]NA[/C][C]NA[/C][C]NA[/C][C]NA[/C][C]NA[/C][C]NA[/C][C]NA[/C][/ROW]
[ROW][C](p-val)[/C][C](NA )[/C][C](NA )[/C][C](NA )[/C][C](NA )[/C][C](NA )[/C][C](NA )[/C][C](NA )[/C][/ROW]
[ROW][C]Estimates ( 11 )[/C][C]NA[/C][C]NA[/C][C]NA[/C][C]NA[/C][C]NA[/C][C]NA[/C][C]NA[/C][/ROW]
[ROW][C](p-val)[/C][C](NA )[/C][C](NA )[/C][C](NA )[/C][C](NA )[/C][C](NA )[/C][C](NA )[/C][C](NA )[/C][/ROW]
[ROW][C]Estimates ( 12 )[/C][C]NA[/C][C]NA[/C][C]NA[/C][C]NA[/C][C]NA[/C][C]NA[/C][C]NA[/C][/ROW]
[ROW][C](p-val)[/C][C](NA )[/C][C](NA )[/C][C](NA )[/C][C](NA )[/C][C](NA )[/C][C](NA )[/C][C](NA )[/C][/ROW]
[ROW][C]Estimates ( 13 )[/C][C]NA[/C][C]NA[/C][C]NA[/C][C]NA[/C][C]NA[/C][C]NA[/C][C]NA[/C][/ROW]
[ROW][C](p-val)[/C][C](NA )[/C][C](NA )[/C][C](NA )[/C][C](NA )[/C][C](NA )[/C][C](NA )[/C][C](NA )[/C][/ROW]
[/TABLE]
Source: https://freestatistics.org/blog/index.php?pk=113663&T=1

Globally Unique Identifier (entire table): ba.freestatistics.org/blog/index.php?pk=113663&T=1

As an alternative you can also use a QR Code:  

The GUIDs for individual cells are displayed in the table below:

ARIMA Parameter Estimation and Backward Selection
Iterationar1ar2ar3ma1sar1sar2sma1
Estimates ( 1 )0.3225-0.13530.17-0.26780.22850.185-0.0677
(p-val)(0.4334 )(0.3113 )(0.178 )(0.5072 )(0.7577 )(0.387 )(0.9293 )
Estimates ( 2 )0.321-0.1340.1714-0.26730.1640.19780
(p-val)(0.4317 )(0.3122 )(0.1696 )(0.5047 )(0.2328 )(0.1855 )(NA )
Estimates ( 3 )0.0595-0.12370.124200.15780.20110
(p-val)(0.6475 )(0.3283 )(0.3037 )(NA )(0.2461 )(0.181 )(NA )
Estimates ( 4 )0-0.12190.117900.18230.20850
(p-val)(NA )(0.3376 )(0.3275 )(NA )(0.1447 )(0.1669 )(NA )
Estimates ( 5 )000.120700.19920.150
(p-val)(NA )(NA )(0.3215 )(NA )(0.1197 )(0.2872 )(NA )
Estimates ( 6 )00000.18650.16110
(p-val)(NA )(NA )(NA )(NA )(0.1372 )(0.2465 )(NA )
Estimates ( 7 )00000.214300
(p-val)(NA )(NA )(NA )(NA )(0.0995 )(NA )(NA )
Estimates ( 8 )0000000
(p-val)(NA )(NA )(NA )(NA )(NA )(NA )(NA )
Estimates ( 9 )NANANANANANANA
(p-val)(NA )(NA )(NA )(NA )(NA )(NA )(NA )
Estimates ( 10 )NANANANANANANA
(p-val)(NA )(NA )(NA )(NA )(NA )(NA )(NA )
Estimates ( 11 )NANANANANANANA
(p-val)(NA )(NA )(NA )(NA )(NA )(NA )(NA )
Estimates ( 12 )NANANANANANANA
(p-val)(NA )(NA )(NA )(NA )(NA )(NA )(NA )
Estimates ( 13 )NANANANANANANA
(p-val)(NA )(NA )(NA )(NA )(NA )(NA )(NA )


Estimated ARIMA Residuals
Value
10.5699944606558
-266.658722583302
330.148894622195
231.494934986569
-562.620601486345
84.9791533495
46.8850501238621
139.678378494006
77.1649783288563
148.46932539223
65.4437157978908
-241.262653762374
-212.938593254809
114.498937362091
20.5727442205462
39.2152082256489
179.426329375638
632.357481500554
-17.2855274479698
74.3576994779232
496.071736075217
577.42916308143
442.643117937208
833.927609992677
778.71343715953
375.000217977369
-64.9282094304417
1099.71463603506
1047.00021797737
-2035.49746601309
883.499972752828
-233.499591292433
-811.926574600178
-313.711911317951
596.073207422454
-510.354102851343
117.145706418460
686.072934950744
-410.357318017528
3.21864136920340
-460.924449320835
182.278334194809
-307.996566856445
134.213464406701
905.42583892656
633.213573395384
515.288415648101
122.498664888619
1590.28678081784
589.217279010649
49.9983651697366
-1576.07048270535
-92.8580536911468
-2.00087190947306
812.499536798092
-1118.07108214311
242.217224516309
1033.71659783138
-591.283129696916
444.500190730196
826.64927579787
2603.43150633814
-649.428727126691
-796.434503526958
144.642300522079
-140.285908908365
-562.639793782339
319.495722194144
498.430143979585
379.218804852229
1736.21253800288
559.50177106612
-25.8525497625924

\begin{tabular}{lllllllll}
\hline
Estimated ARIMA Residuals \tabularnewline
Value \tabularnewline
10.5699944606558 \tabularnewline
-266.658722583302 \tabularnewline
330.148894622195 \tabularnewline
231.494934986569 \tabularnewline
-562.620601486345 \tabularnewline
84.9791533495 \tabularnewline
46.8850501238621 \tabularnewline
139.678378494006 \tabularnewline
77.1649783288563 \tabularnewline
148.46932539223 \tabularnewline
65.4437157978908 \tabularnewline
-241.262653762374 \tabularnewline
-212.938593254809 \tabularnewline
114.498937362091 \tabularnewline
20.5727442205462 \tabularnewline
39.2152082256489 \tabularnewline
179.426329375638 \tabularnewline
632.357481500554 \tabularnewline
-17.2855274479698 \tabularnewline
74.3576994779232 \tabularnewline
496.071736075217 \tabularnewline
577.42916308143 \tabularnewline
442.643117937208 \tabularnewline
833.927609992677 \tabularnewline
778.71343715953 \tabularnewline
375.000217977369 \tabularnewline
-64.9282094304417 \tabularnewline
1099.71463603506 \tabularnewline
1047.00021797737 \tabularnewline
-2035.49746601309 \tabularnewline
883.499972752828 \tabularnewline
-233.499591292433 \tabularnewline
-811.926574600178 \tabularnewline
-313.711911317951 \tabularnewline
596.073207422454 \tabularnewline
-510.354102851343 \tabularnewline
117.145706418460 \tabularnewline
686.072934950744 \tabularnewline
-410.357318017528 \tabularnewline
3.21864136920340 \tabularnewline
-460.924449320835 \tabularnewline
182.278334194809 \tabularnewline
-307.996566856445 \tabularnewline
134.213464406701 \tabularnewline
905.42583892656 \tabularnewline
633.213573395384 \tabularnewline
515.288415648101 \tabularnewline
122.498664888619 \tabularnewline
1590.28678081784 \tabularnewline
589.217279010649 \tabularnewline
49.9983651697366 \tabularnewline
-1576.07048270535 \tabularnewline
-92.8580536911468 \tabularnewline
-2.00087190947306 \tabularnewline
812.499536798092 \tabularnewline
-1118.07108214311 \tabularnewline
242.217224516309 \tabularnewline
1033.71659783138 \tabularnewline
-591.283129696916 \tabularnewline
444.500190730196 \tabularnewline
826.64927579787 \tabularnewline
2603.43150633814 \tabularnewline
-649.428727126691 \tabularnewline
-796.434503526958 \tabularnewline
144.642300522079 \tabularnewline
-140.285908908365 \tabularnewline
-562.639793782339 \tabularnewline
319.495722194144 \tabularnewline
498.430143979585 \tabularnewline
379.218804852229 \tabularnewline
1736.21253800288 \tabularnewline
559.50177106612 \tabularnewline
-25.8525497625924 \tabularnewline
\hline
\end{tabular}
%Source: https://freestatistics.org/blog/index.php?pk=113663&T=2

[TABLE]
[ROW][C]Estimated ARIMA Residuals[/C][/ROW]
[ROW][C]Value[/C][/ROW]
[ROW][C]10.5699944606558[/C][/ROW]
[ROW][C]-266.658722583302[/C][/ROW]
[ROW][C]330.148894622195[/C][/ROW]
[ROW][C]231.494934986569[/C][/ROW]
[ROW][C]-562.620601486345[/C][/ROW]
[ROW][C]84.9791533495[/C][/ROW]
[ROW][C]46.8850501238621[/C][/ROW]
[ROW][C]139.678378494006[/C][/ROW]
[ROW][C]77.1649783288563[/C][/ROW]
[ROW][C]148.46932539223[/C][/ROW]
[ROW][C]65.4437157978908[/C][/ROW]
[ROW][C]-241.262653762374[/C][/ROW]
[ROW][C]-212.938593254809[/C][/ROW]
[ROW][C]114.498937362091[/C][/ROW]
[ROW][C]20.5727442205462[/C][/ROW]
[ROW][C]39.2152082256489[/C][/ROW]
[ROW][C]179.426329375638[/C][/ROW]
[ROW][C]632.357481500554[/C][/ROW]
[ROW][C]-17.2855274479698[/C][/ROW]
[ROW][C]74.3576994779232[/C][/ROW]
[ROW][C]496.071736075217[/C][/ROW]
[ROW][C]577.42916308143[/C][/ROW]
[ROW][C]442.643117937208[/C][/ROW]
[ROW][C]833.927609992677[/C][/ROW]
[ROW][C]778.71343715953[/C][/ROW]
[ROW][C]375.000217977369[/C][/ROW]
[ROW][C]-64.9282094304417[/C][/ROW]
[ROW][C]1099.71463603506[/C][/ROW]
[ROW][C]1047.00021797737[/C][/ROW]
[ROW][C]-2035.49746601309[/C][/ROW]
[ROW][C]883.499972752828[/C][/ROW]
[ROW][C]-233.499591292433[/C][/ROW]
[ROW][C]-811.926574600178[/C][/ROW]
[ROW][C]-313.711911317951[/C][/ROW]
[ROW][C]596.073207422454[/C][/ROW]
[ROW][C]-510.354102851343[/C][/ROW]
[ROW][C]117.145706418460[/C][/ROW]
[ROW][C]686.072934950744[/C][/ROW]
[ROW][C]-410.357318017528[/C][/ROW]
[ROW][C]3.21864136920340[/C][/ROW]
[ROW][C]-460.924449320835[/C][/ROW]
[ROW][C]182.278334194809[/C][/ROW]
[ROW][C]-307.996566856445[/C][/ROW]
[ROW][C]134.213464406701[/C][/ROW]
[ROW][C]905.42583892656[/C][/ROW]
[ROW][C]633.213573395384[/C][/ROW]
[ROW][C]515.288415648101[/C][/ROW]
[ROW][C]122.498664888619[/C][/ROW]
[ROW][C]1590.28678081784[/C][/ROW]
[ROW][C]589.217279010649[/C][/ROW]
[ROW][C]49.9983651697366[/C][/ROW]
[ROW][C]-1576.07048270535[/C][/ROW]
[ROW][C]-92.8580536911468[/C][/ROW]
[ROW][C]-2.00087190947306[/C][/ROW]
[ROW][C]812.499536798092[/C][/ROW]
[ROW][C]-1118.07108214311[/C][/ROW]
[ROW][C]242.217224516309[/C][/ROW]
[ROW][C]1033.71659783138[/C][/ROW]
[ROW][C]-591.283129696916[/C][/ROW]
[ROW][C]444.500190730196[/C][/ROW]
[ROW][C]826.64927579787[/C][/ROW]
[ROW][C]2603.43150633814[/C][/ROW]
[ROW][C]-649.428727126691[/C][/ROW]
[ROW][C]-796.434503526958[/C][/ROW]
[ROW][C]144.642300522079[/C][/ROW]
[ROW][C]-140.285908908365[/C][/ROW]
[ROW][C]-562.639793782339[/C][/ROW]
[ROW][C]319.495722194144[/C][/ROW]
[ROW][C]498.430143979585[/C][/ROW]
[ROW][C]379.218804852229[/C][/ROW]
[ROW][C]1736.21253800288[/C][/ROW]
[ROW][C]559.50177106612[/C][/ROW]
[ROW][C]-25.8525497625924[/C][/ROW]
[/TABLE]
Source: https://freestatistics.org/blog/index.php?pk=113663&T=2

Globally Unique Identifier (entire table): ba.freestatistics.org/blog/index.php?pk=113663&T=2

As an alternative you can also use a QR Code:  

The GUIDs for individual cells are displayed in the table below:

Estimated ARIMA Residuals
Value
10.5699944606558
-266.658722583302
330.148894622195
231.494934986569
-562.620601486345
84.9791533495
46.8850501238621
139.678378494006
77.1649783288563
148.46932539223
65.4437157978908
-241.262653762374
-212.938593254809
114.498937362091
20.5727442205462
39.2152082256489
179.426329375638
632.357481500554
-17.2855274479698
74.3576994779232
496.071736075217
577.42916308143
442.643117937208
833.927609992677
778.71343715953
375.000217977369
-64.9282094304417
1099.71463603506
1047.00021797737
-2035.49746601309
883.499972752828
-233.499591292433
-811.926574600178
-313.711911317951
596.073207422454
-510.354102851343
117.145706418460
686.072934950744
-410.357318017528
3.21864136920340
-460.924449320835
182.278334194809
-307.996566856445
134.213464406701
905.42583892656
633.213573395384
515.288415648101
122.498664888619
1590.28678081784
589.217279010649
49.9983651697366
-1576.07048270535
-92.8580536911468
-2.00087190947306
812.499536798092
-1118.07108214311
242.217224516309
1033.71659783138
-591.283129696916
444.500190730196
826.64927579787
2603.43150633814
-649.428727126691
-796.434503526958
144.642300522079
-140.285908908365
-562.639793782339
319.495722194144
498.430143979585
379.218804852229
1736.21253800288
559.50177106612
-25.8525497625924


Parameters (Session):
par1 = FALSE ; par2 = 1 ; par3 = 1 ; par4 = 0 ; par5 = 12 ; par6 = 3 ; par7 = 1 ; par8 = 2 ; par9 = 1 ;
Parameters (R input):
par1 = FALSE ; par2 = 1 ; par3 = 1 ; par4 = 0 ; par5 = 12 ; par6 = 3 ; par7 = 1 ; par8 = 2 ; par9 = 1 ;
R code (references can be found in the software module):
library(lattice)
if (par1 == 'TRUE') par1 <- TRUE
if (par1 == 'FALSE') par1 <- FALSE
par2 <- as.numeric(par2) #Box-Cox lambda transformation parameter
par3 <- as.numeric(par3) #degree of non-seasonal differencing
par4 <- as.numeric(par4) #degree of seasonal differencing
par5 <- as.numeric(par5) #seasonal period
par6 <- as.numeric(par6) #degree (p) of the non-seasonal AR(p) polynomial
par7 <- as.numeric(par7) #degree (q) of the non-seasonal MA(q) polynomial
par8 <- as.numeric(par8) #degree (P) of the seasonal AR(P) polynomial
par9 <- as.numeric(par9) #degree (Q) of the seasonal MA(Q) polynomial
armaGR <- function(arima.out, names, n){
try1 <- arima.out$coef
try2 <- sqrt(diag(arima.out$var.coef))
try.data.frame <- data.frame(matrix(NA,ncol=4,nrow=length(names)))
dimnames(try.data.frame) <- list(names,c('coef','std','tstat','pv'))
try.data.frame[,1] <- try1
for(i in 1:length(try2)) try.data.frame[which(rownames(try.data.frame)==names(try2)[i]),2] <- try2[i]
try.data.frame[,3] <- try.data.frame[,1] / try.data.frame[,2]
try.data.frame[,4] <- round((1-pt(abs(try.data.frame[,3]),df=n-(length(try2)+1)))*2,5)
vector <- rep(NA,length(names))
vector[is.na(try.data.frame[,4])] <- 0
maxi <- which.max(try.data.frame[,4])
continue <- max(try.data.frame[,4],na.rm=TRUE) > .05
vector[maxi] <- 0
list(summary=try.data.frame,next.vector=vector,continue=continue)
}
arimaSelect <- function(series, order=c(13,0,0), seasonal=list(order=c(2,0,0),period=12), include.mean=F){
nrc <- order[1]+order[3]+seasonal$order[1]+seasonal$order[3]
coeff <- matrix(NA, nrow=nrc*2, ncol=nrc)
pval <- matrix(NA, nrow=nrc*2, ncol=nrc)
mylist <- rep(list(NULL), nrc)
names <- NULL
if(order[1] > 0) names <- paste('ar',1:order[1],sep='')
if(order[3] > 0) names <- c( names , paste('ma',1:order[3],sep='') )
if(seasonal$order[1] > 0) names <- c(names, paste('sar',1:seasonal$order[1],sep=''))
if(seasonal$order[3] > 0) names <- c(names, paste('sma',1:seasonal$order[3],sep=''))
arima.out <- arima(series, order=order, seasonal=seasonal, include.mean=include.mean, method='ML')
mylist[[1]] <- arima.out
last.arma <- armaGR(arima.out, names, length(series))
mystop <- FALSE
i <- 1
coeff[i,] <- last.arma[[1]][,1]
pval [i,] <- last.arma[[1]][,4]
i <- 2
aic <- arima.out$aic
while(!mystop){
mylist[[i]] <- arima.out
arima.out <- arima(series, order=order, seasonal=seasonal, include.mean=include.mean, method='ML', fixed=last.arma$next.vector)
aic <- c(aic, arima.out$aic)
last.arma <- armaGR(arima.out, names, length(series))
mystop <- !last.arma$continue
coeff[i,] <- last.arma[[1]][,1]
pval [i,] <- last.arma[[1]][,4]
i <- i+1
}
list(coeff, pval, mylist, aic=aic)
}
arimaSelectplot <- function(arimaSelect.out,noms,choix){
noms <- names(arimaSelect.out[[3]][[1]]$coef)
coeff <- arimaSelect.out[[1]]
k <- min(which(is.na(coeff[,1])))-1
coeff <- coeff[1:k,]
pval <- arimaSelect.out[[2]][1:k,]
aic <- arimaSelect.out$aic[1:k]
coeff[coeff==0] <- NA
n <- ncol(coeff)
if(missing(choix)) choix <- k
layout(matrix(c(1,1,1,2,
3,3,3,2,
3,3,3,4,
5,6,7,7),nr=4),
widths=c(10,35,45,15),
heights=c(30,30,15,15))
couleurs <- rainbow(75)[1:50]#(50)
ticks <- pretty(coeff)
par(mar=c(1,1,3,1))
plot(aic,k:1-.5,type='o',pch=21,bg='blue',cex=2,axes=F,lty=2,xpd=NA)
points(aic[choix],k-choix+.5,pch=21,cex=4,bg=2,xpd=NA)
title('aic',line=2)
par(mar=c(3,0,0,0))
plot(0,axes=F,xlab='',ylab='',xlim=range(ticks),ylim=c(.1,1))
rect(xleft = min(ticks) + (0:49)/50*(max(ticks)-min(ticks)),
xright = min(ticks) + (1:50)/50*(max(ticks)-min(ticks)),
ytop = rep(1,50),
ybottom= rep(0,50),col=couleurs,border=NA)
axis(1,ticks)
rect(xleft=min(ticks),xright=max(ticks),ytop=1,ybottom=0)
text(mean(coeff,na.rm=T),.5,'coefficients',cex=2,font=2)
par(mar=c(1,1,3,1))
image(1:n,1:k,t(coeff[k:1,]),axes=F,col=couleurs,zlim=range(ticks))
for(i in 1:n) for(j in 1:k) if(!is.na(coeff[j,i])) {
if(pval[j,i]<.01) symb = 'green'
else if( (pval[j,i]<.05) & (pval[j,i]>=.01)) symb = 'orange'
else if( (pval[j,i]<.1) & (pval[j,i]>=.05)) symb = 'red'
else symb = 'black'
polygon(c(i+.5 ,i+.2 ,i+.5 ,i+.5),
c(k-j+0.5,k-j+0.5,k-j+0.8,k-j+0.5),
col=symb)
if(j==choix) {
rect(xleft=i-.5,
xright=i+.5,
ybottom=k-j+1.5,
ytop=k-j+.5,
lwd=4)
text(i,
k-j+1,
round(coeff[j,i],2),
cex=1.2,
font=2)
}
else{
rect(xleft=i-.5,xright=i+.5,ybottom=k-j+1.5,ytop=k-j+.5)
text(i,k-j+1,round(coeff[j,i],2),cex=1.2,font=1)
}
}
axis(3,1:n,noms)
par(mar=c(0.5,0,0,0.5))
plot(0,axes=F,xlab='',ylab='',type='n',xlim=c(0,8),ylim=c(-.2,.8))
cols <- c('green','orange','red','black')
niv <- c('0','0.01','0.05','0.1')
for(i in 0:3){
polygon(c(1+2*i ,1+2*i ,1+2*i-.5 ,1+2*i),
c(.4 ,.7 , .4 , .4),
col=cols[i+1])
text(2*i,0.5,niv[i+1],cex=1.5)
}
text(8,.5,1,cex=1.5)
text(4,0,'p-value',cex=2)
box()
residus <- arimaSelect.out[[3]][[choix]]$res
par(mar=c(1,2,4,1))
acf(residus,main='')
title('acf',line=.5)
par(mar=c(1,2,4,1))
pacf(residus,main='')
title('pacf',line=.5)
par(mar=c(2,2,4,1))
qqnorm(residus,main='')
title('qq-norm',line=.5)
qqline(residus)
residus
}
if (par2 == 0) x <- log(x)
if (par2 != 0) x <- x^par2
(selection <- arimaSelect(x, order=c(par6,par3,par7), seasonal=list(order=c(par8,par4,par9), period=par5)))
bitmap(file='test1.png')
resid <- arimaSelectplot(selection)
dev.off()
resid
bitmap(file='test2.png')
acf(resid,length(resid)/2, main='Residual Autocorrelation Function')
dev.off()
bitmap(file='test3.png')
pacf(resid,length(resid)/2, main='Residual Partial Autocorrelation Function')
dev.off()
bitmap(file='test4.png')
cpgram(resid, main='Residual Cumulative Periodogram')
dev.off()
bitmap(file='test5.png')
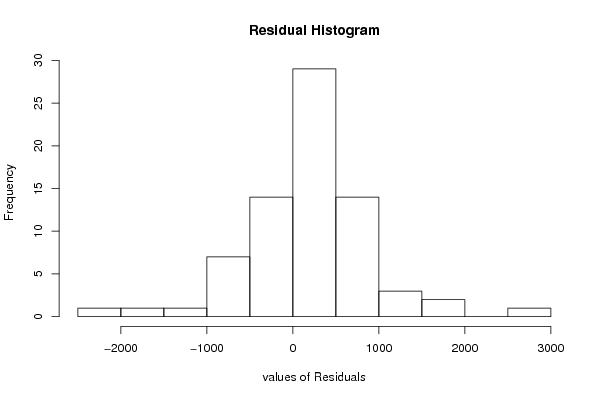
hist(resid, main='Residual Histogram', xlab='values of Residuals')
dev.off()
bitmap(file='test6.png')
densityplot(~resid,col='black',main='Residual Density Plot', xlab='values of Residuals')
dev.off()
bitmap(file='test7.png')
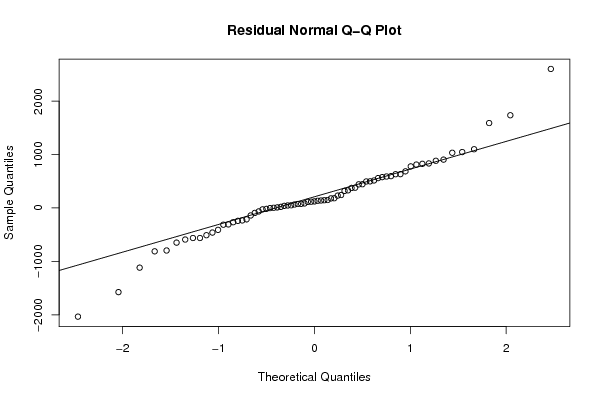
qqnorm(resid, main='Residual Normal Q-Q Plot')
qqline(resid)
dev.off()
ncols <- length(selection[[1]][1,])
nrows <- length(selection[[2]][,1])-1
load(file='createtable')
a<-table.start()
a<-table.row.start(a)
a<-table.element(a,'ARIMA Parameter Estimation and Backward Selection', ncols+1,TRUE)
a<-table.row.end(a)
a<-table.row.start(a)
a<-table.element(a,'Iteration', header=TRUE)
for (i in 1:ncols) {
a<-table.element(a,names(selection[[3]][[1]]$coef)[i],header=TRUE)
}
a<-table.row.end(a)
for (j in 1:nrows) {
a<-table.row.start(a)
mydum <- 'Estimates ('
mydum <- paste(mydum,j)
mydum <- paste(mydum,')')
a<-table.element(a,mydum, header=TRUE)
for (i in 1:ncols) {
a<-table.element(a,round(selection[[1]][j,i],4))
}
a<-table.row.end(a)
a<-table.row.start(a)
a<-table.element(a,'(p-val)', header=TRUE)
for (i in 1:ncols) {
mydum <- '('
mydum <- paste(mydum,round(selection[[2]][j,i],4),sep='')
mydum <- paste(mydum,')')
a<-table.element(a,mydum)
}
a<-table.row.end(a)
}
a<-table.end(a)
table.save(a,file='mytable.tab')
a<-table.start()
a<-table.row.start(a)
a<-table.element(a,'Estimated ARIMA Residuals', 1,TRUE)
a<-table.row.end(a)
a<-table.row.start(a)
a<-table.element(a,'Value', 1,TRUE)
a<-table.row.end(a)
for (i in (par4*par5+par3):length(resid)) {
a<-table.row.start(a)
a<-table.element(a,resid[i])
a<-table.row.end(a)
}
a<-table.end(a)
table.save(a,file='mytable1.tab')