Free Statistics

of Irreproducible Research!

Author's title

Author*The author of this computation has been verified*
R Software ModulePatrick.Wessarwasp_pairs.wasp
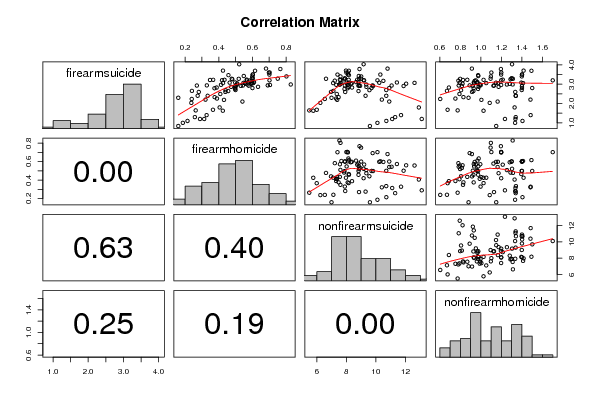
Title produced by softwareKendall tau Correlation Matrix
Date of computationTue, 21 Dec 2010 14:51:05 +0000
Cite this page as followsStatistical Computations at FreeStatistics.org, Office for Research Development and Education, URL https://freestatistics.org/blog/index.php?v=date/2010/Dec/21/t1292942972uo76dggg346erv4.htm/, Retrieved Fri, 17 May 2024 10:52:03 +0000
Statistical Computations at FreeStatistics.org, Office for Research Development and Education, URL https://freestatistics.org/blog/index.php?pk=113635, Retrieved Fri, 17 May 2024 10:52:03 +0000
QR Codes:

Original text written by user:
IsPrivate?No (this computation is public)
User-defined keywords
Estimated Impact111
Family? (F = Feedback message, R = changed R code, M = changed R Module, P = changed Parameters, D = changed Data)
-     [Kendall tau Correlation Matrix] [] [2010-12-05 18:04:16] [b98453cac15ba1066b407e146608df68]
F R PD  [Kendall tau Correlation Matrix] [] [2010-12-14 17:18:58] [8ef75e99f9f5061c72c54640f2f1c3e7]
-    D      [Kendall tau Correlation Matrix] [] [2010-12-21 14:51:05] [e26438ba7029caa0090c95690001dbf5] [Current]
Feedback Forum

Post a new message
Dataseries X:
4,031636	0,5215052	9,166456	1,303763
3,702076	0,4248284	7,970589	1,416094
3,056176	0,4250311	7,104091	1,052458
3,280707	0,4771938	6,621064	1,312283
2,984728	0,8280212	7,529215	1,309429
3,693712	0,6156186	8,170938	1,492409
3,226317	0,366627	8,15745	1,026556
2,190349	0,4308883	7,378962	1,005406
2,599515	0,2810287	7,921496	1,334886
3,080288	0,4646245	8,15674	1,393873
2,929672	0,2693951	8,856365	1,128092
2,922548	0,5779049	8,817177	1,122787
3,234943	0,5661151	8,734347	1,213104
2,983081	0,5077584	9,345927	1,253528
3,284389	0,7507175	8,99297	1,094796
3,806511	0,6808395	10,78512	0,9129438
3,784579	0,7661091	8,886867	1,19513
2,645654	0,4561473	8,818847	0,9274994
3,092081	0,4977496	8,823744	0,9653326
3,204859	0,4193273	9,165298	1,198078
3,107225	0,6095514	8,652657	0,966362
3,466909	0,457337	8,173054	0,9736851
2,984404	0,5705478	7,563416	0,9948013
3,218072	0,3478996	7,595809	0,8262616
2,82731	0,3874993	8,381467	0,6888877
3,182049	0,5824285	7,216432	0,7813066
2,236319	0,2391033	6,540178	0,6047907
2,033218	0,2367445	6,238914	1,08624
1,644804	0,2626158	5,487288	0,7740255
1,627971	0,4240934	5,759462	1,026032
1,677559	0,365275	5,993215	0,6764351
2,330828	0,3750758	7,474726	0,830525
2,493615	0,4090056	7,348907	0,7916238
2,257172	0,3891676	7,303379	0,7523907
2,655517	0,240261	7,119314	0,6702018
2,298655	0,1589496	6,99378	0,8803359
2,600402	0,4393373	6,958153	0,9142966
3,04523	0,5094681	7,595706	0,9610421
2,790583	0,3743465	8,088153	0,9301944
3,227052	0,4339828	7,555753	0,8679657
2,967479	0,4130557	7,315433	0,9891596
2,938817	0,3288928	7,893427	0,9972879
3,277961	0,5186648	8,858794	0,7987437
3,423985	0,5486504	8,839367	0,9753785
3,072646	0,5469111	8,014733	0,9347208
2,754253	0,4963494	7,873465	0,9732341
2,910431	0,5308929	8,930377	0,8152998
3,174369	0,5957761	10,50055	0,9402092
3,068387	0,5570584	12,61144	0,794493
3,089543	0,5731325	11,41787	0,9313403
2,906654	0,5005416	11,87249	0,9220503
2,931161	0,5431269	11,06082	0,7845167
3,02566	0,5593657	12,04331	0,8220981
2,939551	0,6911693	9,776299	0,8910255
2,691019	0,4403485	9,557194	0,8073056
3,19812	0,5676662	9,20259	0,9514406
3,07639	0,5969114	10,22402	1,147907
2,863873	0,4735537	9,350807	1,172609
3,013802	0,5923935	8,300913	1,281051
3,053364	0,5975556	8,365779	1,165962
2,864753	0,6334127	8,133595	0,9789106
3,057062	0,6057115	7,66047	1,410951
2,959365	0,7046107	8,074839	1,197838
3,252258	0,4805263	7,848597	1,288368
3,602988	0,702686	7,99822	1,102253
3,497704	0,7009017	7,396895	1,197657
3,296867	0,6030854	7,900419	1,299984
3,602417	0,6980919	8,1005	1,198611
3,3001	0,597656	7,899453	1,299252
3,40193	0,8023421	7,599783	1,097604
3,502591	0,6017109	8,100929	1,39977
3,402348	0,5993127	9,002175	1,398396
3,498551	0,6025625	10,2989	1,40188
3,199823	0,7016625	10,10152	1,699717
2,700064	0,4995714	10,69915	1,39761
2,801034	0,4980918	9,69814	1,500135
2,898628	0,497569	9,800951	1,400136
2,800854	0,600183	10,90047	1,400427
2,399942	0,3339542	10,69785	1,341477
2,402724	0,274437	9,297252	1,33858
2,202331	0,3209428	10,39744	1,482977
2,102594	0,5406671	10,90072	1,163253
1,798293	0,4050209	12,90127	1,328468
1,202484	0,2885961	13,09906	1,23455
1,400201	0,3275942	11,69828	1,484741
1,200832	0,3132606	11,09987	1,336579
1,298083	0,2575562	11,30157	1,339292
1,099742	0,2138386	10,70211	1,405225
1,001377	0,1861856	10,09931	1,333491
0,8361743	0,1592713	9,591119	1,14974


Summary of computational transaction
Raw Inputview raw input (R code)
Raw Outputview raw output of R engine
Computing time1 seconds
R Server'Gwilym Jenkins' @ 72.249.127.135

\begin{tabular}{lllllllll}
\hline
Summary of computational transaction \tabularnewline
Raw Input & view raw input (R code)  \tabularnewline
Raw Output & view raw output of R engine  \tabularnewline
Computing time & 1 seconds \tabularnewline
R Server & 'Gwilym Jenkins' @ 72.249.127.135 \tabularnewline
\hline
\end{tabular}
%Source: https://freestatistics.org/blog/index.php?pk=113635&T=0

[TABLE]
[ROW][C]Summary of computational transaction[/C][/ROW]
[ROW][C]Raw Input[/C][C]view raw input (R code) [/C][/ROW]
[ROW][C]Raw Output[/C][C]view raw output of R engine [/C][/ROW]
[ROW][C]Computing time[/C][C]1 seconds[/C][/ROW]
[ROW][C]R Server[/C][C]'Gwilym Jenkins' @ 72.249.127.135[/C][/ROW]
[/TABLE]
Source: https://freestatistics.org/blog/index.php?pk=113635&T=0

Globally Unique Identifier (entire table): ba.freestatistics.org/blog/index.php?pk=113635&T=0

As an alternative you can also use a QR Code:  

The GUIDs for individual cells are displayed in the table below:

Summary of computational transaction
Raw Inputview raw input (R code)
Raw Outputview raw output of R engine
Computing time1 seconds
R Server'Gwilym Jenkins' @ 72.249.127.135


Correlations for all pairs of data series (method=kendall)
firearmsuicidefirearmhomicidenonfirearmsuicidenonfirearmhomicide
firearmsuicide10.513-0.0350.083
firearmhomicide0.51310.060.094
nonfirearmsuicide-0.0350.0610.225
nonfirearmhomicide0.0830.0940.2251

\begin{tabular}{lllllllll}
\hline
Correlations for all pairs of data series (method=kendall) \tabularnewline
  & firearmsuicide & firearmhomicide & nonfirearmsuicide & nonfirearmhomicide \tabularnewline
firearmsuicide & 1 & 0.513 & -0.035 & 0.083 \tabularnewline
firearmhomicide & 0.513 & 1 & 0.06 & 0.094 \tabularnewline
nonfirearmsuicide & -0.035 & 0.06 & 1 & 0.225 \tabularnewline
nonfirearmhomicide & 0.083 & 0.094 & 0.225 & 1 \tabularnewline
\hline
\end{tabular}
%Source: https://freestatistics.org/blog/index.php?pk=113635&T=1

[TABLE]
[ROW][C]Correlations for all pairs of data series (method=kendall)[/C][/ROW]
[ROW][C] [/C][C]firearmsuicide[/C][C]firearmhomicide[/C][C]nonfirearmsuicide[/C][C]nonfirearmhomicide[/C][/ROW]
[ROW][C]firearmsuicide[/C][C]1[/C][C]0.513[/C][C]-0.035[/C][C]0.083[/C][/ROW]
[ROW][C]firearmhomicide[/C][C]0.513[/C][C]1[/C][C]0.06[/C][C]0.094[/C][/ROW]
[ROW][C]nonfirearmsuicide[/C][C]-0.035[/C][C]0.06[/C][C]1[/C][C]0.225[/C][/ROW]
[ROW][C]nonfirearmhomicide[/C][C]0.083[/C][C]0.094[/C][C]0.225[/C][C]1[/C][/ROW]
[/TABLE]
Source: https://freestatistics.org/blog/index.php?pk=113635&T=1

Globally Unique Identifier (entire table): ba.freestatistics.org/blog/index.php?pk=113635&T=1

As an alternative you can also use a QR Code:  

The GUIDs for individual cells are displayed in the table below:

Correlations for all pairs of data series (method=kendall)
firearmsuicidefirearmhomicidenonfirearmsuicidenonfirearmhomicide
firearmsuicide10.513-0.0350.083
firearmhomicide0.51310.060.094
nonfirearmsuicide-0.0350.0610.225
nonfirearmhomicide0.0830.0940.2251


Correlations for all pairs of data series with p-values
pairPearson rSpearman rhoKendall tau
firearmsuicide;firearmhomicide0.70350.69210.5126
p-value(0)(0)(0)
firearmsuicide;nonfirearmsuicide-0.1806-0.0744-0.0347
p-value(0.0884)(0.4852)(0.6281)
firearmsuicide;nonfirearmhomicide-0.00480.09150.0826
p-value(0.9643)(0.3905)(0.2487)
firearmhomicide;nonfirearmsuicide0.03630.09750.0602
p-value(0.7343)(0.36)(0.4009)
firearmhomicide;nonfirearmhomicide0.12720.12390.0936
p-value(0.2322)(0.2441)(0.1912)
nonfirearmsuicide;nonfirearmhomicide0.29980.32440.2255
p-value(0.0041)(0.0019)(0.0016)

\begin{tabular}{lllllllll}
\hline
Correlations for all pairs of data series with p-values \tabularnewline
pair & Pearson r & Spearman rho & Kendall tau \tabularnewline
firearmsuicide;firearmhomicide & 0.7035 & 0.6921 & 0.5126 \tabularnewline
p-value & (0) & (0) & (0) \tabularnewline
firearmsuicide;nonfirearmsuicide & -0.1806 & -0.0744 & -0.0347 \tabularnewline
p-value & (0.0884) & (0.4852) & (0.6281) \tabularnewline
firearmsuicide;nonfirearmhomicide & -0.0048 & 0.0915 & 0.0826 \tabularnewline
p-value & (0.9643) & (0.3905) & (0.2487) \tabularnewline
firearmhomicide;nonfirearmsuicide & 0.0363 & 0.0975 & 0.0602 \tabularnewline
p-value & (0.7343) & (0.36) & (0.4009) \tabularnewline
firearmhomicide;nonfirearmhomicide & 0.1272 & 0.1239 & 0.0936 \tabularnewline
p-value & (0.2322) & (0.2441) & (0.1912) \tabularnewline
nonfirearmsuicide;nonfirearmhomicide & 0.2998 & 0.3244 & 0.2255 \tabularnewline
p-value & (0.0041) & (0.0019) & (0.0016) \tabularnewline
\hline
\end{tabular}
%Source: https://freestatistics.org/blog/index.php?pk=113635&T=2

[TABLE]
[ROW][C]Correlations for all pairs of data series with p-values[/C][/ROW]
[ROW][C]pair[/C][C]Pearson r[/C][C]Spearman rho[/C][C]Kendall tau[/C][/ROW]
[ROW][C]firearmsuicide;firearmhomicide[/C][C]0.7035[/C][C]0.6921[/C][C]0.5126[/C][/ROW]
[ROW][C]p-value[/C][C](0)[/C][C](0)[/C][C](0)[/C][/ROW]
[ROW][C]firearmsuicide;nonfirearmsuicide[/C][C]-0.1806[/C][C]-0.0744[/C][C]-0.0347[/C][/ROW]
[ROW][C]p-value[/C][C](0.0884)[/C][C](0.4852)[/C][C](0.6281)[/C][/ROW]
[ROW][C]firearmsuicide;nonfirearmhomicide[/C][C]-0.0048[/C][C]0.0915[/C][C]0.0826[/C][/ROW]
[ROW][C]p-value[/C][C](0.9643)[/C][C](0.3905)[/C][C](0.2487)[/C][/ROW]
[ROW][C]firearmhomicide;nonfirearmsuicide[/C][C]0.0363[/C][C]0.0975[/C][C]0.0602[/C][/ROW]
[ROW][C]p-value[/C][C](0.7343)[/C][C](0.36)[/C][C](0.4009)[/C][/ROW]
[ROW][C]firearmhomicide;nonfirearmhomicide[/C][C]0.1272[/C][C]0.1239[/C][C]0.0936[/C][/ROW]
[ROW][C]p-value[/C][C](0.2322)[/C][C](0.2441)[/C][C](0.1912)[/C][/ROW]
[ROW][C]nonfirearmsuicide;nonfirearmhomicide[/C][C]0.2998[/C][C]0.3244[/C][C]0.2255[/C][/ROW]
[ROW][C]p-value[/C][C](0.0041)[/C][C](0.0019)[/C][C](0.0016)[/C][/ROW]
[/TABLE]
Source: https://freestatistics.org/blog/index.php?pk=113635&T=2

Globally Unique Identifier (entire table): ba.freestatistics.org/blog/index.php?pk=113635&T=2

As an alternative you can also use a QR Code:  

The GUIDs for individual cells are displayed in the table below:

Correlations for all pairs of data series with p-values
pairPearson rSpearman rhoKendall tau
firearmsuicide;firearmhomicide0.70350.69210.5126
p-value(0)(0)(0)
firearmsuicide;nonfirearmsuicide-0.1806-0.0744-0.0347
p-value(0.0884)(0.4852)(0.6281)
firearmsuicide;nonfirearmhomicide-0.00480.09150.0826
p-value(0.9643)(0.3905)(0.2487)
firearmhomicide;nonfirearmsuicide0.03630.09750.0602
p-value(0.7343)(0.36)(0.4009)
firearmhomicide;nonfirearmhomicide0.12720.12390.0936
p-value(0.2322)(0.2441)(0.1912)
nonfirearmsuicide;nonfirearmhomicide0.29980.32440.2255
p-value(0.0041)(0.0019)(0.0016)


Parameters (Session):
par1 = kendall ;
Parameters (R input):
par1 = kendall ;
R code (references can be found in the software module):
panel.tau <- function(x, y, digits=2, prefix='', cex.cor)
{
usr <- par('usr'); on.exit(par(usr))
par(usr = c(0, 1, 0, 1))
rr <- cor.test(x, y, method=par1)
r <- round(rr$p.value,2)
txt <- format(c(r, 0.123456789), digits=digits)[1]
txt <- paste(prefix, txt, sep='')
if(missing(cex.cor)) cex <- 0.5/strwidth(txt)
text(0.5, 0.5, txt, cex = cex)
}
panel.hist <- function(x, ...)
{
usr <- par('usr'); on.exit(par(usr))
par(usr = c(usr[1:2], 0, 1.5) )
h <- hist(x, plot = FALSE)
breaks <- h$breaks; nB <- length(breaks)
y <- h$counts; y <- y/max(y)
rect(breaks[-nB], 0, breaks[-1], y, col='grey', ...)
}
bitmap(file='test1.png')
pairs(t(y),diag.panel=panel.hist, upper.panel=panel.smooth, lower.panel=panel.tau, main=main)
dev.off()
load(file='createtable')
n <- length(y[,1])
n
a<-table.start()
a<-table.row.start(a)
a<-table.element(a,paste('Correlations for all pairs of data series (method=',par1,')',sep=''),n+1,TRUE)
a<-table.row.end(a)
a<-table.row.start(a)
a<-table.element(a,' ',header=TRUE)
for (i in 1:n) {
a<-table.element(a,dimnames(t(x))[[2]][i],header=TRUE)
}
a<-table.row.end(a)
for (i in 1:n) {
a<-table.row.start(a)
a<-table.element(a,dimnames(t(x))[[2]][i],header=TRUE)
for (j in 1:n) {
r <- cor.test(y[i,],y[j,],method=par1)
a<-table.element(a,round(r$estimate,3))
}
a<-table.row.end(a)
}
a<-table.end(a)
table.save(a,file='mytable.tab')
a<-table.start()
a<-table.row.start(a)
a<-table.element(a,'Correlations for all pairs of data series with p-values',4,TRUE)
a<-table.row.end(a)
a<-table.row.start(a)
a<-table.element(a,'pair',1,TRUE)
a<-table.element(a,'Pearson r',1,TRUE)
a<-table.element(a,'Spearman rho',1,TRUE)
a<-table.element(a,'Kendall tau',1,TRUE)
a<-table.row.end(a)
cor.test(y[1,],y[2,],method=par1)
for (i in 1:(n-1))
{
for (j in (i+1):n)
{
a<-table.row.start(a)
dum <- paste(dimnames(t(x))[[2]][i],';',dimnames(t(x))[[2]][j],sep='')
a<-table.element(a,dum,header=TRUE)
rp <- cor.test(y[i,],y[j,],method='pearson')
a<-table.element(a,round(rp$estimate,4))
rs <- cor.test(y[i,],y[j,],method='spearman')
a<-table.element(a,round(rs$estimate,4))
rk <- cor.test(y[i,],y[j,],method='kendall')
a<-table.element(a,round(rk$estimate,4))
a<-table.row.end(a)
a<-table.row.start(a)
a<-table.element(a,'p-value',header=T)
a<-table.element(a,paste('(',round(rp$p.value,4),')',sep=''))
a<-table.element(a,paste('(',round(rs$p.value,4),')',sep=''))
a<-table.element(a,paste('(',round(rk$p.value,4),')',sep=''))
a<-table.row.end(a)
}
}
a<-table.end(a)
table.save(a,file='mytable1.tab')