Free Statistics

of Irreproducible Research!

Author's title

Author*The author of this computation has been verified*
R Software Modulerwasp_arimaforecasting.wasp
Title produced by softwareARIMA Forecasting
Date of computationTue, 21 Dec 2010 13:16:55 +0000
Cite this page as followsStatistical Computations at FreeStatistics.org, Office for Research Development and Education, URL https://freestatistics.org/blog/index.php?v=date/2010/Dec/21/t1292937741n5jyfbtnr0xupk8.htm/, Retrieved Sat, 18 May 2024 14:38:47 +0000
Statistical Computations at FreeStatistics.org, Office for Research Development and Education, URL https://freestatistics.org/blog/index.php?pk=113506, Retrieved Sat, 18 May 2024 14:38:47 +0000
QR Codes:

Original text written by user:
IsPrivate?No (this computation is public)
User-defined keywords
Estimated Impact175
Family? (F = Feedback message, R = changed R code, M = changed R Module, P = changed Parameters, D = changed Data)
-     [Variance Reduction Matrix] [Paper: Variance R...] [2010-12-19 15:22:31] [48146708a479232c43a8f6e52fbf83b4]
- RMPD  [ARIMA Backward Selection] [Paper: ARIMA Back...] [2010-12-19 20:13:51] [48146708a479232c43a8f6e52fbf83b4]
- RMP       [ARIMA Forecasting] [Paper: ARIMA Fore...] [2010-12-21 13:16:55] [6f3869f9d1e39c73f93153f1f7803f84] [Current]
Feedback Forum

Post a new message
Dataseries X:
608
651
691
627
634
731
475
337
803
722
590
724
627
696
825
677
656
785
412
352
839
729
696
641
695
638
762
635
721
854
418
367
824
687
601
676
740
691
683
594
729
731
386
331
706
715
657
653
642
643
718
654
632
731
392
344
792
852
649
629
685
617
715
715
629
916
531
357
917
828
708
858
775
785
1006
789
734
906
532
387
991
841
892
782


Summary of computational transaction
Raw Inputview raw input (R code)
Raw Outputview raw output of R engine
Computing time3 seconds
R Server'Sir Ronald Aylmer Fisher' @ 193.190.124.24

\begin{tabular}{lllllllll}
\hline
Summary of computational transaction \tabularnewline
Raw Input & view raw input (R code)  \tabularnewline
Raw Output & view raw output of R engine  \tabularnewline
Computing time & 3 seconds \tabularnewline
R Server & 'Sir Ronald Aylmer Fisher' @ 193.190.124.24 \tabularnewline
\hline
\end{tabular}
%Source: https://freestatistics.org/blog/index.php?pk=113506&T=0

[TABLE]
[ROW][C]Summary of computational transaction[/C][/ROW]
[ROW][C]Raw Input[/C][C]view raw input (R code) [/C][/ROW]
[ROW][C]Raw Output[/C][C]view raw output of R engine [/C][/ROW]
[ROW][C]Computing time[/C][C]3 seconds[/C][/ROW]
[ROW][C]R Server[/C][C]'Sir Ronald Aylmer Fisher' @ 193.190.124.24[/C][/ROW]
[/TABLE]
Source: https://freestatistics.org/blog/index.php?pk=113506&T=0

Globally Unique Identifier (entire table): ba.freestatistics.org/blog/index.php?pk=113506&T=0

As an alternative you can also use a QR Code:  

The GUIDs for individual cells are displayed in the table below:

Summary of computational transaction
Raw Inputview raw input (R code)
Raw Outputview raw output of R engine
Computing time3 seconds
R Server'Sir Ronald Aylmer Fisher' @ 193.190.124.24


Univariate ARIMA Extrapolation Forecast
timeY[t]F[t]95% LB95% UBp-value(H0: Y[t] = F[t])P(F[t]>Y[t-1])P(F[t]>Y[t-s])P(F[t]>Y[72])
60629-------
61685-------
62617-------
63715-------
64715-------
65629-------
66916-------
67531-------
68357-------
69917-------
70828-------
71708-------
72858-------
73775787.3718658.8183950.53680.44090.19810.89060.1981
74785717.8322601.8002864.71080.1850.22280.91080.0307
751006774.2753644.9082939.51040.0030.44940.7590.1603
76789720.8664601.3372873.21560.19041e-040.53010.0388
77734731.6812608.6388889.12040.48850.23770.89940.0579
78906899.3671738.20041109.4360.47530.93860.43830.6502
79532489.2744414.1144583.17710.186300.19190
80387367.3664314.7535432.00940.275800.62340
81991878.3164718.51891087.56830.145610.35850.5755
82841836.8893685.69341034.4510.48370.06310.53510.4171
83892730.1629602.2568895.75220.02770.09480.60350.0651
84782801.8078657.1753990.70330.41860.17470.27990.2799

\begin{tabular}{lllllllll}
\hline
Univariate ARIMA Extrapolation Forecast \tabularnewline
time & Y[t] & F[t] & 95% LB & 95% UB & p-value(H0: Y[t] = F[t]) & P(F[t]>Y[t-1]) & P(F[t]>Y[t-s]) & P(F[t]>Y[72]) \tabularnewline
60 & 629 & - & - & - & - & - & - & - \tabularnewline
61 & 685 & - & - & - & - & - & - & - \tabularnewline
62 & 617 & - & - & - & - & - & - & - \tabularnewline
63 & 715 & - & - & - & - & - & - & - \tabularnewline
64 & 715 & - & - & - & - & - & - & - \tabularnewline
65 & 629 & - & - & - & - & - & - & - \tabularnewline
66 & 916 & - & - & - & - & - & - & - \tabularnewline
67 & 531 & - & - & - & - & - & - & - \tabularnewline
68 & 357 & - & - & - & - & - & - & - \tabularnewline
69 & 917 & - & - & - & - & - & - & - \tabularnewline
70 & 828 & - & - & - & - & - & - & - \tabularnewline
71 & 708 & - & - & - & - & - & - & - \tabularnewline
72 & 858 & - & - & - & - & - & - & - \tabularnewline
73 & 775 & 787.3718 & 658.8183 & 950.5368 & 0.4409 & 0.1981 & 0.8906 & 0.1981 \tabularnewline
74 & 785 & 717.8322 & 601.8002 & 864.7108 & 0.185 & 0.2228 & 0.9108 & 0.0307 \tabularnewline
75 & 1006 & 774.2753 & 644.9082 & 939.5104 & 0.003 & 0.4494 & 0.759 & 0.1603 \tabularnewline
76 & 789 & 720.8664 & 601.3372 & 873.2156 & 0.1904 & 1e-04 & 0.5301 & 0.0388 \tabularnewline
77 & 734 & 731.6812 & 608.6388 & 889.1204 & 0.4885 & 0.2377 & 0.8994 & 0.0579 \tabularnewline
78 & 906 & 899.3671 & 738.2004 & 1109.436 & 0.4753 & 0.9386 & 0.4383 & 0.6502 \tabularnewline
79 & 532 & 489.2744 & 414.1144 & 583.1771 & 0.1863 & 0 & 0.1919 & 0 \tabularnewline
80 & 387 & 367.3664 & 314.7535 & 432.0094 & 0.2758 & 0 & 0.6234 & 0 \tabularnewline
81 & 991 & 878.3164 & 718.5189 & 1087.5683 & 0.1456 & 1 & 0.3585 & 0.5755 \tabularnewline
82 & 841 & 836.8893 & 685.6934 & 1034.451 & 0.4837 & 0.0631 & 0.5351 & 0.4171 \tabularnewline
83 & 892 & 730.1629 & 602.2568 & 895.7522 & 0.0277 & 0.0948 & 0.6035 & 0.0651 \tabularnewline
84 & 782 & 801.8078 & 657.1753 & 990.7033 & 0.4186 & 0.1747 & 0.2799 & 0.2799 \tabularnewline
\hline
\end{tabular}
%Source: https://freestatistics.org/blog/index.php?pk=113506&T=1

[TABLE]
[ROW][C]Univariate ARIMA Extrapolation Forecast[/C][/ROW]
[ROW][C]time[/C][C]Y[t][/C][C]F[t][/C][C]95% LB[/C][C]95% UB[/C][C]p-value(H0: Y[t] = F[t])[/C][C]P(F[t]>Y[t-1])[/C][C]P(F[t]>Y[t-s])[/C][C]P(F[t]>Y[72])[/C][/ROW]
[ROW][C]60[/C][C]629[/C][C]-[/C][C]-[/C][C]-[/C][C]-[/C][C]-[/C][C]-[/C][C]-[/C][/ROW]
[ROW][C]61[/C][C]685[/C][C]-[/C][C]-[/C][C]-[/C][C]-[/C][C]-[/C][C]-[/C][C]-[/C][/ROW]
[ROW][C]62[/C][C]617[/C][C]-[/C][C]-[/C][C]-[/C][C]-[/C][C]-[/C][C]-[/C][C]-[/C][/ROW]
[ROW][C]63[/C][C]715[/C][C]-[/C][C]-[/C][C]-[/C][C]-[/C][C]-[/C][C]-[/C][C]-[/C][/ROW]
[ROW][C]64[/C][C]715[/C][C]-[/C][C]-[/C][C]-[/C][C]-[/C][C]-[/C][C]-[/C][C]-[/C][/ROW]
[ROW][C]65[/C][C]629[/C][C]-[/C][C]-[/C][C]-[/C][C]-[/C][C]-[/C][C]-[/C][C]-[/C][/ROW]
[ROW][C]66[/C][C]916[/C][C]-[/C][C]-[/C][C]-[/C][C]-[/C][C]-[/C][C]-[/C][C]-[/C][/ROW]
[ROW][C]67[/C][C]531[/C][C]-[/C][C]-[/C][C]-[/C][C]-[/C][C]-[/C][C]-[/C][C]-[/C][/ROW]
[ROW][C]68[/C][C]357[/C][C]-[/C][C]-[/C][C]-[/C][C]-[/C][C]-[/C][C]-[/C][C]-[/C][/ROW]
[ROW][C]69[/C][C]917[/C][C]-[/C][C]-[/C][C]-[/C][C]-[/C][C]-[/C][C]-[/C][C]-[/C][/ROW]
[ROW][C]70[/C][C]828[/C][C]-[/C][C]-[/C][C]-[/C][C]-[/C][C]-[/C][C]-[/C][C]-[/C][/ROW]
[ROW][C]71[/C][C]708[/C][C]-[/C][C]-[/C][C]-[/C][C]-[/C][C]-[/C][C]-[/C][C]-[/C][/ROW]
[ROW][C]72[/C][C]858[/C][C]-[/C][C]-[/C][C]-[/C][C]-[/C][C]-[/C][C]-[/C][C]-[/C][/ROW]
[ROW][C]73[/C][C]775[/C][C]787.3718[/C][C]658.8183[/C][C]950.5368[/C][C]0.4409[/C][C]0.1981[/C][C]0.8906[/C][C]0.1981[/C][/ROW]
[ROW][C]74[/C][C]785[/C][C]717.8322[/C][C]601.8002[/C][C]864.7108[/C][C]0.185[/C][C]0.2228[/C][C]0.9108[/C][C]0.0307[/C][/ROW]
[ROW][C]75[/C][C]1006[/C][C]774.2753[/C][C]644.9082[/C][C]939.5104[/C][C]0.003[/C][C]0.4494[/C][C]0.759[/C][C]0.1603[/C][/ROW]
[ROW][C]76[/C][C]789[/C][C]720.8664[/C][C]601.3372[/C][C]873.2156[/C][C]0.1904[/C][C]1e-04[/C][C]0.5301[/C][C]0.0388[/C][/ROW]
[ROW][C]77[/C][C]734[/C][C]731.6812[/C][C]608.6388[/C][C]889.1204[/C][C]0.4885[/C][C]0.2377[/C][C]0.8994[/C][C]0.0579[/C][/ROW]
[ROW][C]78[/C][C]906[/C][C]899.3671[/C][C]738.2004[/C][C]1109.436[/C][C]0.4753[/C][C]0.9386[/C][C]0.4383[/C][C]0.6502[/C][/ROW]
[ROW][C]79[/C][C]532[/C][C]489.2744[/C][C]414.1144[/C][C]583.1771[/C][C]0.1863[/C][C]0[/C][C]0.1919[/C][C]0[/C][/ROW]
[ROW][C]80[/C][C]387[/C][C]367.3664[/C][C]314.7535[/C][C]432.0094[/C][C]0.2758[/C][C]0[/C][C]0.6234[/C][C]0[/C][/ROW]
[ROW][C]81[/C][C]991[/C][C]878.3164[/C][C]718.5189[/C][C]1087.5683[/C][C]0.1456[/C][C]1[/C][C]0.3585[/C][C]0.5755[/C][/ROW]
[ROW][C]82[/C][C]841[/C][C]836.8893[/C][C]685.6934[/C][C]1034.451[/C][C]0.4837[/C][C]0.0631[/C][C]0.5351[/C][C]0.4171[/C][/ROW]
[ROW][C]83[/C][C]892[/C][C]730.1629[/C][C]602.2568[/C][C]895.7522[/C][C]0.0277[/C][C]0.0948[/C][C]0.6035[/C][C]0.0651[/C][/ROW]
[ROW][C]84[/C][C]782[/C][C]801.8078[/C][C]657.1753[/C][C]990.7033[/C][C]0.4186[/C][C]0.1747[/C][C]0.2799[/C][C]0.2799[/C][/ROW]
[/TABLE]
Source: https://freestatistics.org/blog/index.php?pk=113506&T=1

Globally Unique Identifier (entire table): ba.freestatistics.org/blog/index.php?pk=113506&T=1

As an alternative you can also use a QR Code:  

The GUIDs for individual cells are displayed in the table below:

Univariate ARIMA Extrapolation Forecast
timeY[t]F[t]95% LB95% UBp-value(H0: Y[t] = F[t])P(F[t]>Y[t-1])P(F[t]>Y[t-s])P(F[t]>Y[72])
60629-------
61685-------
62617-------
63715-------
64715-------
65629-------
66916-------
67531-------
68357-------
69917-------
70828-------
71708-------
72858-------
73775787.3718658.8183950.53680.44090.19810.89060.1981
74785717.8322601.8002864.71080.1850.22280.91080.0307
751006774.2753644.9082939.51040.0030.44940.7590.1603
76789720.8664601.3372873.21560.19041e-040.53010.0388
77734731.6812608.6388889.12040.48850.23770.89940.0579
78906899.3671738.20041109.4360.47530.93860.43830.6502
79532489.2744414.1144583.17710.186300.19190
80387367.3664314.7535432.00940.275800.62340
81991878.3164718.51891087.56830.145610.35850.5755
82841836.8893685.69341034.4510.48370.06310.53510.4171
83892730.1629602.2568895.75220.02770.09480.60350.0651
84782801.8078657.1753990.70330.41860.17470.27990.2799


Univariate ARIMA Extrapolation Forecast Performance
time% S.E.PEMAPESq.EMSERMSE
730.1057-0.01570153.062600
740.10440.09360.05464511.51422332.288448.2938
750.10890.29930.136253696.317719453.6315139.4763
760.10780.09450.12584642.189315750.7709125.5021
770.10980.00320.10125.376712601.6921112.2573
780.11920.00740.085643.995410508.7426102.5122
790.09790.08730.08581825.47929268.276496.2719
800.08980.05340.0818385.47748157.926690.3212
810.12160.12830.08712697.60288662.33593.0717
820.12040.00490.078816.89767797.791388.3051
830.11570.22160.091726191.25089469.92497.3135
840.1202-0.02470.0862392.34768713.459393.3459

\begin{tabular}{lllllllll}
\hline
Univariate ARIMA Extrapolation Forecast Performance \tabularnewline
time & % S.E. & PE & MAPE & Sq.E & MSE & RMSE \tabularnewline
73 & 0.1057 & -0.0157 & 0 & 153.0626 & 0 & 0 \tabularnewline
74 & 0.1044 & 0.0936 & 0.0546 & 4511.5142 & 2332.2884 & 48.2938 \tabularnewline
75 & 0.1089 & 0.2993 & 0.1362 & 53696.3177 & 19453.6315 & 139.4763 \tabularnewline
76 & 0.1078 & 0.0945 & 0.1258 & 4642.1893 & 15750.7709 & 125.5021 \tabularnewline
77 & 0.1098 & 0.0032 & 0.1012 & 5.3767 & 12601.6921 & 112.2573 \tabularnewline
78 & 0.1192 & 0.0074 & 0.0856 & 43.9954 & 10508.7426 & 102.5122 \tabularnewline
79 & 0.0979 & 0.0873 & 0.0858 & 1825.4792 & 9268.2764 & 96.2719 \tabularnewline
80 & 0.0898 & 0.0534 & 0.0818 & 385.4774 & 8157.9266 & 90.3212 \tabularnewline
81 & 0.1216 & 0.1283 & 0.087 & 12697.6028 & 8662.335 & 93.0717 \tabularnewline
82 & 0.1204 & 0.0049 & 0.0788 & 16.8976 & 7797.7913 & 88.3051 \tabularnewline
83 & 0.1157 & 0.2216 & 0.0917 & 26191.2508 & 9469.924 & 97.3135 \tabularnewline
84 & 0.1202 & -0.0247 & 0.0862 & 392.3476 & 8713.4593 & 93.3459 \tabularnewline
\hline
\end{tabular}
%Source: https://freestatistics.org/blog/index.php?pk=113506&T=2

[TABLE]
[ROW][C]Univariate ARIMA Extrapolation Forecast Performance[/C][/ROW]
[ROW][C]time[/C][C]% S.E.[/C][C]PE[/C][C]MAPE[/C][C]Sq.E[/C][C]MSE[/C][C]RMSE[/C][/ROW]
[ROW][C]73[/C][C]0.1057[/C][C]-0.0157[/C][C]0[/C][C]153.0626[/C][C]0[/C][C]0[/C][/ROW]
[ROW][C]74[/C][C]0.1044[/C][C]0.0936[/C][C]0.0546[/C][C]4511.5142[/C][C]2332.2884[/C][C]48.2938[/C][/ROW]
[ROW][C]75[/C][C]0.1089[/C][C]0.2993[/C][C]0.1362[/C][C]53696.3177[/C][C]19453.6315[/C][C]139.4763[/C][/ROW]
[ROW][C]76[/C][C]0.1078[/C][C]0.0945[/C][C]0.1258[/C][C]4642.1893[/C][C]15750.7709[/C][C]125.5021[/C][/ROW]
[ROW][C]77[/C][C]0.1098[/C][C]0.0032[/C][C]0.1012[/C][C]5.3767[/C][C]12601.6921[/C][C]112.2573[/C][/ROW]
[ROW][C]78[/C][C]0.1192[/C][C]0.0074[/C][C]0.0856[/C][C]43.9954[/C][C]10508.7426[/C][C]102.5122[/C][/ROW]
[ROW][C]79[/C][C]0.0979[/C][C]0.0873[/C][C]0.0858[/C][C]1825.4792[/C][C]9268.2764[/C][C]96.2719[/C][/ROW]
[ROW][C]80[/C][C]0.0898[/C][C]0.0534[/C][C]0.0818[/C][C]385.4774[/C][C]8157.9266[/C][C]90.3212[/C][/ROW]
[ROW][C]81[/C][C]0.1216[/C][C]0.1283[/C][C]0.087[/C][C]12697.6028[/C][C]8662.335[/C][C]93.0717[/C][/ROW]
[ROW][C]82[/C][C]0.1204[/C][C]0.0049[/C][C]0.0788[/C][C]16.8976[/C][C]7797.7913[/C][C]88.3051[/C][/ROW]
[ROW][C]83[/C][C]0.1157[/C][C]0.2216[/C][C]0.0917[/C][C]26191.2508[/C][C]9469.924[/C][C]97.3135[/C][/ROW]
[ROW][C]84[/C][C]0.1202[/C][C]-0.0247[/C][C]0.0862[/C][C]392.3476[/C][C]8713.4593[/C][C]93.3459[/C][/ROW]
[/TABLE]
Source: https://freestatistics.org/blog/index.php?pk=113506&T=2

Globally Unique Identifier (entire table): ba.freestatistics.org/blog/index.php?pk=113506&T=2

As an alternative you can also use a QR Code:  

The GUIDs for individual cells are displayed in the table below:

Univariate ARIMA Extrapolation Forecast Performance
time% S.E.PEMAPESq.EMSERMSE
730.1057-0.01570153.062600
740.10440.09360.05464511.51422332.288448.2938
750.10890.29930.136253696.317719453.6315139.4763
760.10780.09450.12584642.189315750.7709125.5021
770.10980.00320.10125.376712601.6921112.2573
780.11920.00740.085643.995410508.7426102.5122
790.09790.08730.08581825.47929268.276496.2719
800.08980.05340.0818385.47748157.926690.3212
810.12160.12830.08712697.60288662.33593.0717
820.12040.00490.078816.89767797.791388.3051
830.11570.22160.091726191.25089469.92497.3135
840.1202-0.02470.0862392.34768713.459393.3459


Parameters (Session):
par1 = 12 ; par2 = -0.3 ; par3 = 0 ; par4 = 1 ; par5 = 12 ; par6 = 1 ; par7 = 1 ; par8 = 2 ; par9 = 0 ; par10 = FALSE ;
Parameters (R input):
par1 = 12 ; par2 = -0.3 ; par3 = 0 ; par4 = 1 ; par5 = 12 ; par6 = 1 ; par7 = 1 ; par8 = 2 ; par9 = 0 ; par10 = FALSE ;
R code (references can be found in the software module):
par1 <- as.numeric(par1) #cut off periods
par2 <- as.numeric(par2) #lambda
par3 <- as.numeric(par3) #degree of non-seasonal differencing
par4 <- as.numeric(par4) #degree of seasonal differencing
par5 <- as.numeric(par5) #seasonal period
par6 <- as.numeric(par6) #p
par7 <- as.numeric(par7) #q
par8 <- as.numeric(par8) #P
par9 <- as.numeric(par9) #Q
if (par10 == 'TRUE') par10 <- TRUE
if (par10 == 'FALSE') par10 <- FALSE
if (par2 == 0) x <- log(x)
if (par2 != 0) x <- x^par2
lx <- length(x)
first <- lx - 2*par1
nx <- lx - par1
nx1 <- nx + 1
fx <- lx - nx
if (fx < 1) {
fx <- par5
nx1 <- lx + fx - 1
first <- lx - 2*fx
}
first <- 1
if (fx < 3) fx <- round(lx/10,0)
(arima.out <- arima(x[1:nx], order=c(par6,par3,par7), seasonal=list(order=c(par8,par4,par9), period=par5), include.mean=par10, method='ML'))
(forecast <- predict(arima.out,par1))
(lb <- forecast$pred - 1.96 * forecast$se)
(ub <- forecast$pred + 1.96 * forecast$se)
if (par2 == 0) {
x <- exp(x)
forecast$pred <- exp(forecast$pred)
lb <- exp(lb)
ub <- exp(ub)
}
if (par2 != 0) {
x <- x^(1/par2)
forecast$pred <- forecast$pred^(1/par2)
lb <- lb^(1/par2)
ub <- ub^(1/par2)
}
if (par2 < 0) {
olb <- lb
lb <- ub
ub <- olb
}
(actandfor <- c(x[1:nx], forecast$pred))
(perc.se <- (ub-forecast$pred)/1.96/forecast$pred)
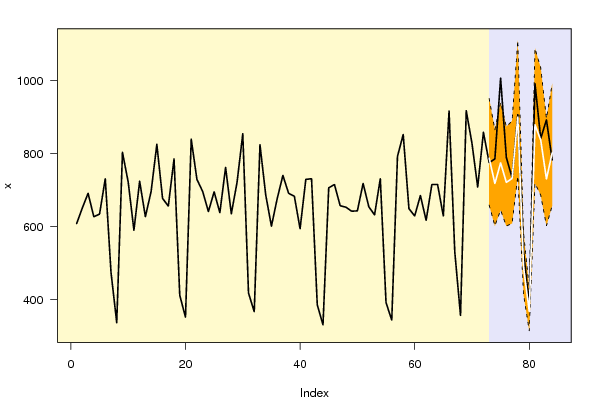
bitmap(file='test1.png')
opar <- par(mar=c(4,4,2,2),las=1)
ylim <- c( min(x[first:nx],lb), max(x[first:nx],ub))
plot(x,ylim=ylim,type='n',xlim=c(first,lx))
usr <- par('usr')
rect(usr[1],usr[3],nx+1,usr[4],border=NA,col='lemonchiffon')
rect(nx1,usr[3],usr[2],usr[4],border=NA,col='lavender')
abline(h= (-3:3)*2 , col ='gray', lty =3)
polygon( c(nx1:lx,lx:nx1), c(lb,rev(ub)), col = 'orange', lty=2,border=NA)
lines(nx1:lx, lb , lty=2)
lines(nx1:lx, ub , lty=2)
lines(x, lwd=2)
lines(nx1:lx, forecast$pred , lwd=2 , col ='white')
box()
par(opar)
dev.off()
prob.dec <- array(NA, dim=fx)
prob.sdec <- array(NA, dim=fx)
prob.ldec <- array(NA, dim=fx)
prob.pval <- array(NA, dim=fx)
perf.pe <- array(0, dim=fx)
perf.mape <- array(0, dim=fx)
perf.mape1 <- array(0, dim=fx)
perf.se <- array(0, dim=fx)
perf.mse <- array(0, dim=fx)
perf.mse1 <- array(0, dim=fx)
perf.rmse <- array(0, dim=fx)
for (i in 1:fx) {
locSD <- (ub[i] - forecast$pred[i]) / 1.96
perf.pe[i] = (x[nx+i] - forecast$pred[i]) / forecast$pred[i]
perf.se[i] = (x[nx+i] - forecast$pred[i])^2
prob.dec[i] = pnorm((x[nx+i-1] - forecast$pred[i]) / locSD)
prob.sdec[i] = pnorm((x[nx+i-par5] - forecast$pred[i]) / locSD)
prob.ldec[i] = pnorm((x[nx] - forecast$pred[i]) / locSD)
prob.pval[i] = pnorm(abs(x[nx+i] - forecast$pred[i]) / locSD)
}
perf.mape[1] = abs(perf.pe[1])
perf.mse[1] = abs(perf.se[1])
for (i in 2:fx) {
perf.mape[i] = perf.mape[i-1] + abs(perf.pe[i])
perf.mape1[i] = perf.mape[i] / i
perf.mse[i] = perf.mse[i-1] + perf.se[i]
perf.mse1[i] = perf.mse[i] / i
}
perf.rmse = sqrt(perf.mse1)
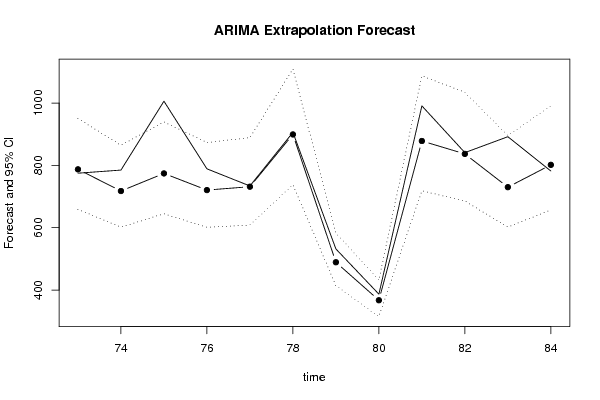
bitmap(file='test2.png')
plot(forecast$pred, pch=19, type='b',main='ARIMA Extrapolation Forecast', ylab='Forecast and 95% CI', xlab='time',ylim=c(min(lb),max(ub)))
dum <- forecast$pred
dum[1:par1] <- x[(nx+1):lx]
lines(dum, lty=1)
lines(ub,lty=3)
lines(lb,lty=3)
dev.off()
load(file='createtable')
a<-table.start()
a<-table.row.start(a)
a<-table.element(a,'Univariate ARIMA Extrapolation Forecast',9,TRUE)
a<-table.row.end(a)
a<-table.row.start(a)
a<-table.element(a,'time',1,header=TRUE)
a<-table.element(a,'Y[t]',1,header=TRUE)
a<-table.element(a,'F[t]',1,header=TRUE)
a<-table.element(a,'95% LB',1,header=TRUE)
a<-table.element(a,'95% UB',1,header=TRUE)
a<-table.element(a,'p-value
(H0: Y[t] = F[t])',1,header=TRUE)
a<-table.element(a,'P(F[t]>Y[t-1])',1,header=TRUE)
a<-table.element(a,'P(F[t]>Y[t-s])',1,header=TRUE)
mylab <- paste('P(F[t]>Y[',nx,sep='')
mylab <- paste(mylab,'])',sep='')
a<-table.element(a,mylab,1,header=TRUE)
a<-table.row.end(a)
for (i in (nx-par5):nx) {
a<-table.row.start(a)
a<-table.element(a,i,header=TRUE)
a<-table.element(a,x[i])
a<-table.element(a,'-')
a<-table.row.end(a)
}
for (i in 1:fx) {
a<-table.row.start(a)
a<-table.element(a,nx+i,header=TRUE)
a<-table.element(a,round(x[nx+i],4))
a<-table.element(a,round(forecast$pred[i],4))
a<-table.element(a,round(lb[i],4))
a<-table.element(a,round(ub[i],4))
a<-table.element(a,round((1-prob.pval[i]),4))
a<-table.element(a,round((1-prob.dec[i]),4))
a<-table.element(a,round((1-prob.sdec[i]),4))
a<-table.element(a,round((1-prob.ldec[i]),4))
a<-table.row.end(a)
}
a<-table.end(a)
table.save(a,file='mytable.tab')
a<-table.start()
a<-table.row.start(a)
a<-table.element(a,'Univariate ARIMA Extrapolation Forecast Performance',7,TRUE)
a<-table.row.end(a)
a<-table.row.start(a)
a<-table.element(a,'time',1,header=TRUE)
a<-table.element(a,'% S.E.',1,header=TRUE)
a<-table.element(a,'PE',1,header=TRUE)
a<-table.element(a,'MAPE',1,header=TRUE)
a<-table.element(a,'Sq.E',1,header=TRUE)
a<-table.element(a,'MSE',1,header=TRUE)
a<-table.element(a,'RMSE',1,header=TRUE)
a<-table.row.end(a)
for (i in 1:fx) {
a<-table.row.start(a)
a<-table.element(a,nx+i,header=TRUE)
a<-table.element(a,round(perc.se[i],4))
a<-table.element(a,round(perf.pe[i],4))
a<-table.element(a,round(perf.mape1[i],4))
a<-table.element(a,round(perf.se[i],4))
a<-table.element(a,round(perf.mse1[i],4))
a<-table.element(a,round(perf.rmse[i],4))
a<-table.row.end(a)
}
a<-table.end(a)
table.save(a,file='mytable1.tab')