Free Statistics

of Irreproducible Research!

Author's title

Author*The author of this computation has been verified*
R Software Modulerwasp_regression_trees1.wasp
Title produced by softwareRecursive Partitioning (Regression Trees)
Date of computationTue, 21 Dec 2010 12:17:34 +0000
Cite this page as followsStatistical Computations at FreeStatistics.org, Office for Research Development and Education, URL https://freestatistics.org/blog/index.php?v=date/2010/Dec/21/t1292933743ew843xb37gfd7lk.htm/, Retrieved Fri, 17 May 2024 18:51:25 +0000
Statistical Computations at FreeStatistics.org, Office for Research Development and Education, URL https://freestatistics.org/blog/index.php?pk=113368, Retrieved Fri, 17 May 2024 18:51:25 +0000
QR Codes:

Original text written by user:
IsPrivate?No (this computation is public)
User-defined keywords
Estimated Impact143
Family? (F = Feedback message, R = changed R code, M = changed R Module, P = changed Parameters, D = changed Data)
-     [Recursive Partitioning (Regression Trees)] [] [2010-12-05 18:59:57] [b98453cac15ba1066b407e146608df68]
-   PD    [Recursive Partitioning (Regression Trees)] [] [2010-12-21 12:17:34] [1d208f56d63f78e3037c4c685f0bba30] [Current]
-   PD      [Recursive Partitioning (Regression Trees)] [recursive partiti...] [2010-12-24 10:20:08] [d4d7f64064e581afd5f11cb27d8ab03c]
-   PD      [Recursive Partitioning (Regression Trees)] [recursive partiti...] [2010-12-24 10:22:35] [d4d7f64064e581afd5f11cb27d8ab03c]
Feedback Forum

Post a new message
Dataseries X:
112,3	112,9	88,7	105,1
117,3	130,5	94,6	114,9
111,1	137,9	98,7	106,4
102,2	115	84,2	104,5
104,3	116,8	87,7	121,6
122,9	140,9	103,3	141,4
107,6	120,7	88,2	99
121,3	134,2	93,4	126,7
131,5	147,3	106,3	134,1
89	112,4	73,1	81,3
104,4	107,1	78,6	88,6
128,9	128,4	101,6	132,7
135,9	137,7	101,4	132,9
133,3	135	98,5	134,4
121,3	151	99	103,7
120,5	137,4	89,5	119,7
120,4	132,4	83,5	115
137,9	161,3	97,4	132,9
126,1	139,8	87,8	108,5
133,2	146	90,4	113,9
151,1	166,5	101,6	142
105	143,3	80	97,7
119	121	81,7	92,2
140,4	152,6	96,4	128,8
156,6	154,4	110,2	134,9
137,1	154,6	101,1	128,2
122,7	158	89,3	114,8
125,8	142,6	90	117,9
139,3	153,4	95,4	119,1
134,9	163,4	100,3	120,7
149,2	167,3	99,5	129,1
132,3	154,8	93,9	117,6
149	165,7	100,6	129,2
117,2	144,7	84,7	100
119,6	120,9	81,6	87
152	152,8	109	128
149,4	160,2	99	127,7
127,3	128,3	81,1	93,4
114,1	150,5	81,8	84,1
102,1	117	66,5	71,7
107,7	116	66,4	83,2
104,4	133,3	86,3	89,1
102,1	116,4	73,6	79,6
96	104	71,5	62,8
109,3	126,6	87,2	95,1
90	92,9	65,3	63,6
83,9	83,6	69,7	61,4
112	112,8	95,5	98,2
114,3	113,2	86,3	95,3
103,6	118,5	81	81,5
91,7	125,5	88,7	85,5
80,8	91,3	71,9	71,1
87,2	105,4	78,6	78,1
109,2	121,3	96	103
102,7	106,9	81,1	86
95,1	109,4	77,5	86,2
117,5	132,6	97,3	105,7
85,1	96,8	78,6	57,2
92,1	100,3	79	73,7
113,5	119,2	93,4	120,5


Summary of computational transaction
Raw Inputview raw input (R code)
Raw Outputview raw output of R engine
Computing time4 seconds
R Server'RServer@AstonUniversity' @ vre.aston.ac.uk

\begin{tabular}{lllllllll}
\hline
Summary of computational transaction \tabularnewline
Raw Input & view raw input (R code)  \tabularnewline
Raw Output & view raw output of R engine  \tabularnewline
Computing time & 4 seconds \tabularnewline
R Server & 'RServer@AstonUniversity' @ vre.aston.ac.uk \tabularnewline
\hline
\end{tabular}
%Source: https://freestatistics.org/blog/index.php?pk=113368&T=0

[TABLE]
[ROW][C]Summary of computational transaction[/C][/ROW]
[ROW][C]Raw Input[/C][C]view raw input (R code) [/C][/ROW]
[ROW][C]Raw Output[/C][C]view raw output of R engine [/C][/ROW]
[ROW][C]Computing time[/C][C]4 seconds[/C][/ROW]
[ROW][C]R Server[/C][C]'RServer@AstonUniversity' @ vre.aston.ac.uk[/C][/ROW]
[/TABLE]
Source: https://freestatistics.org/blog/index.php?pk=113368&T=0

Globally Unique Identifier (entire table): ba.freestatistics.org/blog/index.php?pk=113368&T=0

As an alternative you can also use a QR Code:  

The GUIDs for individual cells are displayed in the table below:

Summary of computational transaction
Raw Inputview raw input (R code)
Raw Outputview raw output of R engine
Computing time4 seconds
R Server'RServer@AstonUniversity' @ vre.aston.ac.uk


Goodness of Fit
Correlation0.9229
R-squared0.8518
RMSE8.6348

\begin{tabular}{lllllllll}
\hline
Goodness of Fit \tabularnewline
Correlation & 0.9229 \tabularnewline
R-squared & 0.8518 \tabularnewline
RMSE & 8.6348 \tabularnewline
\hline
\end{tabular}
%Source: https://freestatistics.org/blog/index.php?pk=113368&T=1

[TABLE]
[ROW][C]Goodness of Fit[/C][/ROW]
[ROW][C]Correlation[/C][C]0.9229[/C][/ROW]
[ROW][C]R-squared[/C][C]0.8518[/C][/ROW]
[ROW][C]RMSE[/C][C]8.6348[/C][/ROW]
[/TABLE]
Source: https://freestatistics.org/blog/index.php?pk=113368&T=1

Globally Unique Identifier (entire table): ba.freestatistics.org/blog/index.php?pk=113368&T=1

As an alternative you can also use a QR Code:  

The GUIDs for individual cells are displayed in the table below:

Goodness of Fit
Correlation0.9229
R-squared0.8518
RMSE8.6348


Actuals, Predictions, and Residuals
#ActualsForecastsResiduals
1105.1108.914285714286-3.81428571428572
2114.9108.9142857142865.9857142857143
3106.4108.914285714286-2.51428571428571
4104.592.846666666666711.6533333333333
5121.6108.91428571428612.6857142857143
6141.4131.9461538461549.45384615384617
799108.914285714286-9.9142857142857
8126.7108.91428571428617.7857142857143
9134.1131.9461538461542.15384615384616
1081.371.51818181818189.78181818181818
1188.692.8466666666667-4.24666666666667
12132.7131.9461538461540.753846153846155
13132.9131.9461538461540.953846153846172
14134.4131.9461538461542.45384615384617
15103.7108.914285714286-5.21428571428571
16119.7108.91428571428610.7857142857143
1711592.846666666666722.1533333333333
18132.9119.81428571428613.0857142857143
19108.5119.814285714286-11.3142857142857
20113.9119.814285714286-5.91428571428571
21142131.94615384615410.0538461538462
2297.792.84666666666674.85333333333334
2392.292.8466666666667-0.646666666666661
24128.8119.8142857142868.9857142857143
25134.9131.9461538461542.95384615384617
26128.2131.946153846154-3.74615384615385
27114.8108.9142857142865.88571428571429
28117.9119.814285714286-1.91428571428571
29119.1119.814285714286-0.714285714285722
30120.7131.946153846154-11.2461538461538
31129.1131.946153846154-2.84615384615384
32117.6119.814285714286-2.21428571428572
33129.2131.946153846154-2.74615384615385
3410092.84666666666677.15333333333334
358792.8466666666667-5.84666666666666
36128131.946153846154-3.94615384615383
37127.7131.946153846154-4.24615384615383
3893.492.84666666666670.553333333333342
3984.192.8466666666667-8.74666666666667
4071.771.51818181818180.181818181818187
4183.292.8466666666667-9.64666666666666
4289.192.8466666666667-3.74666666666667
4379.671.51818181818188.08181818181818
4462.871.5181818181818-8.71818181818182
4595.192.84666666666672.25333333333333
4663.671.5181818181818-7.91818181818181
4761.471.5181818181818-10.1181818181818
4898.2108.914285714286-10.7142857142857
4995.392.84666666666672.45333333333333
5081.592.8466666666667-11.3466666666667
5185.5108.914285714286-23.4142857142857
5271.171.5181818181818-0.418181818181822
5378.171.51818181818186.58181818181818
54103108.914285714286-5.91428571428571
558692.8466666666667-6.84666666666666
5686.271.518181818181814.6818181818182
57105.7108.914285714286-3.21428571428571
5857.271.5181818181818-14.3181818181818
5973.771.51818181818182.18181818181819
60120.5108.91428571428611.5857142857143

\begin{tabular}{lllllllll}
\hline
Actuals, Predictions, and Residuals \tabularnewline
# & Actuals & Forecasts & Residuals \tabularnewline
1 & 105.1 & 108.914285714286 & -3.81428571428572 \tabularnewline
2 & 114.9 & 108.914285714286 & 5.9857142857143 \tabularnewline
3 & 106.4 & 108.914285714286 & -2.51428571428571 \tabularnewline
4 & 104.5 & 92.8466666666667 & 11.6533333333333 \tabularnewline
5 & 121.6 & 108.914285714286 & 12.6857142857143 \tabularnewline
6 & 141.4 & 131.946153846154 & 9.45384615384617 \tabularnewline
7 & 99 & 108.914285714286 & -9.9142857142857 \tabularnewline
8 & 126.7 & 108.914285714286 & 17.7857142857143 \tabularnewline
9 & 134.1 & 131.946153846154 & 2.15384615384616 \tabularnewline
10 & 81.3 & 71.5181818181818 & 9.78181818181818 \tabularnewline
11 & 88.6 & 92.8466666666667 & -4.24666666666667 \tabularnewline
12 & 132.7 & 131.946153846154 & 0.753846153846155 \tabularnewline
13 & 132.9 & 131.946153846154 & 0.953846153846172 \tabularnewline
14 & 134.4 & 131.946153846154 & 2.45384615384617 \tabularnewline
15 & 103.7 & 108.914285714286 & -5.21428571428571 \tabularnewline
16 & 119.7 & 108.914285714286 & 10.7857142857143 \tabularnewline
17 & 115 & 92.8466666666667 & 22.1533333333333 \tabularnewline
18 & 132.9 & 119.814285714286 & 13.0857142857143 \tabularnewline
19 & 108.5 & 119.814285714286 & -11.3142857142857 \tabularnewline
20 & 113.9 & 119.814285714286 & -5.91428571428571 \tabularnewline
21 & 142 & 131.946153846154 & 10.0538461538462 \tabularnewline
22 & 97.7 & 92.8466666666667 & 4.85333333333334 \tabularnewline
23 & 92.2 & 92.8466666666667 & -0.646666666666661 \tabularnewline
24 & 128.8 & 119.814285714286 & 8.9857142857143 \tabularnewline
25 & 134.9 & 131.946153846154 & 2.95384615384617 \tabularnewline
26 & 128.2 & 131.946153846154 & -3.74615384615385 \tabularnewline
27 & 114.8 & 108.914285714286 & 5.88571428571429 \tabularnewline
28 & 117.9 & 119.814285714286 & -1.91428571428571 \tabularnewline
29 & 119.1 & 119.814285714286 & -0.714285714285722 \tabularnewline
30 & 120.7 & 131.946153846154 & -11.2461538461538 \tabularnewline
31 & 129.1 & 131.946153846154 & -2.84615384615384 \tabularnewline
32 & 117.6 & 119.814285714286 & -2.21428571428572 \tabularnewline
33 & 129.2 & 131.946153846154 & -2.74615384615385 \tabularnewline
34 & 100 & 92.8466666666667 & 7.15333333333334 \tabularnewline
35 & 87 & 92.8466666666667 & -5.84666666666666 \tabularnewline
36 & 128 & 131.946153846154 & -3.94615384615383 \tabularnewline
37 & 127.7 & 131.946153846154 & -4.24615384615383 \tabularnewline
38 & 93.4 & 92.8466666666667 & 0.553333333333342 \tabularnewline
39 & 84.1 & 92.8466666666667 & -8.74666666666667 \tabularnewline
40 & 71.7 & 71.5181818181818 & 0.181818181818187 \tabularnewline
41 & 83.2 & 92.8466666666667 & -9.64666666666666 \tabularnewline
42 & 89.1 & 92.8466666666667 & -3.74666666666667 \tabularnewline
43 & 79.6 & 71.5181818181818 & 8.08181818181818 \tabularnewline
44 & 62.8 & 71.5181818181818 & -8.71818181818182 \tabularnewline
45 & 95.1 & 92.8466666666667 & 2.25333333333333 \tabularnewline
46 & 63.6 & 71.5181818181818 & -7.91818181818181 \tabularnewline
47 & 61.4 & 71.5181818181818 & -10.1181818181818 \tabularnewline
48 & 98.2 & 108.914285714286 & -10.7142857142857 \tabularnewline
49 & 95.3 & 92.8466666666667 & 2.45333333333333 \tabularnewline
50 & 81.5 & 92.8466666666667 & -11.3466666666667 \tabularnewline
51 & 85.5 & 108.914285714286 & -23.4142857142857 \tabularnewline
52 & 71.1 & 71.5181818181818 & -0.418181818181822 \tabularnewline
53 & 78.1 & 71.5181818181818 & 6.58181818181818 \tabularnewline
54 & 103 & 108.914285714286 & -5.91428571428571 \tabularnewline
55 & 86 & 92.8466666666667 & -6.84666666666666 \tabularnewline
56 & 86.2 & 71.5181818181818 & 14.6818181818182 \tabularnewline
57 & 105.7 & 108.914285714286 & -3.21428571428571 \tabularnewline
58 & 57.2 & 71.5181818181818 & -14.3181818181818 \tabularnewline
59 & 73.7 & 71.5181818181818 & 2.18181818181819 \tabularnewline
60 & 120.5 & 108.914285714286 & 11.5857142857143 \tabularnewline
\hline
\end{tabular}
%Source: https://freestatistics.org/blog/index.php?pk=113368&T=2

[TABLE]
[ROW][C]Actuals, Predictions, and Residuals[/C][/ROW]
[ROW][C]#[/C][C]Actuals[/C][C]Forecasts[/C][C]Residuals[/C][/ROW]
[ROW][C]1[/C][C]105.1[/C][C]108.914285714286[/C][C]-3.81428571428572[/C][/ROW]
[ROW][C]2[/C][C]114.9[/C][C]108.914285714286[/C][C]5.9857142857143[/C][/ROW]
[ROW][C]3[/C][C]106.4[/C][C]108.914285714286[/C][C]-2.51428571428571[/C][/ROW]
[ROW][C]4[/C][C]104.5[/C][C]92.8466666666667[/C][C]11.6533333333333[/C][/ROW]
[ROW][C]5[/C][C]121.6[/C][C]108.914285714286[/C][C]12.6857142857143[/C][/ROW]
[ROW][C]6[/C][C]141.4[/C][C]131.946153846154[/C][C]9.45384615384617[/C][/ROW]
[ROW][C]7[/C][C]99[/C][C]108.914285714286[/C][C]-9.9142857142857[/C][/ROW]
[ROW][C]8[/C][C]126.7[/C][C]108.914285714286[/C][C]17.7857142857143[/C][/ROW]
[ROW][C]9[/C][C]134.1[/C][C]131.946153846154[/C][C]2.15384615384616[/C][/ROW]
[ROW][C]10[/C][C]81.3[/C][C]71.5181818181818[/C][C]9.78181818181818[/C][/ROW]
[ROW][C]11[/C][C]88.6[/C][C]92.8466666666667[/C][C]-4.24666666666667[/C][/ROW]
[ROW][C]12[/C][C]132.7[/C][C]131.946153846154[/C][C]0.753846153846155[/C][/ROW]
[ROW][C]13[/C][C]132.9[/C][C]131.946153846154[/C][C]0.953846153846172[/C][/ROW]
[ROW][C]14[/C][C]134.4[/C][C]131.946153846154[/C][C]2.45384615384617[/C][/ROW]
[ROW][C]15[/C][C]103.7[/C][C]108.914285714286[/C][C]-5.21428571428571[/C][/ROW]
[ROW][C]16[/C][C]119.7[/C][C]108.914285714286[/C][C]10.7857142857143[/C][/ROW]
[ROW][C]17[/C][C]115[/C][C]92.8466666666667[/C][C]22.1533333333333[/C][/ROW]
[ROW][C]18[/C][C]132.9[/C][C]119.814285714286[/C][C]13.0857142857143[/C][/ROW]
[ROW][C]19[/C][C]108.5[/C][C]119.814285714286[/C][C]-11.3142857142857[/C][/ROW]
[ROW][C]20[/C][C]113.9[/C][C]119.814285714286[/C][C]-5.91428571428571[/C][/ROW]
[ROW][C]21[/C][C]142[/C][C]131.946153846154[/C][C]10.0538461538462[/C][/ROW]
[ROW][C]22[/C][C]97.7[/C][C]92.8466666666667[/C][C]4.85333333333334[/C][/ROW]
[ROW][C]23[/C][C]92.2[/C][C]92.8466666666667[/C][C]-0.646666666666661[/C][/ROW]
[ROW][C]24[/C][C]128.8[/C][C]119.814285714286[/C][C]8.9857142857143[/C][/ROW]
[ROW][C]25[/C][C]134.9[/C][C]131.946153846154[/C][C]2.95384615384617[/C][/ROW]
[ROW][C]26[/C][C]128.2[/C][C]131.946153846154[/C][C]-3.74615384615385[/C][/ROW]
[ROW][C]27[/C][C]114.8[/C][C]108.914285714286[/C][C]5.88571428571429[/C][/ROW]
[ROW][C]28[/C][C]117.9[/C][C]119.814285714286[/C][C]-1.91428571428571[/C][/ROW]
[ROW][C]29[/C][C]119.1[/C][C]119.814285714286[/C][C]-0.714285714285722[/C][/ROW]
[ROW][C]30[/C][C]120.7[/C][C]131.946153846154[/C][C]-11.2461538461538[/C][/ROW]
[ROW][C]31[/C][C]129.1[/C][C]131.946153846154[/C][C]-2.84615384615384[/C][/ROW]
[ROW][C]32[/C][C]117.6[/C][C]119.814285714286[/C][C]-2.21428571428572[/C][/ROW]
[ROW][C]33[/C][C]129.2[/C][C]131.946153846154[/C][C]-2.74615384615385[/C][/ROW]
[ROW][C]34[/C][C]100[/C][C]92.8466666666667[/C][C]7.15333333333334[/C][/ROW]
[ROW][C]35[/C][C]87[/C][C]92.8466666666667[/C][C]-5.84666666666666[/C][/ROW]
[ROW][C]36[/C][C]128[/C][C]131.946153846154[/C][C]-3.94615384615383[/C][/ROW]
[ROW][C]37[/C][C]127.7[/C][C]131.946153846154[/C][C]-4.24615384615383[/C][/ROW]
[ROW][C]38[/C][C]93.4[/C][C]92.8466666666667[/C][C]0.553333333333342[/C][/ROW]
[ROW][C]39[/C][C]84.1[/C][C]92.8466666666667[/C][C]-8.74666666666667[/C][/ROW]
[ROW][C]40[/C][C]71.7[/C][C]71.5181818181818[/C][C]0.181818181818187[/C][/ROW]
[ROW][C]41[/C][C]83.2[/C][C]92.8466666666667[/C][C]-9.64666666666666[/C][/ROW]
[ROW][C]42[/C][C]89.1[/C][C]92.8466666666667[/C][C]-3.74666666666667[/C][/ROW]
[ROW][C]43[/C][C]79.6[/C][C]71.5181818181818[/C][C]8.08181818181818[/C][/ROW]
[ROW][C]44[/C][C]62.8[/C][C]71.5181818181818[/C][C]-8.71818181818182[/C][/ROW]
[ROW][C]45[/C][C]95.1[/C][C]92.8466666666667[/C][C]2.25333333333333[/C][/ROW]
[ROW][C]46[/C][C]63.6[/C][C]71.5181818181818[/C][C]-7.91818181818181[/C][/ROW]
[ROW][C]47[/C][C]61.4[/C][C]71.5181818181818[/C][C]-10.1181818181818[/C][/ROW]
[ROW][C]48[/C][C]98.2[/C][C]108.914285714286[/C][C]-10.7142857142857[/C][/ROW]
[ROW][C]49[/C][C]95.3[/C][C]92.8466666666667[/C][C]2.45333333333333[/C][/ROW]
[ROW][C]50[/C][C]81.5[/C][C]92.8466666666667[/C][C]-11.3466666666667[/C][/ROW]
[ROW][C]51[/C][C]85.5[/C][C]108.914285714286[/C][C]-23.4142857142857[/C][/ROW]
[ROW][C]52[/C][C]71.1[/C][C]71.5181818181818[/C][C]-0.418181818181822[/C][/ROW]
[ROW][C]53[/C][C]78.1[/C][C]71.5181818181818[/C][C]6.58181818181818[/C][/ROW]
[ROW][C]54[/C][C]103[/C][C]108.914285714286[/C][C]-5.91428571428571[/C][/ROW]
[ROW][C]55[/C][C]86[/C][C]92.8466666666667[/C][C]-6.84666666666666[/C][/ROW]
[ROW][C]56[/C][C]86.2[/C][C]71.5181818181818[/C][C]14.6818181818182[/C][/ROW]
[ROW][C]57[/C][C]105.7[/C][C]108.914285714286[/C][C]-3.21428571428571[/C][/ROW]
[ROW][C]58[/C][C]57.2[/C][C]71.5181818181818[/C][C]-14.3181818181818[/C][/ROW]
[ROW][C]59[/C][C]73.7[/C][C]71.5181818181818[/C][C]2.18181818181819[/C][/ROW]
[ROW][C]60[/C][C]120.5[/C][C]108.914285714286[/C][C]11.5857142857143[/C][/ROW]
[/TABLE]
Source: https://freestatistics.org/blog/index.php?pk=113368&T=2

Globally Unique Identifier (entire table): ba.freestatistics.org/blog/index.php?pk=113368&T=2

As an alternative you can also use a QR Code:  

The GUIDs for individual cells are displayed in the table below:

Actuals, Predictions, and Residuals
#ActualsForecastsResiduals
1105.1108.914285714286-3.81428571428572
2114.9108.9142857142865.9857142857143
3106.4108.914285714286-2.51428571428571
4104.592.846666666666711.6533333333333
5121.6108.91428571428612.6857142857143
6141.4131.9461538461549.45384615384617
799108.914285714286-9.9142857142857
8126.7108.91428571428617.7857142857143
9134.1131.9461538461542.15384615384616
1081.371.51818181818189.78181818181818
1188.692.8466666666667-4.24666666666667
12132.7131.9461538461540.753846153846155
13132.9131.9461538461540.953846153846172
14134.4131.9461538461542.45384615384617
15103.7108.914285714286-5.21428571428571
16119.7108.91428571428610.7857142857143
1711592.846666666666722.1533333333333
18132.9119.81428571428613.0857142857143
19108.5119.814285714286-11.3142857142857
20113.9119.814285714286-5.91428571428571
21142131.94615384615410.0538461538462
2297.792.84666666666674.85333333333334
2392.292.8466666666667-0.646666666666661
24128.8119.8142857142868.9857142857143
25134.9131.9461538461542.95384615384617
26128.2131.946153846154-3.74615384615385
27114.8108.9142857142865.88571428571429
28117.9119.814285714286-1.91428571428571
29119.1119.814285714286-0.714285714285722
30120.7131.946153846154-11.2461538461538
31129.1131.946153846154-2.84615384615384
32117.6119.814285714286-2.21428571428572
33129.2131.946153846154-2.74615384615385
3410092.84666666666677.15333333333334
358792.8466666666667-5.84666666666666
36128131.946153846154-3.94615384615383
37127.7131.946153846154-4.24615384615383
3893.492.84666666666670.553333333333342
3984.192.8466666666667-8.74666666666667
4071.771.51818181818180.181818181818187
4183.292.8466666666667-9.64666666666666
4289.192.8466666666667-3.74666666666667
4379.671.51818181818188.08181818181818
4462.871.5181818181818-8.71818181818182
4595.192.84666666666672.25333333333333
4663.671.5181818181818-7.91818181818181
4761.471.5181818181818-10.1181818181818
4898.2108.914285714286-10.7142857142857
4995.392.84666666666672.45333333333333
5081.592.8466666666667-11.3466666666667
5185.5108.914285714286-23.4142857142857
5271.171.5181818181818-0.418181818181822
5378.171.51818181818186.58181818181818
54103108.914285714286-5.91428571428571
558692.8466666666667-6.84666666666666
5686.271.518181818181814.6818181818182
57105.7108.914285714286-3.21428571428571
5857.271.5181818181818-14.3181818181818
5973.771.51818181818182.18181818181819
60120.5108.91428571428611.5857142857143


Parameters (Session):
par1 = 4 ; par2 = none ; par3 = 3 ; par4 = no ;
Parameters (R input):
par1 = 4 ; par2 = none ; par3 = 3 ; par4 = no ;
R code (references can be found in the software module):
library(party)
library(Hmisc)
par1 <- as.numeric(par1)
par3 <- as.numeric(par3)
x <- data.frame(t(y))
is.data.frame(x)
x <- x[!is.na(x[,par1]),]
k <- length(x[1,])
n <- length(x[,1])
colnames(x)[par1]
x[,par1]
if (par2 == 'kmeans') {
cl <- kmeans(x[,par1], par3)
print(cl)
clm <- matrix(cbind(cl$centers,1:par3),ncol=2)
clm <- clm[sort.list(clm[,1]),]
for (i in 1:par3) {
cl$cluster[cl$cluster==clm[i,2]] <- paste('C',i,sep='')
}
cl$cluster <- as.factor(cl$cluster)
print(cl$cluster)
x[,par1] <- cl$cluster
}
if (par2 == 'quantiles') {
x[,par1] <- cut2(x[,par1],g=par3)
}
if (par2 == 'hclust') {
hc <- hclust(dist(x[,par1])^2, 'cen')
print(hc)
memb <- cutree(hc, k = par3)
dum <- c(mean(x[memb==1,par1]))
for (i in 2:par3) {
dum <- c(dum, mean(x[memb==i,par1]))
}
hcm <- matrix(cbind(dum,1:par3),ncol=2)
hcm <- hcm[sort.list(hcm[,1]),]
for (i in 1:par3) {
memb[memb==hcm[i,2]] <- paste('C',i,sep='')
}
memb <- as.factor(memb)
print(memb)
x[,par1] <- memb
}
if (par2=='equal') {
ed <- cut(as.numeric(x[,par1]),par3,labels=paste('C',1:par3,sep=''))
x[,par1] <- as.factor(ed)
}
table(x[,par1])
colnames(x)
colnames(x)[par1]
x[,par1]
if (par2 == 'none') {
m <- ctree(as.formula(paste(colnames(x)[par1],' ~ .',sep='')),data = x)
}
load(file='createtable')
if (par2 != 'none') {
m <- ctree(as.formula(paste('as.factor(',colnames(x)[par1],') ~ .',sep='')),data = x)
if (par4=='yes') {
a<-table.start()
a<-table.row.start(a)
a<-table.element(a,'10-Fold Cross Validation',3+2*par3,TRUE)
a<-table.row.end(a)
a<-table.row.start(a)
a<-table.element(a,'',1,TRUE)
a<-table.element(a,'Prediction (training)',par3+1,TRUE)
a<-table.element(a,'Prediction (testing)',par3+1,TRUE)
a<-table.row.end(a)
a<-table.row.start(a)
a<-table.element(a,'Actual',1,TRUE)
for (jjj in 1:par3) a<-table.element(a,paste('C',jjj,sep=''),1,TRUE)
a<-table.element(a,'CV',1,TRUE)
for (jjj in 1:par3) a<-table.element(a,paste('C',jjj,sep=''),1,TRUE)
a<-table.element(a,'CV',1,TRUE)
a<-table.row.end(a)
for (i in 1:10) {
ind <- sample(2, nrow(x), replace=T, prob=c(0.9,0.1))
m.ct <- ctree(as.formula(paste('as.factor(',colnames(x)[par1],') ~ .',sep='')),data =x[ind==1,])
if (i==1) {
m.ct.i.pred <- predict(m.ct, newdata=x[ind==1,])
m.ct.i.actu <- x[ind==1,par1]
m.ct.x.pred <- predict(m.ct, newdata=x[ind==2,])
m.ct.x.actu <- x[ind==2,par1]
} else {
m.ct.i.pred <- c(m.ct.i.pred,predict(m.ct, newdata=x[ind==1,]))
m.ct.i.actu <- c(m.ct.i.actu,x[ind==1,par1])
m.ct.x.pred <- c(m.ct.x.pred,predict(m.ct, newdata=x[ind==2,]))
m.ct.x.actu <- c(m.ct.x.actu,x[ind==2,par1])
}
}
print(m.ct.i.tab <- table(m.ct.i.actu,m.ct.i.pred))
numer <- 0
for (i in 1:par3) {
print(m.ct.i.tab[i,i] / sum(m.ct.i.tab[i,]))
numer <- numer + m.ct.i.tab[i,i]
}
print(m.ct.i.cp <- numer / sum(m.ct.i.tab))
print(m.ct.x.tab <- table(m.ct.x.actu,m.ct.x.pred))
numer <- 0
for (i in 1:par3) {
print(m.ct.x.tab[i,i] / sum(m.ct.x.tab[i,]))
numer <- numer + m.ct.x.tab[i,i]
}
print(m.ct.x.cp <- numer / sum(m.ct.x.tab))
for (i in 1:par3) {
a<-table.row.start(a)
a<-table.element(a,paste('C',i,sep=''),1,TRUE)
for (jjj in 1:par3) a<-table.element(a,m.ct.i.tab[i,jjj])
a<-table.element(a,round(m.ct.i.tab[i,i]/sum(m.ct.i.tab[i,]),4))
for (jjj in 1:par3) a<-table.element(a,m.ct.x.tab[i,jjj])
a<-table.element(a,round(m.ct.x.tab[i,i]/sum(m.ct.x.tab[i,]),4))
a<-table.row.end(a)
}
a<-table.row.start(a)
a<-table.element(a,'Overall',1,TRUE)
for (jjj in 1:par3) a<-table.element(a,'-')
a<-table.element(a,round(m.ct.i.cp,4))
for (jjj in 1:par3) a<-table.element(a,'-')
a<-table.element(a,round(m.ct.x.cp,4))
a<-table.row.end(a)
a<-table.end(a)
table.save(a,file='mytable3.tab')
}
}
m
bitmap(file='test1.png')
plot(m)
dev.off()
bitmap(file='test1a.png')
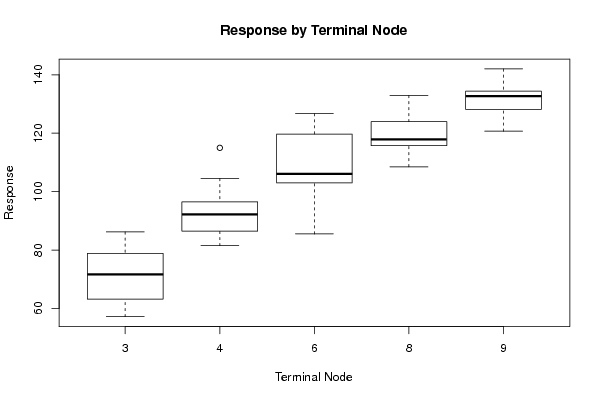
plot(x[,par1] ~ as.factor(where(m)),main='Response by Terminal Node',xlab='Terminal Node',ylab='Response')
dev.off()
if (par2 == 'none') {
forec <- predict(m)
result <- as.data.frame(cbind(x[,par1],forec,x[,par1]-forec))
colnames(result) <- c('Actuals','Forecasts','Residuals')
print(result)
}
if (par2 != 'none') {
print(cbind(as.factor(x[,par1]),predict(m)))
myt <- table(as.factor(x[,par1]),predict(m))
print(myt)
}
bitmap(file='test2.png')
if(par2=='none') {
op <- par(mfrow=c(2,2))
plot(density(result$Actuals),main='Kernel Density Plot of Actuals')
plot(density(result$Residuals),main='Kernel Density Plot of Residuals')
plot(result$Forecasts,result$Actuals,main='Actuals versus Predictions',xlab='Predictions',ylab='Actuals')
plot(density(result$Forecasts),main='Kernel Density Plot of Predictions')
par(op)
}
if(par2!='none') {
plot(myt,main='Confusion Matrix',xlab='Actual',ylab='Predicted')
}
dev.off()
if (par2 == 'none') {
detcoef <- cor(result$Forecasts,result$Actuals)
a<-table.start()
a<-table.row.start(a)
a<-table.element(a,'Goodness of Fit',2,TRUE)
a<-table.row.end(a)
a<-table.row.start(a)
a<-table.element(a,'Correlation',1,TRUE)
a<-table.element(a,round(detcoef,4))
a<-table.row.end(a)
a<-table.row.start(a)
a<-table.element(a,'R-squared',1,TRUE)
a<-table.element(a,round(detcoef*detcoef,4))
a<-table.row.end(a)
a<-table.row.start(a)
a<-table.element(a,'RMSE',1,TRUE)
a<-table.element(a,round(sqrt(mean((result$Residuals)^2)),4))
a<-table.row.end(a)
a<-table.end(a)
table.save(a,file='mytable1.tab')
a<-table.start()
a<-table.row.start(a)
a<-table.element(a,'Actuals, Predictions, and Residuals',4,TRUE)
a<-table.row.end(a)
a<-table.row.start(a)
a<-table.element(a,'#',header=TRUE)
a<-table.element(a,'Actuals',header=TRUE)
a<-table.element(a,'Forecasts',header=TRUE)
a<-table.element(a,'Residuals',header=TRUE)
a<-table.row.end(a)
for (i in 1:length(result$Actuals)) {
a<-table.row.start(a)
a<-table.element(a,i,header=TRUE)
a<-table.element(a,result$Actuals[i])
a<-table.element(a,result$Forecasts[i])
a<-table.element(a,result$Residuals[i])
a<-table.row.end(a)
}
a<-table.end(a)
table.save(a,file='mytable.tab')
}
if (par2 != 'none') {
a<-table.start()
a<-table.row.start(a)
a<-table.element(a,'Confusion Matrix (predicted in columns / actuals in rows)',par3+1,TRUE)
a<-table.row.end(a)
a<-table.row.start(a)
a<-table.element(a,'',1,TRUE)
for (i in 1:par3) {
a<-table.element(a,paste('C',i,sep=''),1,TRUE)
}
a<-table.row.end(a)
for (i in 1:par3) {
a<-table.row.start(a)
a<-table.element(a,paste('C',i,sep=''),1,TRUE)
for (j in 1:par3) {
a<-table.element(a,myt[i,j])
}
a<-table.row.end(a)
}
a<-table.end(a)
table.save(a,file='mytable2.tab')
}