Free Statistics

of Irreproducible Research!

Author's title

Author*The author of this computation has been verified*
R Software Modulerwasp_arimaforecasting.wasp
Title produced by softwareARIMA Forecasting
Date of computationTue, 21 Dec 2010 11:45:21 +0000
Cite this page as followsStatistical Computations at FreeStatistics.org, Office for Research Development and Education, URL https://freestatistics.org/blog/index.php?v=date/2010/Dec/21/t129293229777ealkavcd0ppgw.htm/, Retrieved Fri, 17 May 2024 08:26:53 +0000
Statistical Computations at FreeStatistics.org, Office for Research Development and Education, URL https://freestatistics.org/blog/index.php?pk=113324, Retrieved Fri, 17 May 2024 08:26:53 +0000
QR Codes:

Original text written by user:
IsPrivate?No (this computation is public)
User-defined keywords
Estimated Impact136
Family? (F = Feedback message, R = changed R code, M = changed R Module, P = changed Parameters, D = changed Data)
-     [Univariate Data Series] [] [2008-12-08 19:22:39] [d2d412c7f4d35ffbf5ee5ee89db327d4]
- RMPD  [ARIMA Backward Selection] [] [2010-12-14 13:44:15] [42a441ca3193af442aa2201743dfb347]
- RM      [ARIMA Forecasting] [] [2010-12-14 14:12:08] [07fa8844ca5618cd0482008937d9acea]
-   P         [ARIMA Forecasting] [] [2010-12-21 11:45:21] [ef8aba939446289dd59b403ac33ef077] [Current]
Feedback Forum

Post a new message
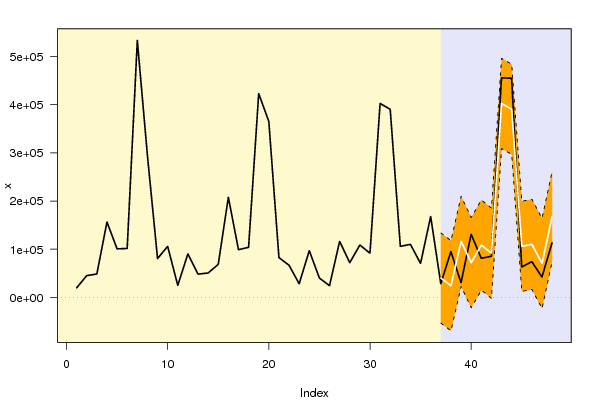
Dataseries X:
19876
45335
48674
156392
100837
101605
532850
294189
80763
105995
25045
90474
48481
50730
68694
207716
99132
104012
422632
364974
82687
66834
28408
97073
40284
24421
116346
72120
108751
91738
402216
390070
106045
110070
70668
167841
28607
95371
30605
131063
81214
85451
455196
454570
63114
74287
42350
113375


Summary of computational transaction
Raw Inputview raw input (R code)
Raw Outputview raw output of R engine
Computing time2 seconds
R Server'Gwilym Jenkins' @ 72.249.127.135

\begin{tabular}{lllllllll}
\hline
Summary of computational transaction \tabularnewline
Raw Input & view raw input (R code)  \tabularnewline
Raw Output & view raw output of R engine  \tabularnewline
Computing time & 2 seconds \tabularnewline
R Server & 'Gwilym Jenkins' @ 72.249.127.135 \tabularnewline
\hline
\end{tabular}
%Source: https://freestatistics.org/blog/index.php?pk=113324&T=0

[TABLE]
[ROW][C]Summary of computational transaction[/C][/ROW]
[ROW][C]Raw Input[/C][C]view raw input (R code) [/C][/ROW]
[ROW][C]Raw Output[/C][C]view raw output of R engine [/C][/ROW]
[ROW][C]Computing time[/C][C]2 seconds[/C][/ROW]
[ROW][C]R Server[/C][C]'Gwilym Jenkins' @ 72.249.127.135[/C][/ROW]
[/TABLE]
Source: https://freestatistics.org/blog/index.php?pk=113324&T=0

Globally Unique Identifier (entire table): ba.freestatistics.org/blog/index.php?pk=113324&T=0

As an alternative you can also use a QR Code:  

The GUIDs for individual cells are displayed in the table below:

Summary of computational transaction
Raw Inputview raw input (R code)
Raw Outputview raw output of R engine
Computing time2 seconds
R Server'Gwilym Jenkins' @ 72.249.127.135


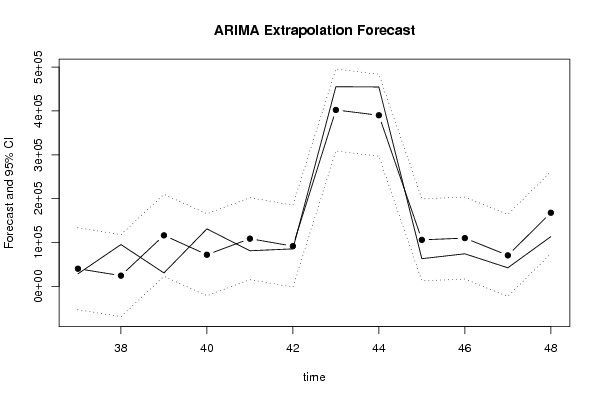
Univariate ARIMA Extrapolation Forecast
timeY[t]F[t]95% LB95% UBp-value(H0: Y[t] = F[t])P(F[t]>Y[t-1])P(F[t]>Y[t-s])P(F[t]>Y[36])
2497073-------
2540284-------
2624421-------
27116346-------
2872120-------
29108751-------
3091738-------
31402216-------
32390070-------
33106045-------
34110070-------
3570668-------
36167841-------
372860740284-53165.0325133733.03250.40330.00370.50.0037
389537124421-69028.0325117870.03250.06840.4650.50.0013
393060511634622896.9675209795.03250.03610.670.50.1401
4013106372120-21329.0325165569.03250.10820.80810.50.0223
418121410875115301.9675202200.03250.28180.31990.50.1076
428545191738-1711.0325185187.03250.44750.58730.50.0552
43455196402216308766.9675495665.03250.133210.51
44454570390070296620.9675483519.03250.08810.0860.51
456311410604512595.9675199494.03250.183900.50.0975
467428711007016620.9675203519.03250.22650.83770.50.1128
474235070668-22781.0325164117.03250.27630.46970.50.0208
4811337516784174391.9675261290.03250.12670.99580.50.5

\begin{tabular}{lllllllll}
\hline
Univariate ARIMA Extrapolation Forecast \tabularnewline
time & Y[t] & F[t] & 95% LB & 95% UB & p-value(H0: Y[t] = F[t]) & P(F[t]>Y[t-1]) & P(F[t]>Y[t-s]) & P(F[t]>Y[36]) \tabularnewline
24 & 97073 & - & - & - & - & - & - & - \tabularnewline
25 & 40284 & - & - & - & - & - & - & - \tabularnewline
26 & 24421 & - & - & - & - & - & - & - \tabularnewline
27 & 116346 & - & - & - & - & - & - & - \tabularnewline
28 & 72120 & - & - & - & - & - & - & - \tabularnewline
29 & 108751 & - & - & - & - & - & - & - \tabularnewline
30 & 91738 & - & - & - & - & - & - & - \tabularnewline
31 & 402216 & - & - & - & - & - & - & - \tabularnewline
32 & 390070 & - & - & - & - & - & - & - \tabularnewline
33 & 106045 & - & - & - & - & - & - & - \tabularnewline
34 & 110070 & - & - & - & - & - & - & - \tabularnewline
35 & 70668 & - & - & - & - & - & - & - \tabularnewline
36 & 167841 & - & - & - & - & - & - & - \tabularnewline
37 & 28607 & 40284 & -53165.0325 & 133733.0325 & 0.4033 & 0.0037 & 0.5 & 0.0037 \tabularnewline
38 & 95371 & 24421 & -69028.0325 & 117870.0325 & 0.0684 & 0.465 & 0.5 & 0.0013 \tabularnewline
39 & 30605 & 116346 & 22896.9675 & 209795.0325 & 0.0361 & 0.67 & 0.5 & 0.1401 \tabularnewline
40 & 131063 & 72120 & -21329.0325 & 165569.0325 & 0.1082 & 0.8081 & 0.5 & 0.0223 \tabularnewline
41 & 81214 & 108751 & 15301.9675 & 202200.0325 & 0.2818 & 0.3199 & 0.5 & 0.1076 \tabularnewline
42 & 85451 & 91738 & -1711.0325 & 185187.0325 & 0.4475 & 0.5873 & 0.5 & 0.0552 \tabularnewline
43 & 455196 & 402216 & 308766.9675 & 495665.0325 & 0.1332 & 1 & 0.5 & 1 \tabularnewline
44 & 454570 & 390070 & 296620.9675 & 483519.0325 & 0.0881 & 0.086 & 0.5 & 1 \tabularnewline
45 & 63114 & 106045 & 12595.9675 & 199494.0325 & 0.1839 & 0 & 0.5 & 0.0975 \tabularnewline
46 & 74287 & 110070 & 16620.9675 & 203519.0325 & 0.2265 & 0.8377 & 0.5 & 0.1128 \tabularnewline
47 & 42350 & 70668 & -22781.0325 & 164117.0325 & 0.2763 & 0.4697 & 0.5 & 0.0208 \tabularnewline
48 & 113375 & 167841 & 74391.9675 & 261290.0325 & 0.1267 & 0.9958 & 0.5 & 0.5 \tabularnewline
\hline
\end{tabular}
%Source: https://freestatistics.org/blog/index.php?pk=113324&T=1

[TABLE]
[ROW][C]Univariate ARIMA Extrapolation Forecast[/C][/ROW]
[ROW][C]time[/C][C]Y[t][/C][C]F[t][/C][C]95% LB[/C][C]95% UB[/C][C]p-value(H0: Y[t] = F[t])[/C][C]P(F[t]>Y[t-1])[/C][C]P(F[t]>Y[t-s])[/C][C]P(F[t]>Y[36])[/C][/ROW]
[ROW][C]24[/C][C]97073[/C][C]-[/C][C]-[/C][C]-[/C][C]-[/C][C]-[/C][C]-[/C][C]-[/C][/ROW]
[ROW][C]25[/C][C]40284[/C][C]-[/C][C]-[/C][C]-[/C][C]-[/C][C]-[/C][C]-[/C][C]-[/C][/ROW]
[ROW][C]26[/C][C]24421[/C][C]-[/C][C]-[/C][C]-[/C][C]-[/C][C]-[/C][C]-[/C][C]-[/C][/ROW]
[ROW][C]27[/C][C]116346[/C][C]-[/C][C]-[/C][C]-[/C][C]-[/C][C]-[/C][C]-[/C][C]-[/C][/ROW]
[ROW][C]28[/C][C]72120[/C][C]-[/C][C]-[/C][C]-[/C][C]-[/C][C]-[/C][C]-[/C][C]-[/C][/ROW]
[ROW][C]29[/C][C]108751[/C][C]-[/C][C]-[/C][C]-[/C][C]-[/C][C]-[/C][C]-[/C][C]-[/C][/ROW]
[ROW][C]30[/C][C]91738[/C][C]-[/C][C]-[/C][C]-[/C][C]-[/C][C]-[/C][C]-[/C][C]-[/C][/ROW]
[ROW][C]31[/C][C]402216[/C][C]-[/C][C]-[/C][C]-[/C][C]-[/C][C]-[/C][C]-[/C][C]-[/C][/ROW]
[ROW][C]32[/C][C]390070[/C][C]-[/C][C]-[/C][C]-[/C][C]-[/C][C]-[/C][C]-[/C][C]-[/C][/ROW]
[ROW][C]33[/C][C]106045[/C][C]-[/C][C]-[/C][C]-[/C][C]-[/C][C]-[/C][C]-[/C][C]-[/C][/ROW]
[ROW][C]34[/C][C]110070[/C][C]-[/C][C]-[/C][C]-[/C][C]-[/C][C]-[/C][C]-[/C][C]-[/C][/ROW]
[ROW][C]35[/C][C]70668[/C][C]-[/C][C]-[/C][C]-[/C][C]-[/C][C]-[/C][C]-[/C][C]-[/C][/ROW]
[ROW][C]36[/C][C]167841[/C][C]-[/C][C]-[/C][C]-[/C][C]-[/C][C]-[/C][C]-[/C][C]-[/C][/ROW]
[ROW][C]37[/C][C]28607[/C][C]40284[/C][C]-53165.0325[/C][C]133733.0325[/C][C]0.4033[/C][C]0.0037[/C][C]0.5[/C][C]0.0037[/C][/ROW]
[ROW][C]38[/C][C]95371[/C][C]24421[/C][C]-69028.0325[/C][C]117870.0325[/C][C]0.0684[/C][C]0.465[/C][C]0.5[/C][C]0.0013[/C][/ROW]
[ROW][C]39[/C][C]30605[/C][C]116346[/C][C]22896.9675[/C][C]209795.0325[/C][C]0.0361[/C][C]0.67[/C][C]0.5[/C][C]0.1401[/C][/ROW]
[ROW][C]40[/C][C]131063[/C][C]72120[/C][C]-21329.0325[/C][C]165569.0325[/C][C]0.1082[/C][C]0.8081[/C][C]0.5[/C][C]0.0223[/C][/ROW]
[ROW][C]41[/C][C]81214[/C][C]108751[/C][C]15301.9675[/C][C]202200.0325[/C][C]0.2818[/C][C]0.3199[/C][C]0.5[/C][C]0.1076[/C][/ROW]
[ROW][C]42[/C][C]85451[/C][C]91738[/C][C]-1711.0325[/C][C]185187.0325[/C][C]0.4475[/C][C]0.5873[/C][C]0.5[/C][C]0.0552[/C][/ROW]
[ROW][C]43[/C][C]455196[/C][C]402216[/C][C]308766.9675[/C][C]495665.0325[/C][C]0.1332[/C][C]1[/C][C]0.5[/C][C]1[/C][/ROW]
[ROW][C]44[/C][C]454570[/C][C]390070[/C][C]296620.9675[/C][C]483519.0325[/C][C]0.0881[/C][C]0.086[/C][C]0.5[/C][C]1[/C][/ROW]
[ROW][C]45[/C][C]63114[/C][C]106045[/C][C]12595.9675[/C][C]199494.0325[/C][C]0.1839[/C][C]0[/C][C]0.5[/C][C]0.0975[/C][/ROW]
[ROW][C]46[/C][C]74287[/C][C]110070[/C][C]16620.9675[/C][C]203519.0325[/C][C]0.2265[/C][C]0.8377[/C][C]0.5[/C][C]0.1128[/C][/ROW]
[ROW][C]47[/C][C]42350[/C][C]70668[/C][C]-22781.0325[/C][C]164117.0325[/C][C]0.2763[/C][C]0.4697[/C][C]0.5[/C][C]0.0208[/C][/ROW]
[ROW][C]48[/C][C]113375[/C][C]167841[/C][C]74391.9675[/C][C]261290.0325[/C][C]0.1267[/C][C]0.9958[/C][C]0.5[/C][C]0.5[/C][/ROW]
[/TABLE]
Source: https://freestatistics.org/blog/index.php?pk=113324&T=1

Globally Unique Identifier (entire table): ba.freestatistics.org/blog/index.php?pk=113324&T=1

As an alternative you can also use a QR Code:  

The GUIDs for individual cells are displayed in the table below:

Univariate ARIMA Extrapolation Forecast
timeY[t]F[t]95% LB95% UBp-value(H0: Y[t] = F[t])P(F[t]>Y[t-1])P(F[t]>Y[t-s])P(F[t]>Y[36])
2497073-------
2540284-------
2624421-------
27116346-------
2872120-------
29108751-------
3091738-------
31402216-------
32390070-------
33106045-------
34110070-------
3570668-------
36167841-------
372860740284-53165.0325133733.03250.40330.00370.50.0037
389537124421-69028.0325117870.03250.06840.4650.50.0013
393060511634622896.9675209795.03250.03610.670.50.1401
4013106372120-21329.0325165569.03250.10820.80810.50.0223
418121410875115301.9675202200.03250.28180.31990.50.1076
428545191738-1711.0325185187.03250.44750.58730.50.0552
43455196402216308766.9675495665.03250.133210.51
44454570390070296620.9675483519.03250.08810.0860.51
456311410604512595.9675199494.03250.183900.50.0975
467428711007016620.9675203519.03250.22650.83770.50.1128
474235070668-22781.0325164117.03250.27630.46970.50.0208
4811337516784174391.9675261290.03250.12670.99580.50.5


Univariate ARIMA Extrapolation Forecast Performance
time% S.E.PEMAPESq.EMSERMSE
371.1835-0.2899013635232900
381.95232.90531.597650339025002585127414.550844.1483
390.4098-0.73691.310773515190814173924636.666764605.918
400.66110.81731.187334742772493999012789.7563237.7481
410.4384-0.25321.00057582863693350867505.657886.6781
420.5197-0.06850.8452395263692798977316.166752905.3619
430.11850.13170.743328068804002800106328.142952916.0309
440.12220.16540.67141602500002970124287.12554498.8467
450.4496-0.40480.641418430707612844896117.555653337.5676
460.4332-0.32510.609812804230892688448814.751850.2538
470.6747-0.40070.59088019091242516945206.454550169.1659
480.2841-0.32450.568629665451562554411868.916750541.1898

\begin{tabular}{lllllllll}
\hline
Univariate ARIMA Extrapolation Forecast Performance \tabularnewline
time & % S.E. & PE & MAPE & Sq.E & MSE & RMSE \tabularnewline
37 & 1.1835 & -0.2899 & 0 & 136352329 & 0 & 0 \tabularnewline
38 & 1.9523 & 2.9053 & 1.5976 & 5033902500 & 2585127414.5 & 50844.1483 \tabularnewline
39 & 0.4098 & -0.7369 & 1.3107 & 7351519081 & 4173924636.6667 & 64605.918 \tabularnewline
40 & 0.6611 & 0.8173 & 1.1873 & 3474277249 & 3999012789.75 & 63237.7481 \tabularnewline
41 & 0.4384 & -0.2532 & 1.0005 & 758286369 & 3350867505.6 & 57886.6781 \tabularnewline
42 & 0.5197 & -0.0685 & 0.8452 & 39526369 & 2798977316.1667 & 52905.3619 \tabularnewline
43 & 0.1185 & 0.1317 & 0.7433 & 2806880400 & 2800106328.1429 & 52916.0309 \tabularnewline
44 & 0.1222 & 0.1654 & 0.671 & 4160250000 & 2970124287.125 & 54498.8467 \tabularnewline
45 & 0.4496 & -0.4048 & 0.6414 & 1843070761 & 2844896117.5556 & 53337.5676 \tabularnewline
46 & 0.4332 & -0.3251 & 0.6098 & 1280423089 & 2688448814.7 & 51850.2538 \tabularnewline
47 & 0.6747 & -0.4007 & 0.5908 & 801909124 & 2516945206.4545 & 50169.1659 \tabularnewline
48 & 0.2841 & -0.3245 & 0.5686 & 2966545156 & 2554411868.9167 & 50541.1898 \tabularnewline
\hline
\end{tabular}
%Source: https://freestatistics.org/blog/index.php?pk=113324&T=2

[TABLE]
[ROW][C]Univariate ARIMA Extrapolation Forecast Performance[/C][/ROW]
[ROW][C]time[/C][C]% S.E.[/C][C]PE[/C][C]MAPE[/C][C]Sq.E[/C][C]MSE[/C][C]RMSE[/C][/ROW]
[ROW][C]37[/C][C]1.1835[/C][C]-0.2899[/C][C]0[/C][C]136352329[/C][C]0[/C][C]0[/C][/ROW]
[ROW][C]38[/C][C]1.9523[/C][C]2.9053[/C][C]1.5976[/C][C]5033902500[/C][C]2585127414.5[/C][C]50844.1483[/C][/ROW]
[ROW][C]39[/C][C]0.4098[/C][C]-0.7369[/C][C]1.3107[/C][C]7351519081[/C][C]4173924636.6667[/C][C]64605.918[/C][/ROW]
[ROW][C]40[/C][C]0.6611[/C][C]0.8173[/C][C]1.1873[/C][C]3474277249[/C][C]3999012789.75[/C][C]63237.7481[/C][/ROW]
[ROW][C]41[/C][C]0.4384[/C][C]-0.2532[/C][C]1.0005[/C][C]758286369[/C][C]3350867505.6[/C][C]57886.6781[/C][/ROW]
[ROW][C]42[/C][C]0.5197[/C][C]-0.0685[/C][C]0.8452[/C][C]39526369[/C][C]2798977316.1667[/C][C]52905.3619[/C][/ROW]
[ROW][C]43[/C][C]0.1185[/C][C]0.1317[/C][C]0.7433[/C][C]2806880400[/C][C]2800106328.1429[/C][C]52916.0309[/C][/ROW]
[ROW][C]44[/C][C]0.1222[/C][C]0.1654[/C][C]0.671[/C][C]4160250000[/C][C]2970124287.125[/C][C]54498.8467[/C][/ROW]
[ROW][C]45[/C][C]0.4496[/C][C]-0.4048[/C][C]0.6414[/C][C]1843070761[/C][C]2844896117.5556[/C][C]53337.5676[/C][/ROW]
[ROW][C]46[/C][C]0.4332[/C][C]-0.3251[/C][C]0.6098[/C][C]1280423089[/C][C]2688448814.7[/C][C]51850.2538[/C][/ROW]
[ROW][C]47[/C][C]0.6747[/C][C]-0.4007[/C][C]0.5908[/C][C]801909124[/C][C]2516945206.4545[/C][C]50169.1659[/C][/ROW]
[ROW][C]48[/C][C]0.2841[/C][C]-0.3245[/C][C]0.5686[/C][C]2966545156[/C][C]2554411868.9167[/C][C]50541.1898[/C][/ROW]
[/TABLE]
Source: https://freestatistics.org/blog/index.php?pk=113324&T=2

Globally Unique Identifier (entire table): ba.freestatistics.org/blog/index.php?pk=113324&T=2

As an alternative you can also use a QR Code:  

The GUIDs for individual cells are displayed in the table below:

Univariate ARIMA Extrapolation Forecast Performance
time% S.E.PEMAPESq.EMSERMSE
371.1835-0.2899013635232900
381.95232.90531.597650339025002585127414.550844.1483
390.4098-0.73691.310773515190814173924636.666764605.918
400.66110.81731.187334742772493999012789.7563237.7481
410.4384-0.25321.00057582863693350867505.657886.6781
420.5197-0.06850.8452395263692798977316.166752905.3619
430.11850.13170.743328068804002800106328.142952916.0309
440.12220.16540.67141602500002970124287.12554498.8467
450.4496-0.40480.641418430707612844896117.555653337.5676
460.4332-0.32510.609812804230892688448814.751850.2538
470.6747-0.40070.59088019091242516945206.454550169.1659
480.2841-0.32450.568629665451562554411868.916750541.1898


Parameters (Session):
par1 = 12 ; par2 = 1 ; par3 = 0 ; par4 = 1 ; par5 = 12 ; par6 = 0 ; par7 = 0 ; par8 = 0 ; par9 = 0 ; par10 = FALSE ;
Parameters (R input):
par1 = 12 ; par2 = 1 ; par3 = 0 ; par4 = 1 ; par5 = 12 ; par6 = 0 ; par7 = 0 ; par8 = 0 ; par9 = 0 ; par10 = FALSE ;
R code (references can be found in the software module):
par1 <- as.numeric(par1) #cut off periods
par2 <- as.numeric(par2) #lambda
par3 <- as.numeric(par3) #degree of non-seasonal differencing
par4 <- as.numeric(par4) #degree of seasonal differencing
par5 <- as.numeric(par5) #seasonal period
par6 <- as.numeric(par6) #p
par7 <- as.numeric(par7) #q
par8 <- as.numeric(par8) #P
par9 <- as.numeric(par9) #Q
if (par10 == 'TRUE') par10 <- TRUE
if (par10 == 'FALSE') par10 <- FALSE
if (par2 == 0) x <- log(x)
if (par2 != 0) x <- x^par2
lx <- length(x)
first <- lx - 2*par1
nx <- lx - par1
nx1 <- nx + 1
fx <- lx - nx
if (fx < 1) {
fx <- par5
nx1 <- lx + fx - 1
first <- lx - 2*fx
}
first <- 1
if (fx < 3) fx <- round(lx/10,0)
(arima.out <- arima(x[1:nx], order=c(par6,par3,par7), seasonal=list(order=c(par8,par4,par9), period=par5), include.mean=par10, method='ML'))
(forecast <- predict(arima.out,par1))
(lb <- forecast$pred - 1.96 * forecast$se)
(ub <- forecast$pred + 1.96 * forecast$se)
if (par2 == 0) {
x <- exp(x)
forecast$pred <- exp(forecast$pred)
lb <- exp(lb)
ub <- exp(ub)
}
if (par2 != 0) {
x <- x^(1/par2)
forecast$pred <- forecast$pred^(1/par2)
lb <- lb^(1/par2)
ub <- ub^(1/par2)
}
if (par2 < 0) {
olb <- lb
lb <- ub
ub <- olb
}
(actandfor <- c(x[1:nx], forecast$pred))
(perc.se <- (ub-forecast$pred)/1.96/forecast$pred)
bitmap(file='test1.png')
opar <- par(mar=c(4,4,2,2),las=1)
ylim <- c( min(x[first:nx],lb), max(x[first:nx],ub))
plot(x,ylim=ylim,type='n',xlim=c(first,lx))
usr <- par('usr')
rect(usr[1],usr[3],nx+1,usr[4],border=NA,col='lemonchiffon')
rect(nx1,usr[3],usr[2],usr[4],border=NA,col='lavender')
abline(h= (-3:3)*2 , col ='gray', lty =3)
polygon( c(nx1:lx,lx:nx1), c(lb,rev(ub)), col = 'orange', lty=2,border=NA)
lines(nx1:lx, lb , lty=2)
lines(nx1:lx, ub , lty=2)
lines(x, lwd=2)
lines(nx1:lx, forecast$pred , lwd=2 , col ='white')
box()
par(opar)
dev.off()
prob.dec <- array(NA, dim=fx)
prob.sdec <- array(NA, dim=fx)
prob.ldec <- array(NA, dim=fx)
prob.pval <- array(NA, dim=fx)
perf.pe <- array(0, dim=fx)
perf.mape <- array(0, dim=fx)
perf.mape1 <- array(0, dim=fx)
perf.se <- array(0, dim=fx)
perf.mse <- array(0, dim=fx)
perf.mse1 <- array(0, dim=fx)
perf.rmse <- array(0, dim=fx)
for (i in 1:fx) {
locSD <- (ub[i] - forecast$pred[i]) / 1.96
perf.pe[i] = (x[nx+i] - forecast$pred[i]) / forecast$pred[i]
perf.se[i] = (x[nx+i] - forecast$pred[i])^2
prob.dec[i] = pnorm((x[nx+i-1] - forecast$pred[i]) / locSD)
prob.sdec[i] = pnorm((x[nx+i-par5] - forecast$pred[i]) / locSD)
prob.ldec[i] = pnorm((x[nx] - forecast$pred[i]) / locSD)
prob.pval[i] = pnorm(abs(x[nx+i] - forecast$pred[i]) / locSD)
}
perf.mape[1] = abs(perf.pe[1])
perf.mse[1] = abs(perf.se[1])
for (i in 2:fx) {
perf.mape[i] = perf.mape[i-1] + abs(perf.pe[i])
perf.mape1[i] = perf.mape[i] / i
perf.mse[i] = perf.mse[i-1] + perf.se[i]
perf.mse1[i] = perf.mse[i] / i
}
perf.rmse = sqrt(perf.mse1)
bitmap(file='test2.png')
plot(forecast$pred, pch=19, type='b',main='ARIMA Extrapolation Forecast', ylab='Forecast and 95% CI', xlab='time',ylim=c(min(lb),max(ub)))
dum <- forecast$pred
dum[1:par1] <- x[(nx+1):lx]
lines(dum, lty=1)
lines(ub,lty=3)
lines(lb,lty=3)
dev.off()
load(file='createtable')
a<-table.start()
a<-table.row.start(a)
a<-table.element(a,'Univariate ARIMA Extrapolation Forecast',9,TRUE)
a<-table.row.end(a)
a<-table.row.start(a)
a<-table.element(a,'time',1,header=TRUE)
a<-table.element(a,'Y[t]',1,header=TRUE)
a<-table.element(a,'F[t]',1,header=TRUE)
a<-table.element(a,'95% LB',1,header=TRUE)
a<-table.element(a,'95% UB',1,header=TRUE)
a<-table.element(a,'p-value
(H0: Y[t] = F[t])',1,header=TRUE)
a<-table.element(a,'P(F[t]>Y[t-1])',1,header=TRUE)
a<-table.element(a,'P(F[t]>Y[t-s])',1,header=TRUE)
mylab <- paste('P(F[t]>Y[',nx,sep='')
mylab <- paste(mylab,'])',sep='')
a<-table.element(a,mylab,1,header=TRUE)
a<-table.row.end(a)
for (i in (nx-par5):nx) {
a<-table.row.start(a)
a<-table.element(a,i,header=TRUE)
a<-table.element(a,x[i])
a<-table.element(a,'-')
a<-table.row.end(a)
}
for (i in 1:fx) {
a<-table.row.start(a)
a<-table.element(a,nx+i,header=TRUE)
a<-table.element(a,round(x[nx+i],4))
a<-table.element(a,round(forecast$pred[i],4))
a<-table.element(a,round(lb[i],4))
a<-table.element(a,round(ub[i],4))
a<-table.element(a,round((1-prob.pval[i]),4))
a<-table.element(a,round((1-prob.dec[i]),4))
a<-table.element(a,round((1-prob.sdec[i]),4))
a<-table.element(a,round((1-prob.ldec[i]),4))
a<-table.row.end(a)
}
a<-table.end(a)
table.save(a,file='mytable.tab')
a<-table.start()
a<-table.row.start(a)
a<-table.element(a,'Univariate ARIMA Extrapolation Forecast Performance',7,TRUE)
a<-table.row.end(a)
a<-table.row.start(a)
a<-table.element(a,'time',1,header=TRUE)
a<-table.element(a,'% S.E.',1,header=TRUE)
a<-table.element(a,'PE',1,header=TRUE)
a<-table.element(a,'MAPE',1,header=TRUE)
a<-table.element(a,'Sq.E',1,header=TRUE)
a<-table.element(a,'MSE',1,header=TRUE)
a<-table.element(a,'RMSE',1,header=TRUE)
a<-table.row.end(a)
for (i in 1:fx) {
a<-table.row.start(a)
a<-table.element(a,nx+i,header=TRUE)
a<-table.element(a,round(perc.se[i],4))
a<-table.element(a,round(perf.pe[i],4))
a<-table.element(a,round(perf.mape1[i],4))
a<-table.element(a,round(perf.se[i],4))
a<-table.element(a,round(perf.mse1[i],4))
a<-table.element(a,round(perf.rmse[i],4))
a<-table.row.end(a)
}
a<-table.end(a)
table.save(a,file='mytable1.tab')