Free Statistics

of Irreproducible Research!

Author's title

Author*The author of this computation has been verified*
R Software Modulerwasp_autocorrelation.wasp
Title produced by software(Partial) Autocorrelation Function
Date of computationTue, 21 Dec 2010 07:40:29 +0000
Cite this page as followsStatistical Computations at FreeStatistics.org, Office for Research Development and Education, URL https://freestatistics.org/blog/index.php?v=date/2010/Dec/21/t1292917122b0rjmuug7uvhr1g.htm/, Retrieved Sat, 18 May 2024 12:19:24 +0000
Statistical Computations at FreeStatistics.org, Office for Research Development and Education, URL https://freestatistics.org/blog/index.php?pk=113189, Retrieved Sat, 18 May 2024 12:19:24 +0000
QR Codes:

Original text written by user:
IsPrivate?No (this computation is public)
User-defined keywords
Estimated Impact143
Family? (F = Feedback message, R = changed R code, M = changed R Module, P = changed Parameters, D = changed Data)
-     [(Partial) Autocorrelation Function] [Paper: Partial Au...] [2010-12-19 15:09:48] [48146708a479232c43a8f6e52fbf83b4]
- R  D  [(Partial) Autocorrelation Function] [Paper: Partial au...] [2010-12-19 19:35:13] [48146708a479232c43a8f6e52fbf83b4]
-   P     [(Partial) Autocorrelation Function] [Paper: Partial au...] [2010-12-19 19:55:20] [48146708a479232c43a8f6e52fbf83b4]
-   P         [(Partial) Autocorrelation Function] [Paper: Partial au...] [2010-12-21 07:40:29] [6f3869f9d1e39c73f93153f1f7803f84] [Current]
Feedback Forum

Post a new message
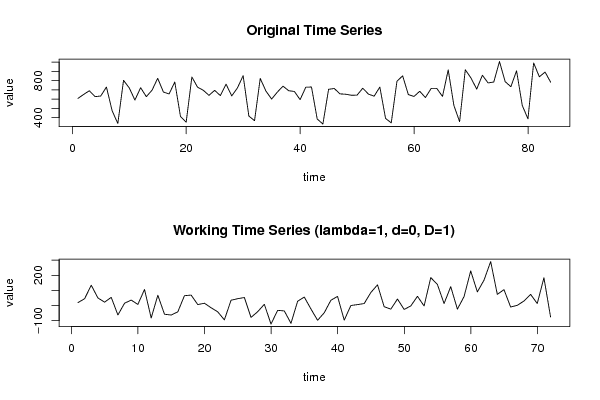
Dataseries X:
608
651
691
627
634
731
475
337
803
722
590
724
627
696
825
677
656
785
412
352
839
729
696
641
695
638
762
635
721
854
418
367
824
687
601
676
740
691
683
594
729
731
386
331
706
715
657
653
642
643
718
654
632
731
392
344
792
852
649
629
685
617
715
715
629
916
531
357
917
828
708
858
775
785
1006
789
734
906
532
387
991
841
892
782


Summary of computational transaction
Raw Inputview raw input (R code)
Raw Outputview raw output of R engine
Computing time2 seconds
R Server'Gwilym Jenkins' @ 72.249.127.135

\begin{tabular}{lllllllll}
\hline
Summary of computational transaction \tabularnewline
Raw Input & view raw input (R code)  \tabularnewline
Raw Output & view raw output of R engine  \tabularnewline
Computing time & 2 seconds \tabularnewline
R Server & 'Gwilym Jenkins' @ 72.249.127.135 \tabularnewline
\hline
\end{tabular}
%Source: https://freestatistics.org/blog/index.php?pk=113189&T=0

[TABLE]
[ROW][C]Summary of computational transaction[/C][/ROW]
[ROW][C]Raw Input[/C][C]view raw input (R code) [/C][/ROW]
[ROW][C]Raw Output[/C][C]view raw output of R engine [/C][/ROW]
[ROW][C]Computing time[/C][C]2 seconds[/C][/ROW]
[ROW][C]R Server[/C][C]'Gwilym Jenkins' @ 72.249.127.135[/C][/ROW]
[/TABLE]
Source: https://freestatistics.org/blog/index.php?pk=113189&T=0

Globally Unique Identifier (entire table): ba.freestatistics.org/blog/index.php?pk=113189&T=0

As an alternative you can also use a QR Code:  

The GUIDs for individual cells are displayed in the table below:

Summary of computational transaction
Raw Inputview raw input (R code)
Raw Outputview raw output of R engine
Computing time2 seconds
R Server'Gwilym Jenkins' @ 72.249.127.135


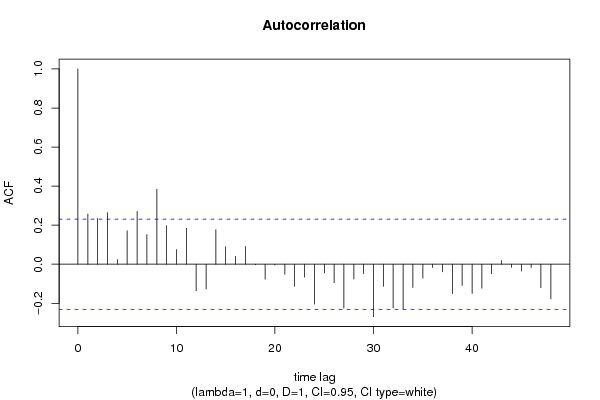
Autocorrelation Function
Time lag kACF(k)T-STATP-value
10.2568342.17930.016291
20.2344341.98920.025237
30.2644072.24360.013969
40.0240130.20380.419558
50.1708931.45010.07569
60.2704662.2950.012325
70.1522011.29150.100336
80.3844743.26240.000845
90.1973191.67430.049204
100.0748320.6350.26373
110.1837531.55920.061668
12-0.136306-1.15660.12563
13-0.126801-1.07590.142773
140.1771991.50360.068531
150.0898660.76250.224114
160.0404840.34350.366106
170.0908820.77120.221568
18-0.002277-0.01930.492318
19-0.076839-0.6520.258239
20-0.003541-0.030.488058
21-0.051827-0.43980.330711
22-0.112971-0.95860.170487
23-0.066053-0.56050.288447
24-0.204-1.7310.043868
25-0.043685-0.37070.355981
26-0.094363-0.80070.212971
27-0.225894-1.91680.029618
28-0.075868-0.64380.260888
29-0.047671-0.40450.343522
30-0.268413-2.27760.012862
31-0.113156-0.96020.170093
32-0.224699-1.90660.030279
33-0.228955-1.94270.027979
34-0.119395-1.01310.157202
35-0.071789-0.60910.272172
36-0.017212-0.1460.442146
37-0.038519-0.32680.372367
38-0.150377-1.2760.103029
39-0.108311-0.9190.18057
40-0.149374-1.26750.104534
41-0.122725-1.04140.150597
42-0.048239-0.40930.34176
430.0193250.1640.435105
44-0.016269-0.1380.445295
45-0.035185-0.29860.38307
46-0.016876-0.14320.443267
47-0.11991-1.01750.156169
48-0.177498-1.50610.068206

\begin{tabular}{lllllllll}
\hline
Autocorrelation Function \tabularnewline
Time lag k & ACF(k) & T-STAT & P-value \tabularnewline
1 & 0.256834 & 2.1793 & 0.016291 \tabularnewline
2 & 0.234434 & 1.9892 & 0.025237 \tabularnewline
3 & 0.264407 & 2.2436 & 0.013969 \tabularnewline
4 & 0.024013 & 0.2038 & 0.419558 \tabularnewline
5 & 0.170893 & 1.4501 & 0.07569 \tabularnewline
6 & 0.270466 & 2.295 & 0.012325 \tabularnewline
7 & 0.152201 & 1.2915 & 0.100336 \tabularnewline
8 & 0.384474 & 3.2624 & 0.000845 \tabularnewline
9 & 0.197319 & 1.6743 & 0.049204 \tabularnewline
10 & 0.074832 & 0.635 & 0.26373 \tabularnewline
11 & 0.183753 & 1.5592 & 0.061668 \tabularnewline
12 & -0.136306 & -1.1566 & 0.12563 \tabularnewline
13 & -0.126801 & -1.0759 & 0.142773 \tabularnewline
14 & 0.177199 & 1.5036 & 0.068531 \tabularnewline
15 & 0.089866 & 0.7625 & 0.224114 \tabularnewline
16 & 0.040484 & 0.3435 & 0.366106 \tabularnewline
17 & 0.090882 & 0.7712 & 0.221568 \tabularnewline
18 & -0.002277 & -0.0193 & 0.492318 \tabularnewline
19 & -0.076839 & -0.652 & 0.258239 \tabularnewline
20 & -0.003541 & -0.03 & 0.488058 \tabularnewline
21 & -0.051827 & -0.4398 & 0.330711 \tabularnewline
22 & -0.112971 & -0.9586 & 0.170487 \tabularnewline
23 & -0.066053 & -0.5605 & 0.288447 \tabularnewline
24 & -0.204 & -1.731 & 0.043868 \tabularnewline
25 & -0.043685 & -0.3707 & 0.355981 \tabularnewline
26 & -0.094363 & -0.8007 & 0.212971 \tabularnewline
27 & -0.225894 & -1.9168 & 0.029618 \tabularnewline
28 & -0.075868 & -0.6438 & 0.260888 \tabularnewline
29 & -0.047671 & -0.4045 & 0.343522 \tabularnewline
30 & -0.268413 & -2.2776 & 0.012862 \tabularnewline
31 & -0.113156 & -0.9602 & 0.170093 \tabularnewline
32 & -0.224699 & -1.9066 & 0.030279 \tabularnewline
33 & -0.228955 & -1.9427 & 0.027979 \tabularnewline
34 & -0.119395 & -1.0131 & 0.157202 \tabularnewline
35 & -0.071789 & -0.6091 & 0.272172 \tabularnewline
36 & -0.017212 & -0.146 & 0.442146 \tabularnewline
37 & -0.038519 & -0.3268 & 0.372367 \tabularnewline
38 & -0.150377 & -1.276 & 0.103029 \tabularnewline
39 & -0.108311 & -0.919 & 0.18057 \tabularnewline
40 & -0.149374 & -1.2675 & 0.104534 \tabularnewline
41 & -0.122725 & -1.0414 & 0.150597 \tabularnewline
42 & -0.048239 & -0.4093 & 0.34176 \tabularnewline
43 & 0.019325 & 0.164 & 0.435105 \tabularnewline
44 & -0.016269 & -0.138 & 0.445295 \tabularnewline
45 & -0.035185 & -0.2986 & 0.38307 \tabularnewline
46 & -0.016876 & -0.1432 & 0.443267 \tabularnewline
47 & -0.11991 & -1.0175 & 0.156169 \tabularnewline
48 & -0.177498 & -1.5061 & 0.068206 \tabularnewline
\hline
\end{tabular}
%Source: https://freestatistics.org/blog/index.php?pk=113189&T=1

[TABLE]
[ROW][C]Autocorrelation Function[/C][/ROW]
[ROW][C]Time lag k[/C][C]ACF(k)[/C][C]T-STAT[/C][C]P-value[/C][/ROW]
[ROW][C]1[/C][C]0.256834[/C][C]2.1793[/C][C]0.016291[/C][/ROW]
[ROW][C]2[/C][C]0.234434[/C][C]1.9892[/C][C]0.025237[/C][/ROW]
[ROW][C]3[/C][C]0.264407[/C][C]2.2436[/C][C]0.013969[/C][/ROW]
[ROW][C]4[/C][C]0.024013[/C][C]0.2038[/C][C]0.419558[/C][/ROW]
[ROW][C]5[/C][C]0.170893[/C][C]1.4501[/C][C]0.07569[/C][/ROW]
[ROW][C]6[/C][C]0.270466[/C][C]2.295[/C][C]0.012325[/C][/ROW]
[ROW][C]7[/C][C]0.152201[/C][C]1.2915[/C][C]0.100336[/C][/ROW]
[ROW][C]8[/C][C]0.384474[/C][C]3.2624[/C][C]0.000845[/C][/ROW]
[ROW][C]9[/C][C]0.197319[/C][C]1.6743[/C][C]0.049204[/C][/ROW]
[ROW][C]10[/C][C]0.074832[/C][C]0.635[/C][C]0.26373[/C][/ROW]
[ROW][C]11[/C][C]0.183753[/C][C]1.5592[/C][C]0.061668[/C][/ROW]
[ROW][C]12[/C][C]-0.136306[/C][C]-1.1566[/C][C]0.12563[/C][/ROW]
[ROW][C]13[/C][C]-0.126801[/C][C]-1.0759[/C][C]0.142773[/C][/ROW]
[ROW][C]14[/C][C]0.177199[/C][C]1.5036[/C][C]0.068531[/C][/ROW]
[ROW][C]15[/C][C]0.089866[/C][C]0.7625[/C][C]0.224114[/C][/ROW]
[ROW][C]16[/C][C]0.040484[/C][C]0.3435[/C][C]0.366106[/C][/ROW]
[ROW][C]17[/C][C]0.090882[/C][C]0.7712[/C][C]0.221568[/C][/ROW]
[ROW][C]18[/C][C]-0.002277[/C][C]-0.0193[/C][C]0.492318[/C][/ROW]
[ROW][C]19[/C][C]-0.076839[/C][C]-0.652[/C][C]0.258239[/C][/ROW]
[ROW][C]20[/C][C]-0.003541[/C][C]-0.03[/C][C]0.488058[/C][/ROW]
[ROW][C]21[/C][C]-0.051827[/C][C]-0.4398[/C][C]0.330711[/C][/ROW]
[ROW][C]22[/C][C]-0.112971[/C][C]-0.9586[/C][C]0.170487[/C][/ROW]
[ROW][C]23[/C][C]-0.066053[/C][C]-0.5605[/C][C]0.288447[/C][/ROW]
[ROW][C]24[/C][C]-0.204[/C][C]-1.731[/C][C]0.043868[/C][/ROW]
[ROW][C]25[/C][C]-0.043685[/C][C]-0.3707[/C][C]0.355981[/C][/ROW]
[ROW][C]26[/C][C]-0.094363[/C][C]-0.8007[/C][C]0.212971[/C][/ROW]
[ROW][C]27[/C][C]-0.225894[/C][C]-1.9168[/C][C]0.029618[/C][/ROW]
[ROW][C]28[/C][C]-0.075868[/C][C]-0.6438[/C][C]0.260888[/C][/ROW]
[ROW][C]29[/C][C]-0.047671[/C][C]-0.4045[/C][C]0.343522[/C][/ROW]
[ROW][C]30[/C][C]-0.268413[/C][C]-2.2776[/C][C]0.012862[/C][/ROW]
[ROW][C]31[/C][C]-0.113156[/C][C]-0.9602[/C][C]0.170093[/C][/ROW]
[ROW][C]32[/C][C]-0.224699[/C][C]-1.9066[/C][C]0.030279[/C][/ROW]
[ROW][C]33[/C][C]-0.228955[/C][C]-1.9427[/C][C]0.027979[/C][/ROW]
[ROW][C]34[/C][C]-0.119395[/C][C]-1.0131[/C][C]0.157202[/C][/ROW]
[ROW][C]35[/C][C]-0.071789[/C][C]-0.6091[/C][C]0.272172[/C][/ROW]
[ROW][C]36[/C][C]-0.017212[/C][C]-0.146[/C][C]0.442146[/C][/ROW]
[ROW][C]37[/C][C]-0.038519[/C][C]-0.3268[/C][C]0.372367[/C][/ROW]
[ROW][C]38[/C][C]-0.150377[/C][C]-1.276[/C][C]0.103029[/C][/ROW]
[ROW][C]39[/C][C]-0.108311[/C][C]-0.919[/C][C]0.18057[/C][/ROW]
[ROW][C]40[/C][C]-0.149374[/C][C]-1.2675[/C][C]0.104534[/C][/ROW]
[ROW][C]41[/C][C]-0.122725[/C][C]-1.0414[/C][C]0.150597[/C][/ROW]
[ROW][C]42[/C][C]-0.048239[/C][C]-0.4093[/C][C]0.34176[/C][/ROW]
[ROW][C]43[/C][C]0.019325[/C][C]0.164[/C][C]0.435105[/C][/ROW]
[ROW][C]44[/C][C]-0.016269[/C][C]-0.138[/C][C]0.445295[/C][/ROW]
[ROW][C]45[/C][C]-0.035185[/C][C]-0.2986[/C][C]0.38307[/C][/ROW]
[ROW][C]46[/C][C]-0.016876[/C][C]-0.1432[/C][C]0.443267[/C][/ROW]
[ROW][C]47[/C][C]-0.11991[/C][C]-1.0175[/C][C]0.156169[/C][/ROW]
[ROW][C]48[/C][C]-0.177498[/C][C]-1.5061[/C][C]0.068206[/C][/ROW]
[/TABLE]
Source: https://freestatistics.org/blog/index.php?pk=113189&T=1

Globally Unique Identifier (entire table): ba.freestatistics.org/blog/index.php?pk=113189&T=1

As an alternative you can also use a QR Code:  

The GUIDs for individual cells are displayed in the table below:

Autocorrelation Function
Time lag kACF(k)T-STATP-value
10.2568342.17930.016291
20.2344341.98920.025237
30.2644072.24360.013969
40.0240130.20380.419558
50.1708931.45010.07569
60.2704662.2950.012325
70.1522011.29150.100336
80.3844743.26240.000845
90.1973191.67430.049204
100.0748320.6350.26373
110.1837531.55920.061668
12-0.136306-1.15660.12563
13-0.126801-1.07590.142773
140.1771991.50360.068531
150.0898660.76250.224114
160.0404840.34350.366106
170.0908820.77120.221568
18-0.002277-0.01930.492318
19-0.076839-0.6520.258239
20-0.003541-0.030.488058
21-0.051827-0.43980.330711
22-0.112971-0.95860.170487
23-0.066053-0.56050.288447
24-0.204-1.7310.043868
25-0.043685-0.37070.355981
26-0.094363-0.80070.212971
27-0.225894-1.91680.029618
28-0.075868-0.64380.260888
29-0.047671-0.40450.343522
30-0.268413-2.27760.012862
31-0.113156-0.96020.170093
32-0.224699-1.90660.030279
33-0.228955-1.94270.027979
34-0.119395-1.01310.157202
35-0.071789-0.60910.272172
36-0.017212-0.1460.442146
37-0.038519-0.32680.372367
38-0.150377-1.2760.103029
39-0.108311-0.9190.18057
40-0.149374-1.26750.104534
41-0.122725-1.04140.150597
42-0.048239-0.40930.34176
430.0193250.1640.435105
44-0.016269-0.1380.445295
45-0.035185-0.29860.38307
46-0.016876-0.14320.443267
47-0.11991-1.01750.156169
48-0.177498-1.50610.068206


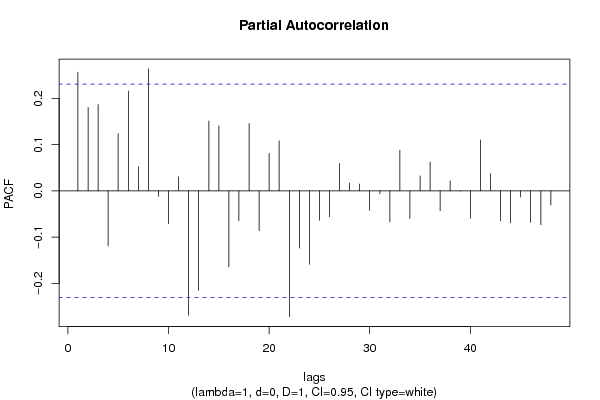
Partial Autocorrelation Function
Time lag kPACF(k)T-STATP-value
10.2568342.17930.016291
20.1803681.53050.06514
30.1867221.58440.058744
4-0.118981-1.00960.158038
50.1235521.04840.148987
60.2160391.83310.035457
70.0521120.44220.32984
80.2637112.23770.014169
9-0.011915-0.10110.459874
10-0.071047-0.60290.274249
110.0303050.25710.398899
12-0.269227-2.28450.012647
13-0.215698-1.83030.035675
140.1510431.28160.102039
150.140281.19030.118917
16-0.164249-1.39370.083848
17-0.064896-0.55070.291786
180.1456541.23590.110253
19-0.086116-0.73070.233661
200.0808660.68620.247406
210.1083830.91970.180411
22-0.272151-2.30930.0119
23-0.123873-1.05110.148365
24-0.158874-1.34810.090928
25-0.063578-0.53950.295612
26-0.055987-0.47510.318089
270.0593270.50340.308106
280.0169320.14370.44308
290.014630.12410.450776
30-0.042038-0.35670.361177
31-0.006374-0.05410.478508
32-0.067102-0.56940.285437
330.087990.74660.228863
34-0.059806-0.50750.306688
350.0322110.27330.392696
360.0625460.53070.298623
37-0.042892-0.3640.358481
380.0215860.18320.427594
39-0.000421-0.00360.498581
40-0.05921-0.50240.308455
410.1098170.93180.177269
420.0371080.31490.376883
43-0.065071-0.55210.291278
44-0.069068-0.58610.279834
45-0.013465-0.11430.454676
46-0.06797-0.57670.282957
47-0.073086-0.62020.268556
48-0.030861-0.26190.397085

\begin{tabular}{lllllllll}
\hline
Partial Autocorrelation Function \tabularnewline
Time lag k & PACF(k) & T-STAT & P-value \tabularnewline
1 & 0.256834 & 2.1793 & 0.016291 \tabularnewline
2 & 0.180368 & 1.5305 & 0.06514 \tabularnewline
3 & 0.186722 & 1.5844 & 0.058744 \tabularnewline
4 & -0.118981 & -1.0096 & 0.158038 \tabularnewline
5 & 0.123552 & 1.0484 & 0.148987 \tabularnewline
6 & 0.216039 & 1.8331 & 0.035457 \tabularnewline
7 & 0.052112 & 0.4422 & 0.32984 \tabularnewline
8 & 0.263711 & 2.2377 & 0.014169 \tabularnewline
9 & -0.011915 & -0.1011 & 0.459874 \tabularnewline
10 & -0.071047 & -0.6029 & 0.274249 \tabularnewline
11 & 0.030305 & 0.2571 & 0.398899 \tabularnewline
12 & -0.269227 & -2.2845 & 0.012647 \tabularnewline
13 & -0.215698 & -1.8303 & 0.035675 \tabularnewline
14 & 0.151043 & 1.2816 & 0.102039 \tabularnewline
15 & 0.14028 & 1.1903 & 0.118917 \tabularnewline
16 & -0.164249 & -1.3937 & 0.083848 \tabularnewline
17 & -0.064896 & -0.5507 & 0.291786 \tabularnewline
18 & 0.145654 & 1.2359 & 0.110253 \tabularnewline
19 & -0.086116 & -0.7307 & 0.233661 \tabularnewline
20 & 0.080866 & 0.6862 & 0.247406 \tabularnewline
21 & 0.108383 & 0.9197 & 0.180411 \tabularnewline
22 & -0.272151 & -2.3093 & 0.0119 \tabularnewline
23 & -0.123873 & -1.0511 & 0.148365 \tabularnewline
24 & -0.158874 & -1.3481 & 0.090928 \tabularnewline
25 & -0.063578 & -0.5395 & 0.295612 \tabularnewline
26 & -0.055987 & -0.4751 & 0.318089 \tabularnewline
27 & 0.059327 & 0.5034 & 0.308106 \tabularnewline
28 & 0.016932 & 0.1437 & 0.44308 \tabularnewline
29 & 0.01463 & 0.1241 & 0.450776 \tabularnewline
30 & -0.042038 & -0.3567 & 0.361177 \tabularnewline
31 & -0.006374 & -0.0541 & 0.478508 \tabularnewline
32 & -0.067102 & -0.5694 & 0.285437 \tabularnewline
33 & 0.08799 & 0.7466 & 0.228863 \tabularnewline
34 & -0.059806 & -0.5075 & 0.306688 \tabularnewline
35 & 0.032211 & 0.2733 & 0.392696 \tabularnewline
36 & 0.062546 & 0.5307 & 0.298623 \tabularnewline
37 & -0.042892 & -0.364 & 0.358481 \tabularnewline
38 & 0.021586 & 0.1832 & 0.427594 \tabularnewline
39 & -0.000421 & -0.0036 & 0.498581 \tabularnewline
40 & -0.05921 & -0.5024 & 0.308455 \tabularnewline
41 & 0.109817 & 0.9318 & 0.177269 \tabularnewline
42 & 0.037108 & 0.3149 & 0.376883 \tabularnewline
43 & -0.065071 & -0.5521 & 0.291278 \tabularnewline
44 & -0.069068 & -0.5861 & 0.279834 \tabularnewline
45 & -0.013465 & -0.1143 & 0.454676 \tabularnewline
46 & -0.06797 & -0.5767 & 0.282957 \tabularnewline
47 & -0.073086 & -0.6202 & 0.268556 \tabularnewline
48 & -0.030861 & -0.2619 & 0.397085 \tabularnewline
\hline
\end{tabular}
%Source: https://freestatistics.org/blog/index.php?pk=113189&T=2

[TABLE]
[ROW][C]Partial Autocorrelation Function[/C][/ROW]
[ROW][C]Time lag k[/C][C]PACF(k)[/C][C]T-STAT[/C][C]P-value[/C][/ROW]
[ROW][C]1[/C][C]0.256834[/C][C]2.1793[/C][C]0.016291[/C][/ROW]
[ROW][C]2[/C][C]0.180368[/C][C]1.5305[/C][C]0.06514[/C][/ROW]
[ROW][C]3[/C][C]0.186722[/C][C]1.5844[/C][C]0.058744[/C][/ROW]
[ROW][C]4[/C][C]-0.118981[/C][C]-1.0096[/C][C]0.158038[/C][/ROW]
[ROW][C]5[/C][C]0.123552[/C][C]1.0484[/C][C]0.148987[/C][/ROW]
[ROW][C]6[/C][C]0.216039[/C][C]1.8331[/C][C]0.035457[/C][/ROW]
[ROW][C]7[/C][C]0.052112[/C][C]0.4422[/C][C]0.32984[/C][/ROW]
[ROW][C]8[/C][C]0.263711[/C][C]2.2377[/C][C]0.014169[/C][/ROW]
[ROW][C]9[/C][C]-0.011915[/C][C]-0.1011[/C][C]0.459874[/C][/ROW]
[ROW][C]10[/C][C]-0.071047[/C][C]-0.6029[/C][C]0.274249[/C][/ROW]
[ROW][C]11[/C][C]0.030305[/C][C]0.2571[/C][C]0.398899[/C][/ROW]
[ROW][C]12[/C][C]-0.269227[/C][C]-2.2845[/C][C]0.012647[/C][/ROW]
[ROW][C]13[/C][C]-0.215698[/C][C]-1.8303[/C][C]0.035675[/C][/ROW]
[ROW][C]14[/C][C]0.151043[/C][C]1.2816[/C][C]0.102039[/C][/ROW]
[ROW][C]15[/C][C]0.14028[/C][C]1.1903[/C][C]0.118917[/C][/ROW]
[ROW][C]16[/C][C]-0.164249[/C][C]-1.3937[/C][C]0.083848[/C][/ROW]
[ROW][C]17[/C][C]-0.064896[/C][C]-0.5507[/C][C]0.291786[/C][/ROW]
[ROW][C]18[/C][C]0.145654[/C][C]1.2359[/C][C]0.110253[/C][/ROW]
[ROW][C]19[/C][C]-0.086116[/C][C]-0.7307[/C][C]0.233661[/C][/ROW]
[ROW][C]20[/C][C]0.080866[/C][C]0.6862[/C][C]0.247406[/C][/ROW]
[ROW][C]21[/C][C]0.108383[/C][C]0.9197[/C][C]0.180411[/C][/ROW]
[ROW][C]22[/C][C]-0.272151[/C][C]-2.3093[/C][C]0.0119[/C][/ROW]
[ROW][C]23[/C][C]-0.123873[/C][C]-1.0511[/C][C]0.148365[/C][/ROW]
[ROW][C]24[/C][C]-0.158874[/C][C]-1.3481[/C][C]0.090928[/C][/ROW]
[ROW][C]25[/C][C]-0.063578[/C][C]-0.5395[/C][C]0.295612[/C][/ROW]
[ROW][C]26[/C][C]-0.055987[/C][C]-0.4751[/C][C]0.318089[/C][/ROW]
[ROW][C]27[/C][C]0.059327[/C][C]0.5034[/C][C]0.308106[/C][/ROW]
[ROW][C]28[/C][C]0.016932[/C][C]0.1437[/C][C]0.44308[/C][/ROW]
[ROW][C]29[/C][C]0.01463[/C][C]0.1241[/C][C]0.450776[/C][/ROW]
[ROW][C]30[/C][C]-0.042038[/C][C]-0.3567[/C][C]0.361177[/C][/ROW]
[ROW][C]31[/C][C]-0.006374[/C][C]-0.0541[/C][C]0.478508[/C][/ROW]
[ROW][C]32[/C][C]-0.067102[/C][C]-0.5694[/C][C]0.285437[/C][/ROW]
[ROW][C]33[/C][C]0.08799[/C][C]0.7466[/C][C]0.228863[/C][/ROW]
[ROW][C]34[/C][C]-0.059806[/C][C]-0.5075[/C][C]0.306688[/C][/ROW]
[ROW][C]35[/C][C]0.032211[/C][C]0.2733[/C][C]0.392696[/C][/ROW]
[ROW][C]36[/C][C]0.062546[/C][C]0.5307[/C][C]0.298623[/C][/ROW]
[ROW][C]37[/C][C]-0.042892[/C][C]-0.364[/C][C]0.358481[/C][/ROW]
[ROW][C]38[/C][C]0.021586[/C][C]0.1832[/C][C]0.427594[/C][/ROW]
[ROW][C]39[/C][C]-0.000421[/C][C]-0.0036[/C][C]0.498581[/C][/ROW]
[ROW][C]40[/C][C]-0.05921[/C][C]-0.5024[/C][C]0.308455[/C][/ROW]
[ROW][C]41[/C][C]0.109817[/C][C]0.9318[/C][C]0.177269[/C][/ROW]
[ROW][C]42[/C][C]0.037108[/C][C]0.3149[/C][C]0.376883[/C][/ROW]
[ROW][C]43[/C][C]-0.065071[/C][C]-0.5521[/C][C]0.291278[/C][/ROW]
[ROW][C]44[/C][C]-0.069068[/C][C]-0.5861[/C][C]0.279834[/C][/ROW]
[ROW][C]45[/C][C]-0.013465[/C][C]-0.1143[/C][C]0.454676[/C][/ROW]
[ROW][C]46[/C][C]-0.06797[/C][C]-0.5767[/C][C]0.282957[/C][/ROW]
[ROW][C]47[/C][C]-0.073086[/C][C]-0.6202[/C][C]0.268556[/C][/ROW]
[ROW][C]48[/C][C]-0.030861[/C][C]-0.2619[/C][C]0.397085[/C][/ROW]
[/TABLE]
Source: https://freestatistics.org/blog/index.php?pk=113189&T=2

Globally Unique Identifier (entire table): ba.freestatistics.org/blog/index.php?pk=113189&T=2

As an alternative you can also use a QR Code:  

The GUIDs for individual cells are displayed in the table below:

Partial Autocorrelation Function
Time lag kPACF(k)T-STATP-value
10.2568342.17930.016291
20.1803681.53050.06514
30.1867221.58440.058744
4-0.118981-1.00960.158038
50.1235521.04840.148987
60.2160391.83310.035457
70.0521120.44220.32984
80.2637112.23770.014169
9-0.011915-0.10110.459874
10-0.071047-0.60290.274249
110.0303050.25710.398899
12-0.269227-2.28450.012647
13-0.215698-1.83030.035675
140.1510431.28160.102039
150.140281.19030.118917
16-0.164249-1.39370.083848
17-0.064896-0.55070.291786
180.1456541.23590.110253
19-0.086116-0.73070.233661
200.0808660.68620.247406
210.1083830.91970.180411
22-0.272151-2.30930.0119
23-0.123873-1.05110.148365
24-0.158874-1.34810.090928
25-0.063578-0.53950.295612
26-0.055987-0.47510.318089
270.0593270.50340.308106
280.0169320.14370.44308
290.014630.12410.450776
30-0.042038-0.35670.361177
31-0.006374-0.05410.478508
32-0.067102-0.56940.285437
330.087990.74660.228863
34-0.059806-0.50750.306688
350.0322110.27330.392696
360.0625460.53070.298623
37-0.042892-0.3640.358481
380.0215860.18320.427594
39-0.000421-0.00360.498581
40-0.05921-0.50240.308455
410.1098170.93180.177269
420.0371080.31490.376883
43-0.065071-0.55210.291278
44-0.069068-0.58610.279834
45-0.013465-0.11430.454676
46-0.06797-0.57670.282957
47-0.073086-0.62020.268556
48-0.030861-0.26190.397085


Parameters (Session):
par1 = 48 ; par2 = 1 ; par3 = 0 ; par4 = 1 ; par5 = 12 ; par6 = White Noise ; par7 = 0.95 ;
Parameters (R input):
par1 = 48 ; par2 = 1 ; par3 = 0 ; par4 = 1 ; par5 = 12 ; par6 = White Noise ; par7 = 0.95 ; par8 = ;
R code (references can be found in the software module):
if (par1 == 'Default') {
par1 = 10*log10(length(x))
} else {
par1 <- as.numeric(par1)
}
par2 <- as.numeric(par2)
par3 <- as.numeric(par3)
par4 <- as.numeric(par4)
par5 <- as.numeric(par5)
if (par6 == 'White Noise') par6 <- 'white' else par6 <- 'ma'
par7 <- as.numeric(par7)
if (par8 != '') par8 <- as.numeric(par8)
ox <- x
if (par8 == '') {
if (par2 == 0) {
x <- log(x)
} else {
x <- (x ^ par2 - 1) / par2
}
} else {
x <- log(x,base=par8)
}
if (par3 > 0) x <- diff(x,lag=1,difference=par3)
if (par4 > 0) x <- diff(x,lag=par5,difference=par4)
bitmap(file='picts.png')
op <- par(mfrow=c(2,1))
plot(ox,type='l',main='Original Time Series',xlab='time',ylab='value')
if (par8=='') {
mytitle <- paste('Working Time Series (lambda=',par2,', d=',par3,', D=',par4,')',sep='')
mysub <- paste('(lambda=',par2,', d=',par3,', D=',par4,', CI=', par7, ', CI type=',par6,')',sep='')
} else {
mytitle <- paste('Working Time Series (base=',par8,', d=',par3,', D=',par4,')',sep='')
mysub <- paste('(base=',par8,', d=',par3,', D=',par4,', CI=', par7, ', CI type=',par6,')',sep='')
}
plot(x,type='l', main=mytitle,xlab='time',ylab='value')
par(op)
dev.off()
bitmap(file='pic1.png')
racf <- acf(x, par1, main='Autocorrelation', xlab='time lag', ylab='ACF', ci.type=par6, ci=par7, sub=mysub)
dev.off()
bitmap(file='pic2.png')
rpacf <- pacf(x,par1,main='Partial Autocorrelation',xlab='lags',ylab='PACF',sub=mysub)
dev.off()
(myacf <- c(racf$acf))
(mypacf <- c(rpacf$acf))
lengthx <- length(x)
sqrtn <- sqrt(lengthx)
load(file='createtable')
a<-table.start()
a<-table.row.start(a)
a<-table.element(a,'Autocorrelation Function',4,TRUE)
a<-table.row.end(a)
a<-table.row.start(a)
a<-table.element(a,'Time lag k',header=TRUE)
a<-table.element(a,hyperlink('basics.htm','ACF(k)','click here for more information about the Autocorrelation Function'),header=TRUE)
a<-table.element(a,'T-STAT',header=TRUE)
a<-table.element(a,'P-value',header=TRUE)
a<-table.row.end(a)
for (i in 2:(par1+1)) {
a<-table.row.start(a)
a<-table.element(a,i-1,header=TRUE)
a<-table.element(a,round(myacf[i],6))
mytstat <- myacf[i]*sqrtn
a<-table.element(a,round(mytstat,4))
a<-table.element(a,round(1-pt(abs(mytstat),lengthx),6))
a<-table.row.end(a)
}
a<-table.end(a)
table.save(a,file='mytable.tab')
a<-table.start()
a<-table.row.start(a)
a<-table.element(a,'Partial Autocorrelation Function',4,TRUE)
a<-table.row.end(a)
a<-table.row.start(a)
a<-table.element(a,'Time lag k',header=TRUE)
a<-table.element(a,hyperlink('basics.htm','PACF(k)','click here for more information about the Partial Autocorrelation Function'),header=TRUE)
a<-table.element(a,'T-STAT',header=TRUE)
a<-table.element(a,'P-value',header=TRUE)
a<-table.row.end(a)
for (i in 1:par1) {
a<-table.row.start(a)
a<-table.element(a,i,header=TRUE)
a<-table.element(a,round(mypacf[i],6))
mytstat <- mypacf[i]*sqrtn
a<-table.element(a,round(mytstat,4))
a<-table.element(a,round(1-pt(abs(mytstat),lengthx),6))
a<-table.row.end(a)
}
a<-table.end(a)
table.save(a,file='mytable1.tab')