Free Statistics

of Irreproducible Research!

Author's title

Author*The author of this computation has been verified*
R Software Modulerwasp_autocorrelation.wasp
Title produced by software(Partial) Autocorrelation Function
Date of computationMon, 20 Dec 2010 08:33:51 +0000
Cite this page as followsStatistical Computations at FreeStatistics.org, Office for Research Development and Education, URL https://freestatistics.org/blog/index.php?v=date/2010/Dec/20/t1292833958wkzkj3aihvz8b39.htm/, Retrieved Thu, 23 May 2024 09:56:04 +0000
Statistical Computations at FreeStatistics.org, Office for Research Development and Education, URL https://freestatistics.org/blog/index.php?pk=112803, Retrieved Thu, 23 May 2024 09:56:04 +0000
QR Codes:

Original text written by user:
IsPrivate?No (this computation is public)
User-defined keywords
Estimated Impact140
Family? (F = Feedback message, R = changed R code, M = changed R Module, P = changed Parameters, D = changed Data)
-       [(Partial) Autocorrelation Function] [ACF ( d=1 , D=0 )] [2010-12-20 08:33:51] [19046f4a6967f3fb6f5f17d42e7d38f2] [Current]
Feedback Forum

Post a new message
Dataseries X:
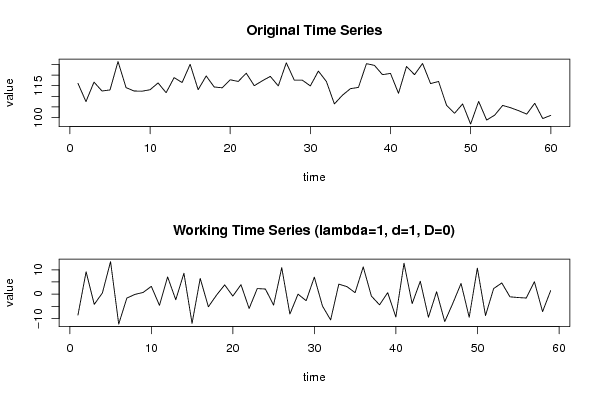
116.1
107.5
116.7
112.5
113
126.4
114.1
112.5
112.4
113.1
116.3
111.7
118.8
116.5
125.1
113.1
119.6
114.4
114
117.8
117
120.9
115
117.3
119.4
114.9
125.8
117.6
117.6
114.9
121.9
117
106.4
110.5
113.6
114.2
125.4
124.6
120.2
120.8
111.4
124.1
120.2
125.5
116
117
105.7
102
106.4
96.9
107.6
98.8
101.1
105.7
104.6
103.2
101.6
106.7
99.5
101


Summary of computational transaction
Raw Inputview raw input (R code)
Raw Outputview raw output of R engine
Computing time2 seconds
R Server'Gwilym Jenkins' @ 72.249.127.135

\begin{tabular}{lllllllll}
\hline
Summary of computational transaction \tabularnewline
Raw Input & view raw input (R code)  \tabularnewline
Raw Output & view raw output of R engine  \tabularnewline
Computing time & 2 seconds \tabularnewline
R Server & 'Gwilym Jenkins' @ 72.249.127.135 \tabularnewline
\hline
\end{tabular}
%Source: https://freestatistics.org/blog/index.php?pk=112803&T=0

[TABLE]
[ROW][C]Summary of computational transaction[/C][/ROW]
[ROW][C]Raw Input[/C][C]view raw input (R code) [/C][/ROW]
[ROW][C]Raw Output[/C][C]view raw output of R engine [/C][/ROW]
[ROW][C]Computing time[/C][C]2 seconds[/C][/ROW]
[ROW][C]R Server[/C][C]'Gwilym Jenkins' @ 72.249.127.135[/C][/ROW]
[/TABLE]
Source: https://freestatistics.org/blog/index.php?pk=112803&T=0

Globally Unique Identifier (entire table): ba.freestatistics.org/blog/index.php?pk=112803&T=0

As an alternative you can also use a QR Code:  

The GUIDs for individual cells are displayed in the table below:

Summary of computational transaction
Raw Inputview raw input (R code)
Raw Outputview raw output of R engine
Computing time2 seconds
R Server'Gwilym Jenkins' @ 72.249.127.135


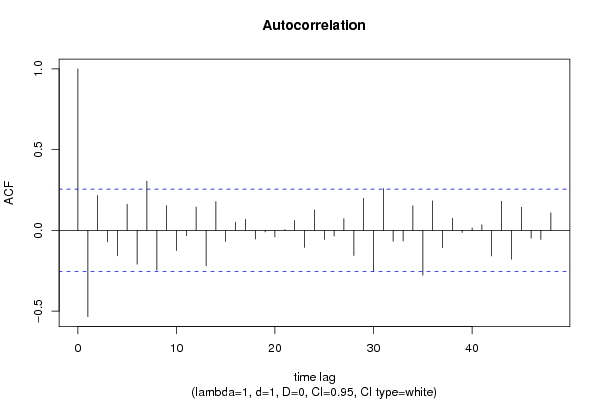
Autocorrelation Function
Time lag kACF(k)T-STATP-value
1-0.534454-4.10526.3e-05
20.2163461.66180.05093
3-0.071152-0.54650.293382
4-0.15774-1.21160.115244
50.1619891.24430.109161
6-0.209132-1.60640.056766
70.3044222.33830.01139
8-0.246797-1.89570.031452
90.1537231.18080.121216
10-0.12481-0.95870.170815
11-0.033488-0.25720.39895
120.1443521.10880.136011
13-0.219648-1.68720.048427
140.1786661.37240.087574
15-0.069613-0.53470.297431
160.0504750.38770.349813
170.0689770.52980.299112
18-0.052686-0.40470.343586
19-0.009978-0.07660.469585
20-0.040436-0.31060.378601
210.0052320.04020.484041
220.0606890.46620.321409
23-0.106058-0.81470.209274
240.126350.97050.167877
25-0.055141-0.42350.336719
26-0.035414-0.2720.393278
270.0728170.55930.28903
28-0.155335-1.19310.118793
290.1989281.5280.065929
30-0.252039-1.93590.028835
310.2592941.99170.025521
32-0.067882-0.52140.302017
33-0.065695-0.50460.307855
340.1525451.17170.12301
35-0.277317-2.13010.018671
360.1827841.4040.082782
37-0.107136-0.82290.206932
380.0753610.57890.282443
39-0.012525-0.09620.461841
400.0152420.11710.4536
410.0350740.26940.394278
42-0.158403-1.21670.114279
430.1811641.39150.084642
44-0.178522-1.37120.087745
450.1436261.10320.137207
46-0.048763-0.37460.354666
47-0.056044-0.43050.334206
480.1085070.83350.203975

\begin{tabular}{lllllllll}
\hline
Autocorrelation Function \tabularnewline
Time lag k & ACF(k) & T-STAT & P-value \tabularnewline
1 & -0.534454 & -4.1052 & 6.3e-05 \tabularnewline
2 & 0.216346 & 1.6618 & 0.05093 \tabularnewline
3 & -0.071152 & -0.5465 & 0.293382 \tabularnewline
4 & -0.15774 & -1.2116 & 0.115244 \tabularnewline
5 & 0.161989 & 1.2443 & 0.109161 \tabularnewline
6 & -0.209132 & -1.6064 & 0.056766 \tabularnewline
7 & 0.304422 & 2.3383 & 0.01139 \tabularnewline
8 & -0.246797 & -1.8957 & 0.031452 \tabularnewline
9 & 0.153723 & 1.1808 & 0.121216 \tabularnewline
10 & -0.12481 & -0.9587 & 0.170815 \tabularnewline
11 & -0.033488 & -0.2572 & 0.39895 \tabularnewline
12 & 0.144352 & 1.1088 & 0.136011 \tabularnewline
13 & -0.219648 & -1.6872 & 0.048427 \tabularnewline
14 & 0.178666 & 1.3724 & 0.087574 \tabularnewline
15 & -0.069613 & -0.5347 & 0.297431 \tabularnewline
16 & 0.050475 & 0.3877 & 0.349813 \tabularnewline
17 & 0.068977 & 0.5298 & 0.299112 \tabularnewline
18 & -0.052686 & -0.4047 & 0.343586 \tabularnewline
19 & -0.009978 & -0.0766 & 0.469585 \tabularnewline
20 & -0.040436 & -0.3106 & 0.378601 \tabularnewline
21 & 0.005232 & 0.0402 & 0.484041 \tabularnewline
22 & 0.060689 & 0.4662 & 0.321409 \tabularnewline
23 & -0.106058 & -0.8147 & 0.209274 \tabularnewline
24 & 0.12635 & 0.9705 & 0.167877 \tabularnewline
25 & -0.055141 & -0.4235 & 0.336719 \tabularnewline
26 & -0.035414 & -0.272 & 0.393278 \tabularnewline
27 & 0.072817 & 0.5593 & 0.28903 \tabularnewline
28 & -0.155335 & -1.1931 & 0.118793 \tabularnewline
29 & 0.198928 & 1.528 & 0.065929 \tabularnewline
30 & -0.252039 & -1.9359 & 0.028835 \tabularnewline
31 & 0.259294 & 1.9917 & 0.025521 \tabularnewline
32 & -0.067882 & -0.5214 & 0.302017 \tabularnewline
33 & -0.065695 & -0.5046 & 0.307855 \tabularnewline
34 & 0.152545 & 1.1717 & 0.12301 \tabularnewline
35 & -0.277317 & -2.1301 & 0.018671 \tabularnewline
36 & 0.182784 & 1.404 & 0.082782 \tabularnewline
37 & -0.107136 & -0.8229 & 0.206932 \tabularnewline
38 & 0.075361 & 0.5789 & 0.282443 \tabularnewline
39 & -0.012525 & -0.0962 & 0.461841 \tabularnewline
40 & 0.015242 & 0.1171 & 0.4536 \tabularnewline
41 & 0.035074 & 0.2694 & 0.394278 \tabularnewline
42 & -0.158403 & -1.2167 & 0.114279 \tabularnewline
43 & 0.181164 & 1.3915 & 0.084642 \tabularnewline
44 & -0.178522 & -1.3712 & 0.087745 \tabularnewline
45 & 0.143626 & 1.1032 & 0.137207 \tabularnewline
46 & -0.048763 & -0.3746 & 0.354666 \tabularnewline
47 & -0.056044 & -0.4305 & 0.334206 \tabularnewline
48 & 0.108507 & 0.8335 & 0.203975 \tabularnewline
\hline
\end{tabular}
%Source: https://freestatistics.org/blog/index.php?pk=112803&T=1

[TABLE]
[ROW][C]Autocorrelation Function[/C][/ROW]
[ROW][C]Time lag k[/C][C]ACF(k)[/C][C]T-STAT[/C][C]P-value[/C][/ROW]
[ROW][C]1[/C][C]-0.534454[/C][C]-4.1052[/C][C]6.3e-05[/C][/ROW]
[ROW][C]2[/C][C]0.216346[/C][C]1.6618[/C][C]0.05093[/C][/ROW]
[ROW][C]3[/C][C]-0.071152[/C][C]-0.5465[/C][C]0.293382[/C][/ROW]
[ROW][C]4[/C][C]-0.15774[/C][C]-1.2116[/C][C]0.115244[/C][/ROW]
[ROW][C]5[/C][C]0.161989[/C][C]1.2443[/C][C]0.109161[/C][/ROW]
[ROW][C]6[/C][C]-0.209132[/C][C]-1.6064[/C][C]0.056766[/C][/ROW]
[ROW][C]7[/C][C]0.304422[/C][C]2.3383[/C][C]0.01139[/C][/ROW]
[ROW][C]8[/C][C]-0.246797[/C][C]-1.8957[/C][C]0.031452[/C][/ROW]
[ROW][C]9[/C][C]0.153723[/C][C]1.1808[/C][C]0.121216[/C][/ROW]
[ROW][C]10[/C][C]-0.12481[/C][C]-0.9587[/C][C]0.170815[/C][/ROW]
[ROW][C]11[/C][C]-0.033488[/C][C]-0.2572[/C][C]0.39895[/C][/ROW]
[ROW][C]12[/C][C]0.144352[/C][C]1.1088[/C][C]0.136011[/C][/ROW]
[ROW][C]13[/C][C]-0.219648[/C][C]-1.6872[/C][C]0.048427[/C][/ROW]
[ROW][C]14[/C][C]0.178666[/C][C]1.3724[/C][C]0.087574[/C][/ROW]
[ROW][C]15[/C][C]-0.069613[/C][C]-0.5347[/C][C]0.297431[/C][/ROW]
[ROW][C]16[/C][C]0.050475[/C][C]0.3877[/C][C]0.349813[/C][/ROW]
[ROW][C]17[/C][C]0.068977[/C][C]0.5298[/C][C]0.299112[/C][/ROW]
[ROW][C]18[/C][C]-0.052686[/C][C]-0.4047[/C][C]0.343586[/C][/ROW]
[ROW][C]19[/C][C]-0.009978[/C][C]-0.0766[/C][C]0.469585[/C][/ROW]
[ROW][C]20[/C][C]-0.040436[/C][C]-0.3106[/C][C]0.378601[/C][/ROW]
[ROW][C]21[/C][C]0.005232[/C][C]0.0402[/C][C]0.484041[/C][/ROW]
[ROW][C]22[/C][C]0.060689[/C][C]0.4662[/C][C]0.321409[/C][/ROW]
[ROW][C]23[/C][C]-0.106058[/C][C]-0.8147[/C][C]0.209274[/C][/ROW]
[ROW][C]24[/C][C]0.12635[/C][C]0.9705[/C][C]0.167877[/C][/ROW]
[ROW][C]25[/C][C]-0.055141[/C][C]-0.4235[/C][C]0.336719[/C][/ROW]
[ROW][C]26[/C][C]-0.035414[/C][C]-0.272[/C][C]0.393278[/C][/ROW]
[ROW][C]27[/C][C]0.072817[/C][C]0.5593[/C][C]0.28903[/C][/ROW]
[ROW][C]28[/C][C]-0.155335[/C][C]-1.1931[/C][C]0.118793[/C][/ROW]
[ROW][C]29[/C][C]0.198928[/C][C]1.528[/C][C]0.065929[/C][/ROW]
[ROW][C]30[/C][C]-0.252039[/C][C]-1.9359[/C][C]0.028835[/C][/ROW]
[ROW][C]31[/C][C]0.259294[/C][C]1.9917[/C][C]0.025521[/C][/ROW]
[ROW][C]32[/C][C]-0.067882[/C][C]-0.5214[/C][C]0.302017[/C][/ROW]
[ROW][C]33[/C][C]-0.065695[/C][C]-0.5046[/C][C]0.307855[/C][/ROW]
[ROW][C]34[/C][C]0.152545[/C][C]1.1717[/C][C]0.12301[/C][/ROW]
[ROW][C]35[/C][C]-0.277317[/C][C]-2.1301[/C][C]0.018671[/C][/ROW]
[ROW][C]36[/C][C]0.182784[/C][C]1.404[/C][C]0.082782[/C][/ROW]
[ROW][C]37[/C][C]-0.107136[/C][C]-0.8229[/C][C]0.206932[/C][/ROW]
[ROW][C]38[/C][C]0.075361[/C][C]0.5789[/C][C]0.282443[/C][/ROW]
[ROW][C]39[/C][C]-0.012525[/C][C]-0.0962[/C][C]0.461841[/C][/ROW]
[ROW][C]40[/C][C]0.015242[/C][C]0.1171[/C][C]0.4536[/C][/ROW]
[ROW][C]41[/C][C]0.035074[/C][C]0.2694[/C][C]0.394278[/C][/ROW]
[ROW][C]42[/C][C]-0.158403[/C][C]-1.2167[/C][C]0.114279[/C][/ROW]
[ROW][C]43[/C][C]0.181164[/C][C]1.3915[/C][C]0.084642[/C][/ROW]
[ROW][C]44[/C][C]-0.178522[/C][C]-1.3712[/C][C]0.087745[/C][/ROW]
[ROW][C]45[/C][C]0.143626[/C][C]1.1032[/C][C]0.137207[/C][/ROW]
[ROW][C]46[/C][C]-0.048763[/C][C]-0.3746[/C][C]0.354666[/C][/ROW]
[ROW][C]47[/C][C]-0.056044[/C][C]-0.4305[/C][C]0.334206[/C][/ROW]
[ROW][C]48[/C][C]0.108507[/C][C]0.8335[/C][C]0.203975[/C][/ROW]
[/TABLE]
Source: https://freestatistics.org/blog/index.php?pk=112803&T=1

Globally Unique Identifier (entire table): ba.freestatistics.org/blog/index.php?pk=112803&T=1

As an alternative you can also use a QR Code:  

The GUIDs for individual cells are displayed in the table below:

Autocorrelation Function
Time lag kACF(k)T-STATP-value
1-0.534454-4.10526.3e-05
20.2163461.66180.05093
3-0.071152-0.54650.293382
4-0.15774-1.21160.115244
50.1619891.24430.109161
6-0.209132-1.60640.056766
70.3044222.33830.01139
8-0.246797-1.89570.031452
90.1537231.18080.121216
10-0.12481-0.95870.170815
11-0.033488-0.25720.39895
120.1443521.10880.136011
13-0.219648-1.68720.048427
140.1786661.37240.087574
15-0.069613-0.53470.297431
160.0504750.38770.349813
170.0689770.52980.299112
18-0.052686-0.40470.343586
19-0.009978-0.07660.469585
20-0.040436-0.31060.378601
210.0052320.04020.484041
220.0606890.46620.321409
23-0.106058-0.81470.209274
240.126350.97050.167877
25-0.055141-0.42350.336719
26-0.035414-0.2720.393278
270.0728170.55930.28903
28-0.155335-1.19310.118793
290.1989281.5280.065929
30-0.252039-1.93590.028835
310.2592941.99170.025521
32-0.067882-0.52140.302017
33-0.065695-0.50460.307855
340.1525451.17170.12301
35-0.277317-2.13010.018671
360.1827841.4040.082782
37-0.107136-0.82290.206932
380.0753610.57890.282443
39-0.012525-0.09620.461841
400.0152420.11710.4536
410.0350740.26940.394278
42-0.158403-1.21670.114279
430.1811641.39150.084642
44-0.178522-1.37120.087745
450.1436261.10320.137207
46-0.048763-0.37460.354666
47-0.056044-0.43050.334206
480.1085070.83350.203975


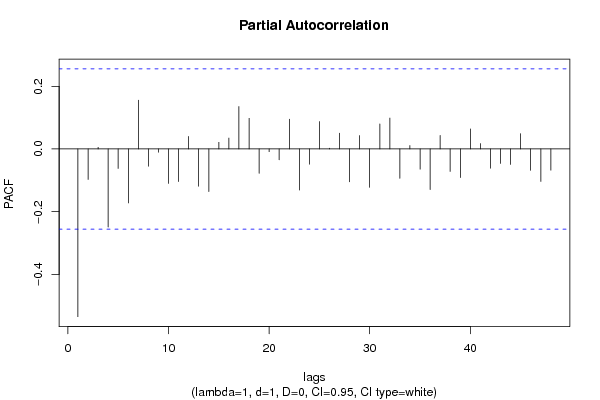
Partial Autocorrelation Function
Time lag kPACF(k)T-STATP-value
1-0.534454-4.10526.3e-05
2-0.097003-0.74510.229587
30.0054380.04180.483412
4-0.249027-1.91280.030315
5-0.06214-0.47730.317454
6-0.172125-1.32210.095616
70.1554191.19380.118668
8-0.054652-0.41980.338081
9-0.010208-0.07840.468883
10-0.109889-0.84410.201018
11-0.103733-0.79680.214385
120.0401620.30850.379399
13-0.11857-0.91080.183066
14-0.135753-1.04270.150661
150.021190.16280.43563
160.0349560.26850.394624
170.1351391.0380.151747
180.0977850.75110.227789
19-0.077437-0.59480.277125
20-0.008749-0.06720.473324
21-0.034561-0.26550.395788
220.0949710.72950.234296
23-0.130804-1.00470.159566
24-0.048405-0.37180.355685
250.0873780.67120.252369
260.0026570.02040.491894
270.0505040.38790.349733
28-0.104711-0.80430.212226
290.0427950.32870.371767
30-0.12231-0.93950.175658
310.0798110.6130.271104
320.0987930.75880.225483
33-0.093408-0.71750.237955
340.0108750.08350.466856
35-0.064245-0.49350.311753
36-0.129465-0.99440.162035
370.0432740.33240.370384
38-0.071571-0.54970.292285
39-0.091148-0.70010.243302
400.0639280.4910.312611
410.0174140.13380.447023
42-0.061115-0.46940.320246
43-0.046159-0.35460.362095
44-0.049259-0.37840.353259
450.0487640.37460.354663
46-0.068083-0.5230.301483
47-0.103276-0.79330.215398
48-0.067698-0.520.302506

\begin{tabular}{lllllllll}
\hline
Partial Autocorrelation Function \tabularnewline
Time lag k & PACF(k) & T-STAT & P-value \tabularnewline
1 & -0.534454 & -4.1052 & 6.3e-05 \tabularnewline
2 & -0.097003 & -0.7451 & 0.229587 \tabularnewline
3 & 0.005438 & 0.0418 & 0.483412 \tabularnewline
4 & -0.249027 & -1.9128 & 0.030315 \tabularnewline
5 & -0.06214 & -0.4773 & 0.317454 \tabularnewline
6 & -0.172125 & -1.3221 & 0.095616 \tabularnewline
7 & 0.155419 & 1.1938 & 0.118668 \tabularnewline
8 & -0.054652 & -0.4198 & 0.338081 \tabularnewline
9 & -0.010208 & -0.0784 & 0.468883 \tabularnewline
10 & -0.109889 & -0.8441 & 0.201018 \tabularnewline
11 & -0.103733 & -0.7968 & 0.214385 \tabularnewline
12 & 0.040162 & 0.3085 & 0.379399 \tabularnewline
13 & -0.11857 & -0.9108 & 0.183066 \tabularnewline
14 & -0.135753 & -1.0427 & 0.150661 \tabularnewline
15 & 0.02119 & 0.1628 & 0.43563 \tabularnewline
16 & 0.034956 & 0.2685 & 0.394624 \tabularnewline
17 & 0.135139 & 1.038 & 0.151747 \tabularnewline
18 & 0.097785 & 0.7511 & 0.227789 \tabularnewline
19 & -0.077437 & -0.5948 & 0.277125 \tabularnewline
20 & -0.008749 & -0.0672 & 0.473324 \tabularnewline
21 & -0.034561 & -0.2655 & 0.395788 \tabularnewline
22 & 0.094971 & 0.7295 & 0.234296 \tabularnewline
23 & -0.130804 & -1.0047 & 0.159566 \tabularnewline
24 & -0.048405 & -0.3718 & 0.355685 \tabularnewline
25 & 0.087378 & 0.6712 & 0.252369 \tabularnewline
26 & 0.002657 & 0.0204 & 0.491894 \tabularnewline
27 & 0.050504 & 0.3879 & 0.349733 \tabularnewline
28 & -0.104711 & -0.8043 & 0.212226 \tabularnewline
29 & 0.042795 & 0.3287 & 0.371767 \tabularnewline
30 & -0.12231 & -0.9395 & 0.175658 \tabularnewline
31 & 0.079811 & 0.613 & 0.271104 \tabularnewline
32 & 0.098793 & 0.7588 & 0.225483 \tabularnewline
33 & -0.093408 & -0.7175 & 0.237955 \tabularnewline
34 & 0.010875 & 0.0835 & 0.466856 \tabularnewline
35 & -0.064245 & -0.4935 & 0.311753 \tabularnewline
36 & -0.129465 & -0.9944 & 0.162035 \tabularnewline
37 & 0.043274 & 0.3324 & 0.370384 \tabularnewline
38 & -0.071571 & -0.5497 & 0.292285 \tabularnewline
39 & -0.091148 & -0.7001 & 0.243302 \tabularnewline
40 & 0.063928 & 0.491 & 0.312611 \tabularnewline
41 & 0.017414 & 0.1338 & 0.447023 \tabularnewline
42 & -0.061115 & -0.4694 & 0.320246 \tabularnewline
43 & -0.046159 & -0.3546 & 0.362095 \tabularnewline
44 & -0.049259 & -0.3784 & 0.353259 \tabularnewline
45 & 0.048764 & 0.3746 & 0.354663 \tabularnewline
46 & -0.068083 & -0.523 & 0.301483 \tabularnewline
47 & -0.103276 & -0.7933 & 0.215398 \tabularnewline
48 & -0.067698 & -0.52 & 0.302506 \tabularnewline
\hline
\end{tabular}
%Source: https://freestatistics.org/blog/index.php?pk=112803&T=2

[TABLE]
[ROW][C]Partial Autocorrelation Function[/C][/ROW]
[ROW][C]Time lag k[/C][C]PACF(k)[/C][C]T-STAT[/C][C]P-value[/C][/ROW]
[ROW][C]1[/C][C]-0.534454[/C][C]-4.1052[/C][C]6.3e-05[/C][/ROW]
[ROW][C]2[/C][C]-0.097003[/C][C]-0.7451[/C][C]0.229587[/C][/ROW]
[ROW][C]3[/C][C]0.005438[/C][C]0.0418[/C][C]0.483412[/C][/ROW]
[ROW][C]4[/C][C]-0.249027[/C][C]-1.9128[/C][C]0.030315[/C][/ROW]
[ROW][C]5[/C][C]-0.06214[/C][C]-0.4773[/C][C]0.317454[/C][/ROW]
[ROW][C]6[/C][C]-0.172125[/C][C]-1.3221[/C][C]0.095616[/C][/ROW]
[ROW][C]7[/C][C]0.155419[/C][C]1.1938[/C][C]0.118668[/C][/ROW]
[ROW][C]8[/C][C]-0.054652[/C][C]-0.4198[/C][C]0.338081[/C][/ROW]
[ROW][C]9[/C][C]-0.010208[/C][C]-0.0784[/C][C]0.468883[/C][/ROW]
[ROW][C]10[/C][C]-0.109889[/C][C]-0.8441[/C][C]0.201018[/C][/ROW]
[ROW][C]11[/C][C]-0.103733[/C][C]-0.7968[/C][C]0.214385[/C][/ROW]
[ROW][C]12[/C][C]0.040162[/C][C]0.3085[/C][C]0.379399[/C][/ROW]
[ROW][C]13[/C][C]-0.11857[/C][C]-0.9108[/C][C]0.183066[/C][/ROW]
[ROW][C]14[/C][C]-0.135753[/C][C]-1.0427[/C][C]0.150661[/C][/ROW]
[ROW][C]15[/C][C]0.02119[/C][C]0.1628[/C][C]0.43563[/C][/ROW]
[ROW][C]16[/C][C]0.034956[/C][C]0.2685[/C][C]0.394624[/C][/ROW]
[ROW][C]17[/C][C]0.135139[/C][C]1.038[/C][C]0.151747[/C][/ROW]
[ROW][C]18[/C][C]0.097785[/C][C]0.7511[/C][C]0.227789[/C][/ROW]
[ROW][C]19[/C][C]-0.077437[/C][C]-0.5948[/C][C]0.277125[/C][/ROW]
[ROW][C]20[/C][C]-0.008749[/C][C]-0.0672[/C][C]0.473324[/C][/ROW]
[ROW][C]21[/C][C]-0.034561[/C][C]-0.2655[/C][C]0.395788[/C][/ROW]
[ROW][C]22[/C][C]0.094971[/C][C]0.7295[/C][C]0.234296[/C][/ROW]
[ROW][C]23[/C][C]-0.130804[/C][C]-1.0047[/C][C]0.159566[/C][/ROW]
[ROW][C]24[/C][C]-0.048405[/C][C]-0.3718[/C][C]0.355685[/C][/ROW]
[ROW][C]25[/C][C]0.087378[/C][C]0.6712[/C][C]0.252369[/C][/ROW]
[ROW][C]26[/C][C]0.002657[/C][C]0.0204[/C][C]0.491894[/C][/ROW]
[ROW][C]27[/C][C]0.050504[/C][C]0.3879[/C][C]0.349733[/C][/ROW]
[ROW][C]28[/C][C]-0.104711[/C][C]-0.8043[/C][C]0.212226[/C][/ROW]
[ROW][C]29[/C][C]0.042795[/C][C]0.3287[/C][C]0.371767[/C][/ROW]
[ROW][C]30[/C][C]-0.12231[/C][C]-0.9395[/C][C]0.175658[/C][/ROW]
[ROW][C]31[/C][C]0.079811[/C][C]0.613[/C][C]0.271104[/C][/ROW]
[ROW][C]32[/C][C]0.098793[/C][C]0.7588[/C][C]0.225483[/C][/ROW]
[ROW][C]33[/C][C]-0.093408[/C][C]-0.7175[/C][C]0.237955[/C][/ROW]
[ROW][C]34[/C][C]0.010875[/C][C]0.0835[/C][C]0.466856[/C][/ROW]
[ROW][C]35[/C][C]-0.064245[/C][C]-0.4935[/C][C]0.311753[/C][/ROW]
[ROW][C]36[/C][C]-0.129465[/C][C]-0.9944[/C][C]0.162035[/C][/ROW]
[ROW][C]37[/C][C]0.043274[/C][C]0.3324[/C][C]0.370384[/C][/ROW]
[ROW][C]38[/C][C]-0.071571[/C][C]-0.5497[/C][C]0.292285[/C][/ROW]
[ROW][C]39[/C][C]-0.091148[/C][C]-0.7001[/C][C]0.243302[/C][/ROW]
[ROW][C]40[/C][C]0.063928[/C][C]0.491[/C][C]0.312611[/C][/ROW]
[ROW][C]41[/C][C]0.017414[/C][C]0.1338[/C][C]0.447023[/C][/ROW]
[ROW][C]42[/C][C]-0.061115[/C][C]-0.4694[/C][C]0.320246[/C][/ROW]
[ROW][C]43[/C][C]-0.046159[/C][C]-0.3546[/C][C]0.362095[/C][/ROW]
[ROW][C]44[/C][C]-0.049259[/C][C]-0.3784[/C][C]0.353259[/C][/ROW]
[ROW][C]45[/C][C]0.048764[/C][C]0.3746[/C][C]0.354663[/C][/ROW]
[ROW][C]46[/C][C]-0.068083[/C][C]-0.523[/C][C]0.301483[/C][/ROW]
[ROW][C]47[/C][C]-0.103276[/C][C]-0.7933[/C][C]0.215398[/C][/ROW]
[ROW][C]48[/C][C]-0.067698[/C][C]-0.52[/C][C]0.302506[/C][/ROW]
[/TABLE]
Source: https://freestatistics.org/blog/index.php?pk=112803&T=2

Globally Unique Identifier (entire table): ba.freestatistics.org/blog/index.php?pk=112803&T=2

As an alternative you can also use a QR Code:  

The GUIDs for individual cells are displayed in the table below:

Partial Autocorrelation Function
Time lag kPACF(k)T-STATP-value
1-0.534454-4.10526.3e-05
2-0.097003-0.74510.229587
30.0054380.04180.483412
4-0.249027-1.91280.030315
5-0.06214-0.47730.317454
6-0.172125-1.32210.095616
70.1554191.19380.118668
8-0.054652-0.41980.338081
9-0.010208-0.07840.468883
10-0.109889-0.84410.201018
11-0.103733-0.79680.214385
120.0401620.30850.379399
13-0.11857-0.91080.183066
14-0.135753-1.04270.150661
150.021190.16280.43563
160.0349560.26850.394624
170.1351391.0380.151747
180.0977850.75110.227789
19-0.077437-0.59480.277125
20-0.008749-0.06720.473324
21-0.034561-0.26550.395788
220.0949710.72950.234296
23-0.130804-1.00470.159566
24-0.048405-0.37180.355685
250.0873780.67120.252369
260.0026570.02040.491894
270.0505040.38790.349733
28-0.104711-0.80430.212226
290.0427950.32870.371767
30-0.12231-0.93950.175658
310.0798110.6130.271104
320.0987930.75880.225483
33-0.093408-0.71750.237955
340.0108750.08350.466856
35-0.064245-0.49350.311753
36-0.129465-0.99440.162035
370.0432740.33240.370384
38-0.071571-0.54970.292285
39-0.091148-0.70010.243302
400.0639280.4910.312611
410.0174140.13380.447023
42-0.061115-0.46940.320246
43-0.046159-0.35460.362095
44-0.049259-0.37840.353259
450.0487640.37460.354663
46-0.068083-0.5230.301483
47-0.103276-0.79330.215398
48-0.067698-0.520.302506


Parameters (Session):
par1 = 48 ; par2 = 1 ; par3 = 1 ; par4 = 0 ; par5 = 12 ; par6 = White Noise ; par7 = 0.95 ;
Parameters (R input):
par1 = 48 ; par2 = 1 ; par3 = 1 ; par4 = 0 ; par5 = 12 ; par6 = White Noise ; par7 = 0.95 ; par8 = ;
R code (references can be found in the software module):
if (par1 == 'Default') {
par1 = 10*log10(length(x))
} else {
par1 <- as.numeric(par1)
}
par2 <- as.numeric(par2)
par3 <- as.numeric(par3)
par4 <- as.numeric(par4)
par5 <- as.numeric(par5)
if (par6 == 'White Noise') par6 <- 'white' else par6 <- 'ma'
par7 <- as.numeric(par7)
if (par8 != '') par8 <- as.numeric(par8)
ox <- x
if (par8 == '') {
if (par2 == 0) {
x <- log(x)
} else {
x <- (x ^ par2 - 1) / par2
}
} else {
x <- log(x,base=par8)
}
if (par3 > 0) x <- diff(x,lag=1,difference=par3)
if (par4 > 0) x <- diff(x,lag=par5,difference=par4)
bitmap(file='picts.png')
op <- par(mfrow=c(2,1))
plot(ox,type='l',main='Original Time Series',xlab='time',ylab='value')
if (par8=='') {
mytitle <- paste('Working Time Series (lambda=',par2,', d=',par3,', D=',par4,')',sep='')
mysub <- paste('(lambda=',par2,', d=',par3,', D=',par4,', CI=', par7, ', CI type=',par6,')',sep='')
} else {
mytitle <- paste('Working Time Series (base=',par8,', d=',par3,', D=',par4,')',sep='')
mysub <- paste('(base=',par8,', d=',par3,', D=',par4,', CI=', par7, ', CI type=',par6,')',sep='')
}
plot(x,type='l', main=mytitle,xlab='time',ylab='value')
par(op)
dev.off()
bitmap(file='pic1.png')
racf <- acf(x, par1, main='Autocorrelation', xlab='time lag', ylab='ACF', ci.type=par6, ci=par7, sub=mysub)
dev.off()
bitmap(file='pic2.png')
rpacf <- pacf(x,par1,main='Partial Autocorrelation',xlab='lags',ylab='PACF',sub=mysub)
dev.off()
(myacf <- c(racf$acf))
(mypacf <- c(rpacf$acf))
lengthx <- length(x)
sqrtn <- sqrt(lengthx)
load(file='createtable')
a<-table.start()
a<-table.row.start(a)
a<-table.element(a,'Autocorrelation Function',4,TRUE)
a<-table.row.end(a)
a<-table.row.start(a)
a<-table.element(a,'Time lag k',header=TRUE)
a<-table.element(a,hyperlink('basics.htm','ACF(k)','click here for more information about the Autocorrelation Function'),header=TRUE)
a<-table.element(a,'T-STAT',header=TRUE)
a<-table.element(a,'P-value',header=TRUE)
a<-table.row.end(a)
for (i in 2:(par1+1)) {
a<-table.row.start(a)
a<-table.element(a,i-1,header=TRUE)
a<-table.element(a,round(myacf[i],6))
mytstat <- myacf[i]*sqrtn
a<-table.element(a,round(mytstat,4))
a<-table.element(a,round(1-pt(abs(mytstat),lengthx),6))
a<-table.row.end(a)
}
a<-table.end(a)
table.save(a,file='mytable.tab')
a<-table.start()
a<-table.row.start(a)
a<-table.element(a,'Partial Autocorrelation Function',4,TRUE)
a<-table.row.end(a)
a<-table.row.start(a)
a<-table.element(a,'Time lag k',header=TRUE)
a<-table.element(a,hyperlink('basics.htm','PACF(k)','click here for more information about the Partial Autocorrelation Function'),header=TRUE)
a<-table.element(a,'T-STAT',header=TRUE)
a<-table.element(a,'P-value',header=TRUE)
a<-table.row.end(a)
for (i in 1:par1) {
a<-table.row.start(a)
a<-table.element(a,i,header=TRUE)
a<-table.element(a,round(mypacf[i],6))
mytstat <- mypacf[i]*sqrtn
a<-table.element(a,round(mytstat,4))
a<-table.element(a,round(1-pt(abs(mytstat),lengthx),6))
a<-table.row.end(a)
}
a<-table.end(a)
table.save(a,file='mytable1.tab')