library(plspm)
library(diagram)
y <- as.data.frame(t(y))
is.data.frame(y)
head(y)
trim <- function(char) {
return(sub('s+$', '', sub('^s+', '', char)))
}
(latnames <- strsplit(par1,' ')[[1]])
(n <- length(latnames))
(L1 <- as.numeric(strsplit(par3,' ')[[1]]))
(L2 <- as.numeric(strsplit(par4,' ')[[1]]))
(L3 <- as.numeric(strsplit(par5,' ')[[1]]))
(L4 <- as.numeric(strsplit(par6,' ')[[1]]))
(L5 <- as.numeric(strsplit(par7,' ')[[1]]))
(L6 <- as.numeric(strsplit(par8,' ')[[1]]))
(L7 <- as.numeric(strsplit(par9,' ')[[1]]))
(L8 <- as.numeric(strsplit(par10,' ')[[1]]))
(S1 <- as.numeric(strsplit(par11,' ')[[1]]))
(S2 <- as.numeric(strsplit(par12,' ')[[1]]))
(S3 <- as.numeric(strsplit(par13,' ')[[1]]))
(S4 <- as.numeric(strsplit(par14,' ')[[1]]))
(S5 <- as.numeric(strsplit(par15,' ')[[1]]))
(S6 <- as.numeric(strsplit(par16,' ')[[1]]))
(S7 <- as.numeric(strsplit(par17,' ')[[1]]))
(S8 <- as.numeric(strsplit(par18,' ')[[1]]))
if (n==1) sat.mat <- rbind(S1)
if (n==2) sat.mat <- rbind(S1,S2)
if (n==3) sat.mat <- rbind(S1,S2,S3)
if (n==4) sat.mat <- rbind(S1,S2,S3,S4)
if (n==5) sat.mat <- rbind(S1,S2,S3,S4,S5)
if (n==6) sat.mat <- rbind(S1,S2,S3,S4,S5,S6)
if (n==7) sat.mat <- rbind(S1,S2,S3,S4,S5,S6,S7)
if (n==8) sat.mat <- rbind(S1,S2,S3,S4,S5,S6,S7,S8)
sat.mat
if (n==1) sat.sets <- list(L1)
if (n==2) sat.sets <- list(L1,L2)
if (n==3) sat.sets <- list(L1,L2,L3)
if (n==4) sat.sets <- list(L1,L2,L3,L4)
if (n==5) sat.sets <- list(L1,L2,L3,L4,L5)
if (n==6) sat.sets <- list(L1,L2,L3,L4,L5,L6)
if (n==7) sat.sets <- list(L1,L2,L3,L4,L5,L6,L7)
if (n==8) sat.sets <- list(L1,L2,L3,L4,L5,L6,L7,L8)
sat.sets
(sat.mod <- strsplit(par2,' ')[[1]])
res <- plspm(x=y, sat.mat, sat.sets, sat.mod, scheme='centroid', scaled=TRUE, boot.val=TRUE)
(r <- summary(res))
myr <- res$path.coefs
myind <- 1
for (j in 1:(length(sat.mat[1,])-1)) {
for (i in 1:length(sat.mat[,1])) {
if (sat.mat[i,j] == 1) {
if ((res$boot$path[myind,'perc.05'] < 0) && (res$boot$path[myind,'perc.95'] > 0)) {
myr[i,j] = 0
}
myind = myind + 1
}
}
}
bitmap(file='test1.png')
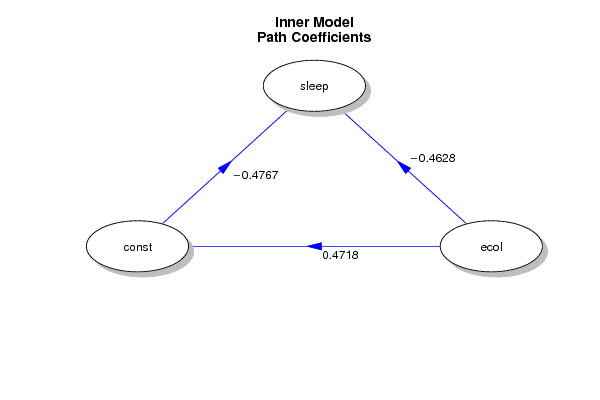
plotmat(round(myr,4), pos = NULL, curve = 0, name = latnames,
lwd = 1, box.lwd = 1, cex.txt = 1, box.type = 'circle',
box.prop = 0.5, box.cex = 1, arr.type = 'triangle',
arr.pos = 0.5, shadow.size = 0.01, prefix = '', arr.lcol = 'blue',
arr.col = 'blue', arr.width = 0.2, main = c('Inner Model',
'Path Coefficients'))
dev.off()
myr <- res$path.coefs
myind <- 1
myi <- 1
for (j in 1:(length(sat.mat[1,])-1)) {
for (i in 1:length(sat.mat[,1])) {
if (i > j) {
myr[i,j] = res$boot$total.efs[myi,'Original']
myi = myi + 1
if ((res$boot$total.efs[myind,'perc.05'] < 0) && (res$boot$total.efs[myind,'perc.95'] > 0)) {
myr[i,j] = 0
}
myind = myind + 1
}
}
}
bitmap(file='test2.png')
plotmat(round(myr,4), pos = NULL, curve = 0, name = latnames,
lwd = 1, box.lwd = 1, cex.txt = 1, box.type = 'circle',
box.prop = 0.5, box.cex = 1, arr.type = 'triangle',
arr.pos = 0.5, shadow.size = 0.01, prefix = '', arr.lcol = 'blue',
arr.col = 'blue', arr.width = 0.2, main = c('Inner Model',
'Total Effects'))
dev.off()
load(file='createtable')
a<-table.start()
a<-table.row.start(a)
a<-table.element(a,'PARTIAL LEAST SQUARES PATH MODELING (PLS-PM)',2,TRUE)
a<-table.row.end(a)
a<-table.row.start(a)
a<-table.element(a,'MODEL SPECIFICATION',2,TRUE)
a<-table.row.end(a)
a<-table.row.start(a)
a<-table.element(a,'Number of Cases',header=TRUE)
a<-table.element(a,r$xxx$obs)
a<-table.row.end(a)
a<-table.row.start(a)
a<-table.element(a,'Latent Variables',header=TRUE)
a<-table.element(a,n)
a<-table.row.end(a)
a<-table.row.start(a)
a<-table.element(a,'Manifest Variables',header=TRUE)
a<-table.element(a,length(y[1,]))
a<-table.row.end(a)
a<-table.row.start(a)
a<-table.element(a,'Scaled?',header=TRUE)
a<-table.element(a,r$xxx$scaled)
a<-table.row.end(a)
a<-table.row.start(a)
a<-table.element(a,'Weighting Scheme',header=TRUE)
a<-table.element(a,r$xx$scheme)
a<-table.row.end(a)
a<-table.row.start(a)
a<-table.element(a,'Bootstrapping?',header=TRUE)
a<-table.element(a,r$xx$boot.val)
a<-table.row.end(a)
a<-table.row.start(a)
a<-table.element(a,'Bootstrap samples',header=TRUE)
a<-table.element(a,r$xx$br)
a<-table.row.end(a)
a<-table.end(a)
table.save(a,file='mytable1.tab')
a<-table.start()
a<-table.row.start(a)
a<-table.element(a,'BLOCKS DEFINITION',4,TRUE)
a<-table.row.end(a)
a<-table.row.start(a)
a<-table.element(a,'Block',header=TRUE)
a<-table.element(a,'Type',header=TRUE)
a<-table.element(a,'NMVs',header=TRUE)
a<-table.element(a,'Mode',header=TRUE)
a<-table.row.end(a)
for (i in 1:n) {
a<-table.row.start(a)
a<-table.element(a,latnames[i],header=TRUE)
a<-table.element(a,r$input$Type[i])
a<-table.element(a,r$unidim$MVs[i])
a<-table.element(a,r$unidim$Type.measure[i])
a<-table.row.end(a)
}
a<-table.end(a)
table.save(a,file='mytable2.tab')
a<-table.start()
a<-table.row.start(a)
a<-table.element(a,'BLOCKS UNIDIMENSIONALITY',7,TRUE)
a<-table.row.end(a)
a<-table.row.start(a)
a<-table.element(a,'Block',header=TRUE)
a<-table.element(a,'Type.measure',header=TRUE)
a<-table.element(a,'MVs',header=TRUE)
a<-table.element(a,'eig.1st',header=TRUE)
a<-table.element(a,'eig.2nd',header=TRUE)
a<-table.element(a,'C.alpha',header=TRUE)
a<-table.element(a,'DG.rho',header=TRUE)
a<-table.row.end(a)
for (i in 1:n) {
a<-table.row.start(a)
a<-table.element(a,latnames[i],header=TRUE)
a<-table.element(a,r$unidim$Type.measure[i])
a<-table.element(a,r$unidim$MVs[i])
a<-table.element(a,r$unidim$eig.1st[i])
a<-table.element(a,r$unidim$eig.2nd[i])
a<-table.element(a,r$unidim$C.alpha[i])
a<-table.element(a,r$unidim$DG.rho[i])
a<-table.row.end(a)
}
a<-table.end(a)
table.save(a,file='mytable3.tab')
a<-table.start()
a<-table.row.start(a)
a<-table.element(a,'OUTER MODEL',5,TRUE)
a<-table.row.end(a)
a<-table.row.start(a)
a<-table.element(a,'Block',header=TRUE)
a<-table.element(a,'weights',header=TRUE)
a<-table.element(a,'std.loads',header=TRUE)
a<-table.element(a,'communal',header=TRUE)
a<-table.element(a,'redundan',header=TRUE)
a<-table.row.end(a)
for (i in 1:n) {
a<-table.row.start(a)
a<-table.element(a,latnames[i],5,header=TRUE)
a<-table.row.end(a)
for (j in 1:length(r$outer.mod[[i]][,1])) {
a<-table.row.start(a)
a<-table.element(a,rownames(r$outer.mod[[i]])[j],header=T)
a<-table.element(a,r$outer.mod[[i]][j,1])
a<-table.element(a,r$outer.mod[[i]][j,2])
a<-table.element(a,r$outer.mod[[i]][j,3])
a<-table.element(a,r$outer.mod[[i]][j,4])
a<-table.row.end(a)
}
}
a<-table.end(a)
table.save(a,file='mytable4.tab')
a<-table.start()
a<-table.row.start(a)
a<-table.element(a,'CORRELATIONS BETWEEN MVs AND LVs',n+1,TRUE)
a<-table.row.end(a)
a<-table.row.start(a)
a<-table.element(a,'Block',header=TRUE)
for (iii in 1:n) {
a<-table.element(a,latnames[iii],header=TRUE)
}
a<-table.row.end(a)
for (i in 1:n) {
a<-table.row.start(a)
a<-table.element(a,latnames[i],n+1,header=TRUE)
a<-table.row.end(a)
for (j in 1:length(r$outer.cor[[i]][,1])) {
a<-table.row.start(a)
a<-table.element(a,rownames(r$outer.cor[[i]])[j],header=T)
for (iii in 1:n) {
a<-table.element(a,r$outer.cor[[i]][j,iii])
}
a<-table.row.end(a)
}
}
a<-table.end(a)
table.save(a,file='mytable5.tab')
a<-table.start()
a<-table.row.start(a)
a<-table.element(a,'INNER MODEL',3,TRUE)
a<-table.row.end(a)
a<-table.row.start(a)
a<-table.element(a,'Block',header=TRUE)
a<-table.element(a,'Concept',header=TRUE)
a<-table.element(a,'Value',header=TRUE)
a<-table.row.end(a)
for (i in 1:(length(labels(r$inner.mod)))) {
a<-table.row.start(a)
print (paste('i=',i,sep=''))
a<-table.element(a,labels(r$inner.mod)[i],3,header=TRUE)
a<-table.row.end(a)
for (j in 1:length(r$inner.mod[[i]][,1])) {
print (paste('j=',j,sep=''))
a<-table.row.start(a)
a<-table.element(a,rownames(r$inner.mod[[i]])[j],header=T)
a<-table.element(a,r$inner.mod[[i]][j,1],header=T)
a<-table.element(a,r$inner.mod[[i]][j,2])
a<-table.row.end(a)
}
}
a<-table.end(a)
table.save(a,file='mytable6.tab')
a<-table.start()
a<-table.row.start(a)
a<-table.element(a,'CORRELATIONS BETWEEN LVs',n+1,TRUE)
a<-table.row.end(a)
a<-table.row.start(a)
a<-table.element(a,'',header=TRUE)
for (iii in 1:n) {
a<-table.element(a,latnames[iii],header=TRUE)
}
a<-table.row.end(a)
for (i in 1:n) {
a<-table.row.start(a)
a<-table.element(a,latnames[i],header=T)
for (j in 1:n) {
a<-table.element(a,r$latent.cor[i,j])
}
a<-table.row.end(a)
}
a<-table.end(a)
table.save(a,file='mytable7.tab')
a<-table.start()
a<-table.row.start(a)
a<-table.element(a,'SUMMARY INNER MODEL',8,TRUE)
a<-table.row.end(a)
a<-table.row.start(a)
a<-table.element(a,'',header=TRUE)
a<-table.element(a,'LV.Type',header=TRUE)
a<-table.element(a,'Measure',header=TRUE)
a<-table.element(a,'MVs',header=TRUE)
a<-table.element(a,'R.square',header=TRUE)
a<-table.element(a,'Av.Commu',header=TRUE)
a<-table.element(a,'Av.Redun',header=TRUE)
a<-table.element(a,'AVE',header=TRUE)
a<-table.row.end(a)
for (i in 1:n) {
a<-table.row.start(a)
a<-table.element(a,latnames[i],header=T)
a<-table.element(a,r$inner.sum[i,1])
a<-table.element(a,r$inner.sum[i,2])
a<-table.element(a,r$inner.sum[i,3])
a<-table.element(a,r$inner.sum[i,4])
a<-table.element(a,r$inner.sum[i,5])
a<-table.element(a,r$inner.sum[i,6])
a<-table.element(a,r$inner.sum[i,7])
a<-table.row.end(a)
}
a<-table.end(a)
table.save(a,file='mytable8.tab')
a<-table.start()
a<-table.row.start(a)
a<-table.element(a,'GOODNESS-OF-FIT',2,TRUE)
a<-table.row.end(a)
a<-table.row.start(a)
a<-table.element(a,'GoF',header=TRUE)
a<-table.element(a,'Value',header=TRUE)
a<-table.row.end(a)
for (i in 1:4) {
a<-table.row.start(a)
a<-table.element(a,r$gof[i,1],header=T)
a<-table.element(a,r$gof[i,2])
a<-table.row.end(a)
}
a<-table.end(a)
table.save(a,file='mytable9.tab')
a<-table.start()
a<-table.row.start(a)
a<-table.element(a,'TOTAL EFFECTS',4,TRUE)
a<-table.row.end(a)
a<-table.row.start(a)
a<-table.element(a,'relationships',header=TRUE)
a<-table.element(a,'dir.effect',header=TRUE)
a<-table.element(a,'ind.effect',header=TRUE)
a<-table.element(a,'tot.effect',header=TRUE)
a<-table.row.end(a)
for (i in 1:length(r$effects[,1])) {
a<-table.row.start(a)
a<-table.element(a,r$effects[i,1],header=T)
a<-table.element(a,r$effects[i,2])
a<-table.element(a,r$effects[i,3])
a<-table.element(a,r$effects[i,4])
a<-table.row.end(a)
}
a<-table.end(a)
table.save(a,file='mytable10.tab')
dum <- r$boot$weights
a<-table.start()
a<-table.row.start(a)
a<-table.element(a,'BOOTSTRAP VALIDATION - WEIGHTS',length(colnames(dum))+1,TRUE)
a<-table.row.end(a)
a<-table.row.start(a)
a<-table.element(a,'',header=TRUE)
for (i in 1:length(colnames(dum))) {
a<-table.element(a,colnames(dum)[i],header=TRUE)
}
a<-table.row.end(a)
for (i in 1:length(rownames(dum))) {
a<-table.row.start(a)
a<-table.element(a,rownames(dum)[i],header=T)
for (j in 1:length(colnames(dum))) {
a<-table.element(a,dum[i,j])
}
a<-table.row.end(a)
}
a<-table.end(a)
table.save(a,file='mytable11.tab')
dum <- r$boot$loadings
a<-table.start()
a<-table.row.start(a)
a<-table.element(a,'BOOTSTRAP VALIDATION - LOADINGS',length(colnames(dum))+1,TRUE)
a<-table.row.end(a)
a<-table.row.start(a)
a<-table.element(a,'',header=TRUE)
for (i in 1:length(colnames(dum))) {
a<-table.element(a,colnames(dum)[i],header=TRUE)
}
a<-table.row.end(a)
for (i in 1:length(rownames(dum))) {
a<-table.row.start(a)
a<-table.element(a,rownames(dum)[i],header=T)
for (j in 1:length(colnames(dum))) {
a<-table.element(a,dum[i,j])
}
a<-table.row.end(a)
}
a<-table.end(a)
table.save(a,file='mytable12.tab')
dum <- r$boot$paths
a<-table.start()
a<-table.row.start(a)
a<-table.element(a,'BOOTSTRAP VALIDATION - PATHS',length(colnames(dum))+1,TRUE)
a<-table.row.end(a)
a<-table.row.start(a)
a<-table.element(a,'',header=TRUE)
for (i in 1:length(colnames(dum))) {
a<-table.element(a,colnames(dum)[i],header=TRUE)
}
a<-table.row.end(a)
for (i in 1:length(rownames(dum))) {
a<-table.row.start(a)
a<-table.element(a,rownames(dum)[i],header=T)
for (j in 1:length(colnames(dum))) {
a<-table.element(a,dum[i,j])
}
a<-table.row.end(a)
}
a<-table.end(a)
table.save(a,file='mytable13.tab')
dum <- r$boot$rsq
a<-table.start()
a<-table.row.start(a)
a<-table.element(a,'BOOTSTRAP VALIDATION - RSQ',length(colnames(dum))+1,TRUE)
a<-table.row.end(a)
a<-table.row.start(a)
a<-table.element(a,'',header=TRUE)
for (i in 1:length(colnames(dum))) {
a<-table.element(a,colnames(dum)[i],header=TRUE)
}
a<-table.row.end(a)
for (i in 1:length(rownames(dum))) {
a<-table.row.start(a)
a<-table.element(a,rownames(dum)[i],header=T)
for (j in 1:length(colnames(dum))) {
a<-table.element(a,dum[i,j])
}
a<-table.row.end(a)
}
a<-table.end(a)
table.save(a,file='mytable14.tab')
dum <- r$boot$total.efs
a<-table.start()
a<-table.row.start(a)
a<-table.element(a,'BOOTSTRAP VALIDATION - TOTAL EFFECTS',length(colnames(dum))+1,TRUE)
a<-table.row.end(a)
a<-table.row.start(a)
a<-table.element(a,'',header=TRUE)
for (i in 1:length(colnames(dum))) {
a<-table.element(a,colnames(dum)[i],header=TRUE)
}
a<-table.row.end(a)
for (i in 1:length(rownames(dum))) {
a<-table.row.start(a)
a<-table.element(a,rownames(dum)[i],header=T)
for (j in 1:length(colnames(dum))) {
a<-table.element(a,dum[i,j])
}
a<-table.row.end(a)
}
a<-table.end(a)
table.save(a,file='mytable15.tab')
-SERVER-193.190.124.10:1001
|