\begin{tabular}{lllllllll}
\hline
Summary of computational transaction \tabularnewline
Raw Input & view raw input (R code)  \tabularnewline
Raw Output & view raw output of R engine  \tabularnewline
Computing time & 1 seconds \tabularnewline
R Server & 'George Udny Yule' @ 72.249.76.132 \tabularnewline
\hline
\end{tabular}
%Source: https://freestatistics.org/blog/index.php?pk=41503&T=0
[TABLE]
[ROW][C]Summary of computational transaction[/C][/ROW]
[ROW][C]Raw Input[/C][C]view raw input (R code) [/C][/ROW]
[ROW][C]Raw Output[/C][C]view raw output of R engine [/C][/ROW]
[ROW][C]Computing time[/C][C]1 seconds[/C][/ROW]
[ROW][C]R Server[/C][C]'George Udny Yule' @ 72.249.76.132[/C][/ROW]
[/TABLE]
Source: https://freestatistics.org/blog/index.php?pk=41503&T=0
If you paste this QR Code into your document, anyone with a smartphone or tablet will be able to scan it and view this table in a browser.
If you paste this QR Code into your document, anyone with a smartphone or tablet will be able to scan it and view this table in a browser.
If you paste this QR Code into your document, anyone with a smartphone or tablet will be able to scan it and view this table in a browser.
If you paste this QR Code into your document, anyone with a smartphone or tablet will be able to scan it and view this table in a browser.
If you paste this QR Code into your document, anyone with a smartphone or tablet will be able to scan it and view this table in a browser.
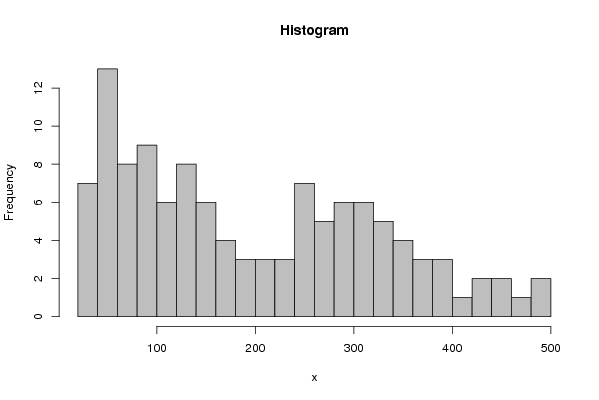
| Frequency Table (Histogram) | | Bins | Midpoint | Abs. Frequency | Rel. Frequency | Cumul. Rel. Freq. | Density | | [20,40[ | 30 | 7 | 0.059829 | 0.059829 | 0.002991 | | [40,60[ | 50 | 13 | 0.111111 | 0.17094 | 0.005556 | | [60,80[ | 70 | 8 | 0.068376 | 0.239316 | 0.003419 | | [80,100[ | 90 | 9 | 0.076923 | 0.316239 | 0.003846 | | [100,120[ | 110 | 6 | 0.051282 | 0.367521 | 0.002564 | | [120,140[ | 130 | 8 | 0.068376 | 0.435897 | 0.003419 | | [140,160[ | 150 | 6 | 0.051282 | 0.487179 | 0.002564 | | [160,180[ | 170 | 4 | 0.034188 | 0.521368 | 0.001709 | | [180,200[ | 190 | 3 | 0.025641 | 0.547009 | 0.001282 | | [200,220[ | 210 | 3 | 0.025641 | 0.57265 | 0.001282 | | [220,240[ | 230 | 3 | 0.025641 | 0.598291 | 0.001282 | | [240,260[ | 250 | 7 | 0.059829 | 0.65812 | 0.002991 | | [260,280[ | 270 | 5 | 0.042735 | 0.700855 | 0.002137 | | [280,300[ | 290 | 6 | 0.051282 | 0.752137 | 0.002564 | | [300,320[ | 310 | 6 | 0.051282 | 0.803419 | 0.002564 | | [320,340[ | 330 | 5 | 0.042735 | 0.846154 | 0.002137 | | [340,360[ | 350 | 4 | 0.034188 | 0.880342 | 0.001709 | | [360,380[ | 370 | 3 | 0.025641 | 0.905983 | 0.001282 | | [380,400[ | 390 | 3 | 0.025641 | 0.931624 | 0.001282 | | [400,420[ | 410 | 1 | 0.008547 | 0.940171 | 0.000427 | | [420,440[ | 430 | 2 | 0.017094 | 0.957265 | 0.000855 | | [440,460[ | 450 | 2 | 0.017094 | 0.974359 | 0.000855 | | [460,480[ | 470 | 1 | 0.008547 | 0.982906 | 0.000427 | | [480,500] | 490 | 2 | 0.017094 | 1 | 0.000855 |
\begin{tabular}{lllllllll}
\hline
Frequency Table (Histogram) \tabularnewline
Bins & Midpoint & Abs. Frequency & Rel. Frequency & Cumul. Rel. Freq. & Density \tabularnewline
[20,40[ & 30 & 7 & 0.059829 & 0.059829 & 0.002991 \tabularnewline
[40,60[ & 50 & 13 & 0.111111 & 0.17094 & 0.005556 \tabularnewline
[60,80[ & 70 & 8 & 0.068376 & 0.239316 & 0.003419 \tabularnewline
[80,100[ & 90 & 9 & 0.076923 & 0.316239 & 0.003846 \tabularnewline
[100,120[ & 110 & 6 & 0.051282 & 0.367521 & 0.002564 \tabularnewline
[120,140[ & 130 & 8 & 0.068376 & 0.435897 & 0.003419 \tabularnewline
[140,160[ & 150 & 6 & 0.051282 & 0.487179 & 0.002564 \tabularnewline
[160,180[ & 170 & 4 & 0.034188 & 0.521368 & 0.001709 \tabularnewline
[180,200[ & 190 & 3 & 0.025641 & 0.547009 & 0.001282 \tabularnewline
[200,220[ & 210 & 3 & 0.025641 & 0.57265 & 0.001282 \tabularnewline
[220,240[ & 230 & 3 & 0.025641 & 0.598291 & 0.001282 \tabularnewline
[240,260[ & 250 & 7 & 0.059829 & 0.65812 & 0.002991 \tabularnewline
[260,280[ & 270 & 5 & 0.042735 & 0.700855 & 0.002137 \tabularnewline
[280,300[ & 290 & 6 & 0.051282 & 0.752137 & 0.002564 \tabularnewline
[300,320[ & 310 & 6 & 0.051282 & 0.803419 & 0.002564 \tabularnewline
[320,340[ & 330 & 5 & 0.042735 & 0.846154 & 0.002137 \tabularnewline
[340,360[ & 350 & 4 & 0.034188 & 0.880342 & 0.001709 \tabularnewline
[360,380[ & 370 & 3 & 0.025641 & 0.905983 & 0.001282 \tabularnewline
[380,400[ & 390 & 3 & 0.025641 & 0.931624 & 0.001282 \tabularnewline
[400,420[ & 410 & 1 & 0.008547 & 0.940171 & 0.000427 \tabularnewline
[420,440[ & 430 & 2 & 0.017094 & 0.957265 & 0.000855 \tabularnewline
[440,460[ & 450 & 2 & 0.017094 & 0.974359 & 0.000855 \tabularnewline
[460,480[ & 470 & 1 & 0.008547 & 0.982906 & 0.000427 \tabularnewline
[480,500] & 490 & 2 & 0.017094 & 1 & 0.000855 \tabularnewline
\hline
\end{tabular}
%Source: https://freestatistics.org/blog/index.php?pk=41503&T=1
[TABLE]
[ROW][C]Frequency Table (Histogram)[/C][/ROW]
[ROW][C]Bins[/C][C]Midpoint[/C][C]Abs. Frequency[/C][C]Rel. Frequency[/C][C]Cumul. Rel. Freq.[/C][C]Density[/C][/ROW]
[ROW][C][20,40[[/C][C]30[/C][C]7[/C][C]0.059829[/C][C]0.059829[/C][C]0.002991[/C][/ROW]
[ROW][C][40,60[[/C][C]50[/C][C]13[/C][C]0.111111[/C][C]0.17094[/C][C]0.005556[/C][/ROW]
[ROW][C][60,80[[/C][C]70[/C][C]8[/C][C]0.068376[/C][C]0.239316[/C][C]0.003419[/C][/ROW]
[ROW][C][80,100[[/C][C]90[/C][C]9[/C][C]0.076923[/C][C]0.316239[/C][C]0.003846[/C][/ROW]
[ROW][C][100,120[[/C][C]110[/C][C]6[/C][C]0.051282[/C][C]0.367521[/C][C]0.002564[/C][/ROW]
[ROW][C][120,140[[/C][C]130[/C][C]8[/C][C]0.068376[/C][C]0.435897[/C][C]0.003419[/C][/ROW]
[ROW][C][140,160[[/C][C]150[/C][C]6[/C][C]0.051282[/C][C]0.487179[/C][C]0.002564[/C][/ROW]
[ROW][C][160,180[[/C][C]170[/C][C]4[/C][C]0.034188[/C][C]0.521368[/C][C]0.001709[/C][/ROW]
[ROW][C][180,200[[/C][C]190[/C][C]3[/C][C]0.025641[/C][C]0.547009[/C][C]0.001282[/C][/ROW]
[ROW][C][200,220[[/C][C]210[/C][C]3[/C][C]0.025641[/C][C]0.57265[/C][C]0.001282[/C][/ROW]
[ROW][C][220,240[[/C][C]230[/C][C]3[/C][C]0.025641[/C][C]0.598291[/C][C]0.001282[/C][/ROW]
[ROW][C][240,260[[/C][C]250[/C][C]7[/C][C]0.059829[/C][C]0.65812[/C][C]0.002991[/C][/ROW]
[ROW][C][260,280[[/C][C]270[/C][C]5[/C][C]0.042735[/C][C]0.700855[/C][C]0.002137[/C][/ROW]
[ROW][C][280,300[[/C][C]290[/C][C]6[/C][C]0.051282[/C][C]0.752137[/C][C]0.002564[/C][/ROW]
[ROW][C][300,320[[/C][C]310[/C][C]6[/C][C]0.051282[/C][C]0.803419[/C][C]0.002564[/C][/ROW]
[ROW][C][320,340[[/C][C]330[/C][C]5[/C][C]0.042735[/C][C]0.846154[/C][C]0.002137[/C][/ROW]
[ROW][C][340,360[[/C][C]350[/C][C]4[/C][C]0.034188[/C][C]0.880342[/C][C]0.001709[/C][/ROW]
[ROW][C][360,380[[/C][C]370[/C][C]3[/C][C]0.025641[/C][C]0.905983[/C][C]0.001282[/C][/ROW]
[ROW][C][380,400[[/C][C]390[/C][C]3[/C][C]0.025641[/C][C]0.931624[/C][C]0.001282[/C][/ROW]
[ROW][C][400,420[[/C][C]410[/C][C]1[/C][C]0.008547[/C][C]0.940171[/C][C]0.000427[/C][/ROW]
[ROW][C][420,440[[/C][C]430[/C][C]2[/C][C]0.017094[/C][C]0.957265[/C][C]0.000855[/C][/ROW]
[ROW][C][440,460[[/C][C]450[/C][C]2[/C][C]0.017094[/C][C]0.974359[/C][C]0.000855[/C][/ROW]
[ROW][C][460,480[[/C][C]470[/C][C]1[/C][C]0.008547[/C][C]0.982906[/C][C]0.000427[/C][/ROW]
[ROW][C][480,500][/C][C]490[/C][C]2[/C][C]0.017094[/C][C]1[/C][C]0.000855[/C][/ROW]
[/TABLE]
Source: https://freestatistics.org/blog/index.php?pk=41503&T=1
Globally Unique Identifier (entire table): ba.freestatistics.org/blog/index.php?pk=41503&T=1
As an alternative you can also use a QR Code:
The GUIDs for individual cells are displayed in the table below:
| Frequency Table (Histogram) | | Bins | Midpoint | Abs. Frequency | Rel. Frequency | Cumul. Rel. Freq. | Density | | [20,40[ | 30 | 7 | 0.059829 | 0.059829 | 0.002991 | | [40,60[ | 50 | 13 | 0.111111 | 0.17094 | 0.005556 | | [60,80[ | 70 | 8 | 0.068376 | 0.239316 | 0.003419 | | [80,100[ | 90 | 9 | 0.076923 | 0.316239 | 0.003846 | | [100,120[ | 110 | 6 | 0.051282 | 0.367521 | 0.002564 | | [120,140[ | 130 | 8 | 0.068376 | 0.435897 | 0.003419 | | [140,160[ | 150 | 6 | 0.051282 | 0.487179 | 0.002564 | | [160,180[ | 170 | 4 | 0.034188 | 0.521368 | 0.001709 | | [180,200[ | 190 | 3 | 0.025641 | 0.547009 | 0.001282 | | [200,220[ | 210 | 3 | 0.025641 | 0.57265 | 0.001282 | | [220,240[ | 230 | 3 | 0.025641 | 0.598291 | 0.001282 | | [240,260[ | 250 | 7 | 0.059829 | 0.65812 | 0.002991 | | [260,280[ | 270 | 5 | 0.042735 | 0.700855 | 0.002137 | | [280,300[ | 290 | 6 | 0.051282 | 0.752137 | 0.002564 | | [300,320[ | 310 | 6 | 0.051282 | 0.803419 | 0.002564 | | [320,340[ | 330 | 5 | 0.042735 | 0.846154 | 0.002137 | | [340,360[ | 350 | 4 | 0.034188 | 0.880342 | 0.001709 | | [360,380[ | 370 | 3 | 0.025641 | 0.905983 | 0.001282 | | [380,400[ | 390 | 3 | 0.025641 | 0.931624 | 0.001282 | | [400,420[ | 410 | 1 | 0.008547 | 0.940171 | 0.000427 | | [420,440[ | 430 | 2 | 0.017094 | 0.957265 | 0.000855 | | [440,460[ | 450 | 2 | 0.017094 | 0.974359 | 0.000855 | | [460,480[ | 470 | 1 | 0.008547 | 0.982906 | 0.000427 | | [480,500] | 490 | 2 | 0.017094 | 1 | 0.000855 |
If you paste this QR Code into your document, anyone with a smartphone or tablet will be able to scan it and view this table in a browser.
If you paste this QR Code into your document, anyone with a smartphone or tablet will be able to scan it and view this table in a browser.
If you paste this QR Code into your document, anyone with a smartphone or tablet will be able to scan it and view this table in a browser.
If you paste this QR Code into your document, anyone with a smartphone or tablet will be able to scan it and view this table in a browser.
If you paste this QR Code into your document, anyone with a smartphone or tablet will be able to scan it and view this table in a browser.
|